Author Archive
Let’s Freak Out About Vladimir Guerrero, Jr.
Big expectations — and building anticipation — can bring out the need for immediate results. Vladimir Guerrero, Jr. had humongous expectations given his lineage, his prospect status, and the utter destruction he wrought on minor league pitching. His name made him known earlier than other prospects without Hall of Fame fathers, but his play declared him ready for the majors last year, with some desiring a May call-up and the player’s union mentioning him by name last September when he remained in the minors. Through 10 games, Vladimir Guerrero, Jr. has not produced, but then, even super-duper prospects who are almost completely unlikely to bust sometimes don’t hit well for 10 games.
Given the expectations, it’s easy to call a .162/.244/.189 slash line with a 23 wRC+ disappointing. It is disappointing. Just like the 29 wRC+ Paul Goldschmidt has put up over the last 14 days. Or the 35 wRC+ from Corey Seager during the same time period. Mitch Haniger’s wRC+ over the last two weeks is a measly 49. Ronald Acuña Jr.’s is barely better at 51, with Jose Altuve just ahead at 56. It’s possible the latter numbers have escaped your attention. It’s okay to have missed them or to even have known about them and ignored them because we know they aren’t an accurate representation of the talent level these players possess. But when a player comes up from the minors for the first time and doesn’t break out immediately, second thoughts can creep into the backs of our minds about can’t-miss prospects who missed.
Looking for Vintage Madison Bumgarner
Madison Bumgarner’s reputation as a pitcher wasn’t burnished during the regular season. Bumgarner has been mostly very good as a starter prior to October. From 2011 through 2016, he averaged 212 innings and 3.9 WAR per year. During that time his 23.3 WAR places him ninth among major league starters, which is more a low-level ace than a dominator in the form of a Clayton Kershaw or Max Scherzer. No, it was in three postseasons that Bumgarner forged his reputation, pitching another 100 innings across three playoff seasons and three championships, including earning NLCS and World Series MVP honors in 2014. With the Giants unlikely to contend this season, Bumgarner’s value to the club more likely lies as a trade chip than a bringer of championships. After struggling the last two seasons, Bumgarner is pitching better in 2019, but whether he’s back to his old level of success remains to be seen.
We are still just seven Bumgarner starts into the season, but there is a bit of optimism. In his last start, Bumgarner threw the ball harder than he has in some time on the way to six innings of one-run ball against the Dodgers during which he struck eight against just two walks. The velocity wasn’t just encouraging, it was harder than he’s thrown in years.
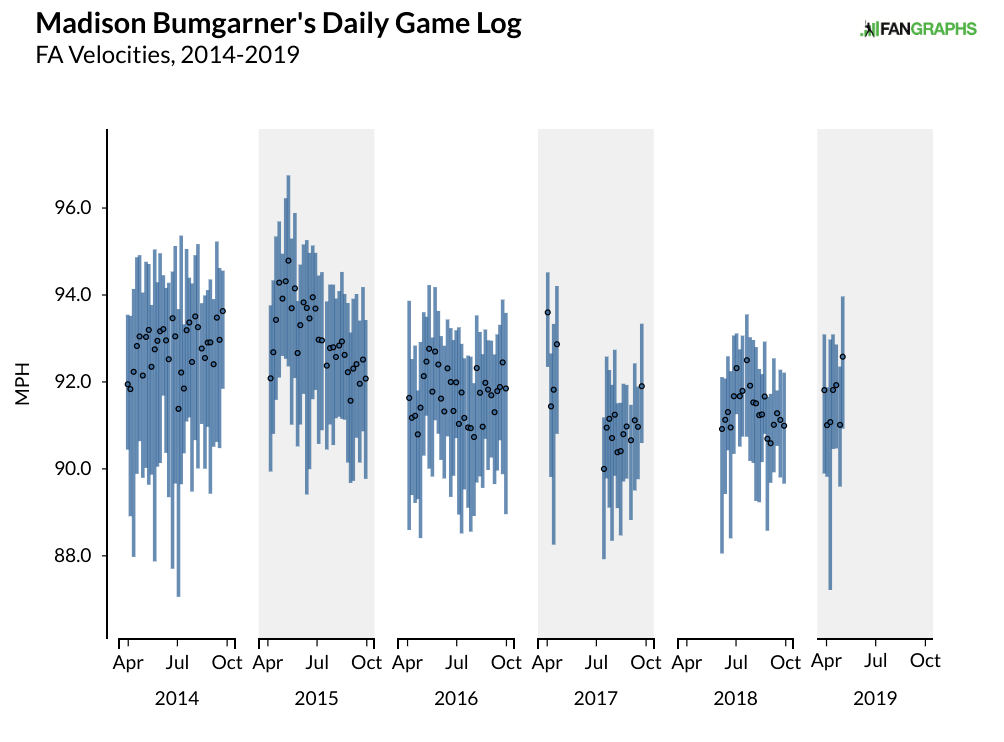
Other than a few starts in early 2017 before he was hurt, Bumgarner hasn’t thrown the ball with as much velocity as he did the other night on a regular basis since the 2015 season. And it wasn’t just the last start that Bumgarner has pitched well. While the velocity against the Dodgers was new, in his last four starts, Bumgarner has struck out 27 batters against just three walks in 24.2 innings for a 1.84 FIP. That four-game FIP is the best Bumgarner has put together since the 2015 season and nearly a full run lower than any stretch last year.
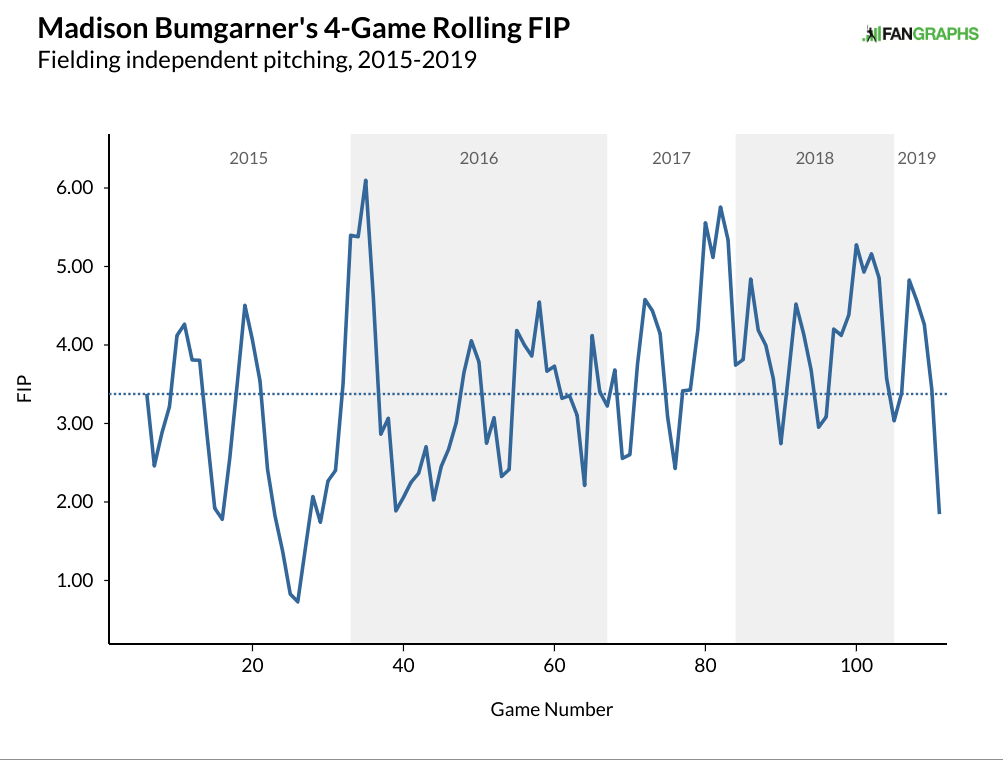
Bumgarner is pitching better than the last few seasons, but to get some idea about how much better, let’s take a baseline and compare Bumgarner over three different periods, plus the last four starts as a bonus. First, let’s look at some numbers most readers at FanGraphs should be familiar with. Read the rest of this entry »
How Sinclair’s Purchase of Baseball Sports Networks Will Affect You
Near the end of 2017, reports surfaced of a massive deal that would see Disney buy more than $50 billion in FOX assets, including 22 regional sports networks that broadcast the games of about half of the 30 major league baseball franchises. After a bidding war between Comcast and Disney saw the latter win out, moves needed to be made to satisfy antitrust concerns. Given Disney’s already powerful place in the market with its ESPN family of channels, one of those moves included the sale of those regional sports networks. The first domino fell in March when the Yankees agreed to buy back the YES Network at a total valuation of around $3.5 billion dollars. Now, the remaining dominoes appear to have fallen, with the Wall Street Journal first reporting that Sinclair Broadcasting Group has agreed to buy the remaining 21 networks, valued at $10.6 billion.
The networks included in the deal are as follows:
| Team | Network |
|---|---|
| Angels | Fox Sports West |
| Braves | Fox Sports South/Southeast |
| Brewers | Fox Sports Wisconsin |
| Cardinals | Fox Sports Midwest |
| Diamondbacks | Fox Sports Arizona |
| Indians | Fox SportsTime Ohio |
| Marlins | Fox Sports Florida |
| Padres | Fox Sports San Diego |
| Rangers | Fox Sports Southwest |
| Rays | Fox Sports Sun |
| Reds | Fox Sports Ohio |
| Royals | Fox Sports Kansas City |
| Tigers | Fox Sports Detroit |
| Twins | Fox Sports North |
The Best Hitter You’ve Never Heard Of
A year ago, Hunter Dozier got his first real taste of the big leagues and it did not go well. In nearly 400 plate appearances, Dozier struck out a lot, walked very little, and did not run the bases well or add anything of value defensively. His calling card to the majors, and the tool that got him drafted in the top-10 in 2013, is his power, and he was merely average there. Dozier was below replacement-level a year ago, and at 27 years old heading into 2019, he looked like a replacement-level player with some upside as the weak side of a platoon. Instead, he’s been one of the best players in baseball for the first month of the season.
With seven homers, nearly as many walks as strikeouts, and a .364 BABIP, Dozier is riding a .337/.441/.663 slash line good for an American League-leading 189 wRC+. His 1.7 WAR is fifth in all of baseball behind only Cody Bellinger, Christian Yelich, Paul DeJong, and Mike Trout. This isn’t going to last. It can’t possibly last, but it is worth exploring how Dozier got here and the level he might settle in to once the magic wears off. Over at Royals Review on Tuesday, Shaun Newkirk discussed Dozier’s start and listed some reasons why he’s bound to slow down:
-
His BABIP is .371, far more north than his near league average BABIP of .296 last year. While good quality of contact can lead to better balls in play, .371 is probably a bit rich.
-
He isn’t a 194 wRC+ hitter. No one expects that number to continue as he’s not prime Miguel Cabrera, Mike Trout, or Barry Bonds.
-
The projection systems don’t necessarily buy it yet. They project him going forward (this includes what he has done in 2019 by the way) for a 93-97 wRC+.
-
He’s running a 20%+ HR/FB%, where the league average is more like 12-13%.
-
He’s at almost double the league average infield hit%, which isn’t a big part of his game to be fair.
-
He’s also yet to hit any any infield fly balls, whereas a typical batter hits ~10% of his batted balls on the infield
April Attendance Was a Mixed Bag for Baseball
A year ago, warning bells rang out across the league as attendance dropped precipitously in April, down nearly 3,000 fans per game from the previous season and about 2,500 fans per game from the April average from 2014 through 2017. The rough April came on the heels of a 2017 season that finished rather meagerly as well. From 2014 through 2016, total average attendance at the end of the season gained over 1,300 fans on average compared to the April numbers. But in 2017, the league added fewer than 500 fans per game in the summer months, ruining a once-promising season at the gate. A lackluster summer followed by a disappointing April was worrisome, though the weather might have been a factor. As it turned out, the summer made up a lot of the ground lost in April, but attendance still fell by 1,237 fans per game. This April has been met by slightly better weather, but attendance has not improved, and without a great summer, we might see a pretty big loss at the end of the season.
Before comparing previous seasons, here’s home attendance per game by team so far this season.
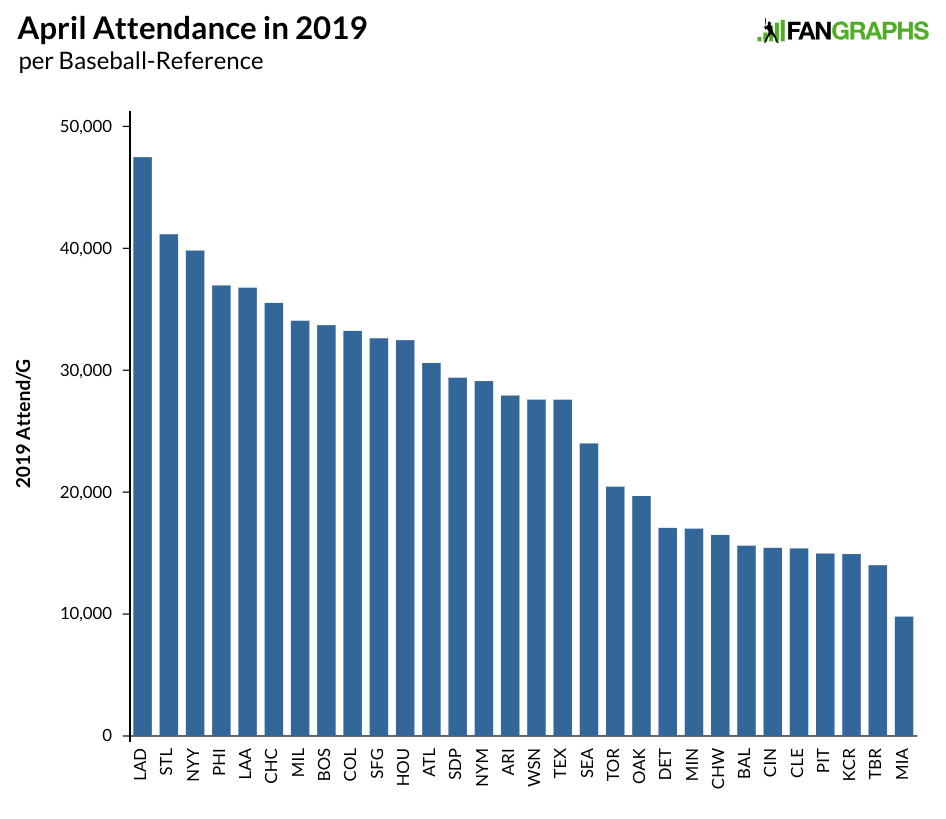
We see mostly what we would expect near the top, with the Dodgers, Cardinals, and Yankees checking in with the best attendance. The Dodgers and Cardinals have claimed the top two spots at the end of the season in each of the previous six seasons except for last year when the Yankees overtook the Cardinals for second-place. Philadelphia is benefiting from a decent record a season ago and a big offseason this winter, while the Cubs and Red Sox are still doing well, though they are limited by the size of their parks when it comes to attendance. They more than make up for it with the highest prices in the game. Milwaukee is hardly seen as a large market, but Brewers fans have long done a good job supporting their team, particularly when the team is successful. The most surprising absence from the top of this list is the Giants, who averaged over 41,000 fans per game from 2011 through 2017 and still had a fairly robust 39,000 fans last season but have dropped off pretty significantly. The Giants are coming off a very good run, and it is possible their fans and stadium might insulate them a little during a rebuild, but they will have to figure out how much losing they can stomach; the Phillies had half as many fans attend games in 2015 compared to 2010, and the Giants could be facing even bigger drops the next few years.
This next graph shows the change in attendance from last April.
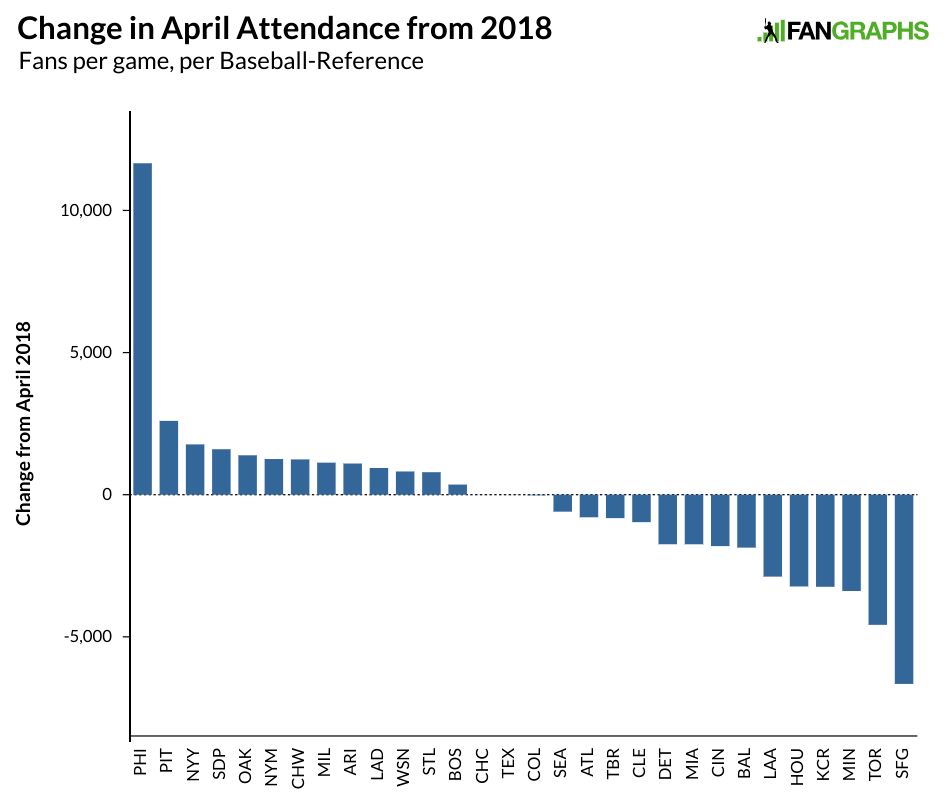
The Phillies created a fair bit of excitement in the offseason with trades and free agency, including signing Bryce Harper, and that excitement has translated to the box office. Nearly 200,000 more fans watched the Phillies this April compared to a year ago. The increase is bigger than the total attendance for five teams this season. A year ago, the Pirates traded away Andrew McCutchen and Gerrit Cole and saw a pretty significant attendance drop. Contending in July saw a decent increase as the season wore on and that has carried over to this season. The Yankees have seen more growth as they return to perennial contender status. Oakland and Milwaukee are seeing some gains after solid 2018 campaigns, while the Padres and Mets are seeing an uptick after making some big offseason moves.
At the other end of the graph, Houston is seeing a dip, but they were coming off a World Series win in 2017 that likely goosed attendance last year. Cincinnati not seeing more fans is a bit disappointing given their moves in the offseason. The Angels really need to start winning, though their overall attendance numbers are pretty good. Baltimore and Kansas City are seeing drops commensurate with their rebuilding status. The Twins were supposed to be good last season, but disappointed. They are off to a good start and it wouldn’t be a surprise if they end up with more fans than they did a year ago. The Blue Jays drew extremely well when they were in contention, but do much worse when they aren’t in the running. The team did see about 18,000 more fans during Vladimir Guerrero, Jr.’s debut weekend series compared to how they did for a weekend series against the Rays two weeks prior.
While the factors for attendance are numerous, it is possible that teams’ plans for rebuilding are creating more big drops than in season’s past. From 2013 through 2017, there were a total of six attendance decreases exceeding 5,000 fans per game over the previous season; there were six of those drops in 2018 alone, and we might be looking at two more this year. As for how much April numbers presage those at the end of the season, here’s how last year’s April attendance looks when compared to the end of the season.
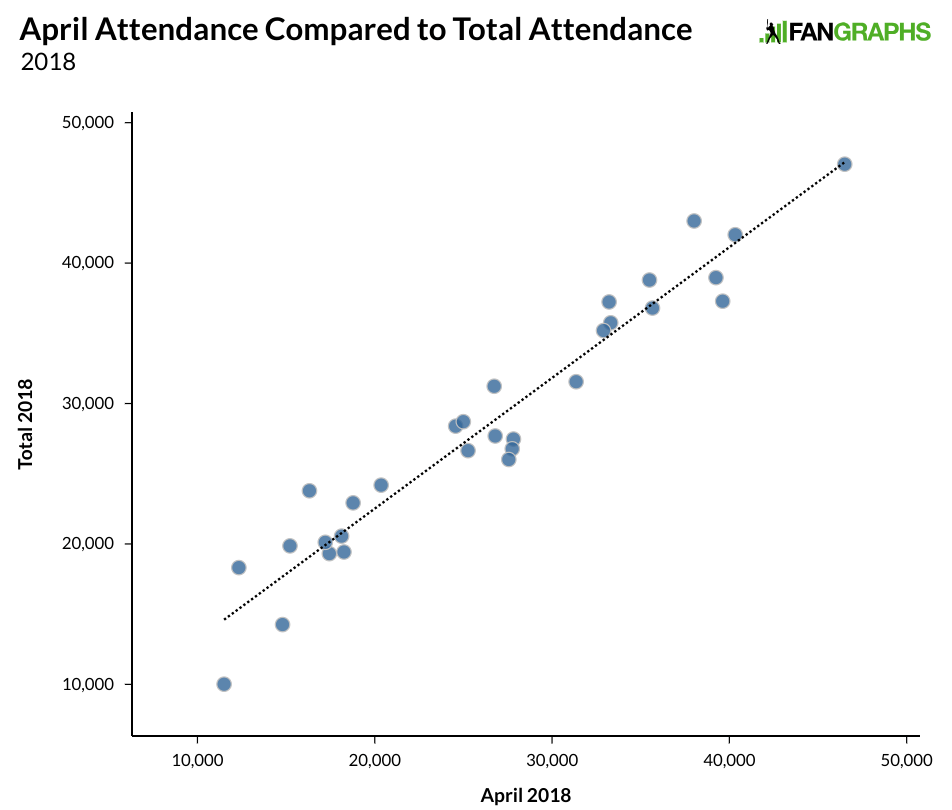
There are some minor outliers, but April numbers tend to do a pretty good job lining up with the rest of the year if you include a small increase from the April numbers. Last season’s poor April attendance numbers were bailed out a little by good numbers the rest of the way, but that is a bit of an outlier compared to the last few seasons, as the table below shows.
| April Per Game | End of Season Per Game | Change | |
|---|---|---|---|
| 2014 | 28,900 | 30,346 | 1,446 |
| 2015 | 29,287 | 30,366 | 1,079 |
| 2016 | 28,,671 | 30,132 | 1,461 |
| 2017 | 29,430 | 29,909 | 479 |
| 2018 | 26,617 | 28,660 | 2,043 |
| 2019 | 26,361 | — | — |
If we only see an increase of 1,000 fans per game at the end of the season compared to April, baseball is going to lose more than three million fans in attendance. It’s possible slow winters have dulled early-season excitement for some fans, though some of the most active teams have seen pretty big rises this April. Some teams’ fans might be taking a wait-and-see attitude while others are simply staying away. Another factor in baseball’s overall attendance lag could be the lack of new stadiums, which tend to send attendance upward for a few years. The graph below shows attendance per game, and the number of new stadiums over the past 30 years. As new stadiums have stagnated, so has attendance.
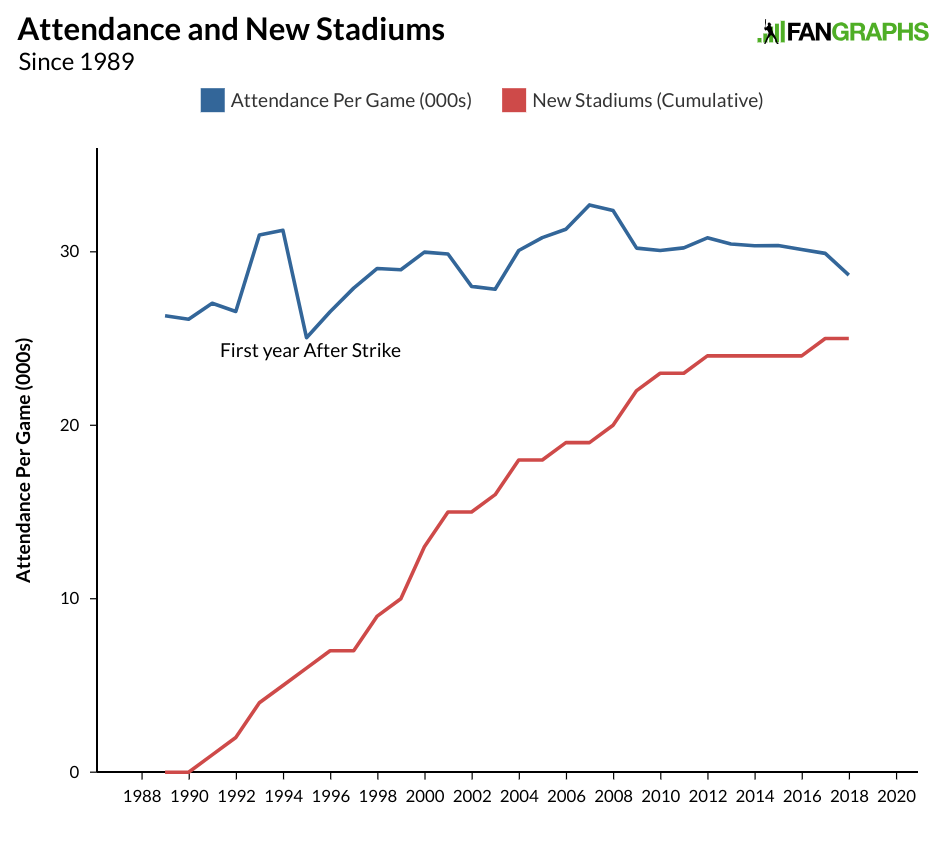
Attendance is still well above where it was in the 1980s, and it grew by 20% in the 15 years following the strike as a new stadium was built basically every year. But those gains have stopped, and are showing some signs of decline that very well could continue this season. Whatever teams are doing, whether it is the slow winters or the lack of expected competitiveness or the price of tickets, it isn’t attracting more fans at the ballpark. The teams that are doing well this season compared to last had active winters or just won a bunch of games. The sport needs to do whatever it can to cultivate new fans and to get them out to the ballpark because without them, the television money that has made baseball less dependent on attendance will eventually dry up as well. Generating excitement about a team, through wins and activity in the offseason, is the best way to get more people to buy tickets.
How Hitters Are Fighting Back Against Rising Strikeouts
Over the last decade, hitters have been fighting a losing battle against incredibly talented pitchers who throw at higher velocities with even more effective offspeed and breaking pitches. Faced with the increase in talent and velocity on the pitching side, position players have done their best to adapt. The emphasis on launch angle, so as to hit balls harder and farther to get an extra base hit, is a fight against hitters’ inability to take the ball the other way or string together rallies, which are increasingly blunted by the strikeouts. Hitting an 89 mph fastball on the outer edge of the plate to the opposite field is a strategy that might work well. Unfortunately, those 89 mph fastballs aren’t as prevalent as 89 mph sliders that dart away from the outside corner and the fastballs that are routinely in the mid-90s. Hitters are continuously adapting to changes in pitching in order to be successful, and this season, they are getting better by not swinging.
Hitters tend to get some blame for their role in there being fewer balls in play, what with the proliferation of strikeouts and homers and three true outcome players who seek walks and power and have a willingness to swing and miss, but much of what hitters do is simply react to what pitchers do. The increase in strikeouts over the years isn’t due to hitters actively choosing to strike out, but to pitchers who have gotten much better at striking hitters out. When I looked at the issue last season, the rise in strikeouts was due to primarily two factors: the increase in the number of pitches at 95 mph or greater, and the increase in the use of non-fastballs to get hitters out. It’s hard to catch up to velocity, and it’s really hard to lay off breaking and offspeed pitches. This season, pitchers are still throwing hard, and as Ben Clemens demonstrated, they are throwing even fewer fastballs.
To go along with the increased use of non-fastballs is an accompanying decrease in pitches in the strike zone. The graph below shows the number of fastballs and non-fastballs in the strike zone over the past few years. Read the rest of this entry »
Paul DeJong Counters Strikeouts with Aggression
So here’s a thing you might see if you looked at our FanGraphs Leaderboards this morning.
| Name | PA | AVG | OBP | SLG | WAR |
|---|---|---|---|---|---|
| Cody Bellinger | 108 | .424 | .500 | .891 | 2.5 |
| Christian Yelich | 112 | .326 | .438 | .793 | 2.0 |
| Mike Trout | 96 | .303 | .510 | .636 | 1.9 |
| Paul DeJong | 108 | .343 | .398 | .626 | 1.7 |
| Matt Chapman | 108 | .311 | .407 | .633 | 1.5 |
| Jorge Polanco | 92 | .366 | .424 | .695 | 1.4 |
| Anthony Rendon | 82 | .371 | .451 | .771 | 1.4 |
| Hunter Dozier | 86 | .324 | .430 | .676 | 1.3 |
| Javier Baez | 98 | .312 | .347 | .656 | 1.3 |
That Mike Trout isn’t yet leading baseball is a surprise, and an indication that we still need some time before we start touting potential MVP candidates. Cody Bellinger is having a big year, but he put up a 138 wRC+ and four-win season when he was 21 years old. Christian Yelich was sixth in WAR last season and won MVP. Matt Chapman was seventh in WAR a year ago, Anthony Rendon was ninth, and Javier Baez was 14th. Jorge Polanco and Hunter Dozier are certainly shockers, but they are lower on this list than Paul DeJong, so it’s the Cardinals shortstop who is getting a post as he heads toward what could be his breakout season at 25 years old.
When we do an initial look at DeJong’s numbers, his .387 BABIP jumps out as unsustainable. DeJong isn’t going to put up a .343 batting average all season long. He’s not going to put up a 169 wRC+ all season long, either. He doesn’t need to in order to be one of the better players in the league, though. Since the start of last season, DeJong is just shy of 600 plate appearances and put up five wins, one of the top-30 marks in baseball despite being several hundred plate appearances behind much of the league due to a fractured left hand that cost him two months last year. DeJong’s .283 ISO does look a bit higher than we might reasonably expect, but with a .219 career ISO entering the season, it’s not like he has been without power. Even if DeJong were to drop 50 points a piece in BABIP and ISO, we’d still be looking at a player whose bat is about 30% above league average to go along with an above-average glove at shortstop. That would be roughly a six-win player, which seems rather unexpected for Paul DeJong. Read the rest of this entry »
