Craig Edwards FanGraphs Chat – 9/3/2020

September 3, 2020
An unusual season deserves an unusual trade deadline, and that’s what we got yesterday. With one-third of the league all but assured of a playoff spot, teams at the top were reticent to push in their chips for this season. There were a fair number of teams in the middle willing to take a chance on 2020, in contrast to the last few seasons. At the bottom, there were very few teams without a chance to win this season due to the expanded playoff format, which meant there wasn’t a whole lot to choose from for teams looking to get better this year. And while we won’t know the end result of these deals for at least a month (and, in the case of some of the players exchanged, perhaps for years), it doesn’t mean we can’t evaluate teams’ moves based on the information we have today.
With that, let’s get to it.
While some teams were looking to maximize value beyond the 2020 season, Toronto saw this year’s extra playoff spots as an opportunity and struck, without sending a ton of talent away. The team added two potential starters in Taijuan Walker and Robbie Ray, as well as a starter/swingman type in Ross Stripling. They traded for a nice utility player/stopgap starter in Jonathan Villar. They added to their tower of beef in the lineup with Daniel Vogelbach. Toronto was likely to make the playoffs without adding much, given their 76% playoff odds as we head into September. But with Matt Shoemaker and Nate Pearson sidelined, the club’s depth in the rotation was thinning. Ray and Stripling have struggled this season and Walker hardly provides guaranteed production, but they don’t all have to work out to prove useful to the Blue Jays. The starters added could end up providing strength out of the bullpen or help allow others, like Pearson, to come back in a reliever role and fortify the late-innings. While a playoff berth isn’t a lock, Toronto did what was necessary to shore up a flawed roster in the hopes of playing in October without sacrificing much of the future. Read the rest of this entry »
When the season is just 60 games long, it can be hard to wrap your head around seemingly simple concepts like whether or not a team has a decent shot of making the playoffs. In a normal season, we’ve had four months to assess teams by the time we get to the trade deadline, and get two months after that to see them potentially reap the benefits of the moves they make. Halfway through this season, however, there hasn’t been much time for separation, and instead of having two months left to go, there’s just a single, month-long sprint to the finish. Add in the expanded playoffs, and there’s even more confusion regarding what constitutes a good shot at the playoffs. To attempt to provide some clarity, I’ll go through every team’s playoff odds in tiers and compare them to other teams in similar positions over the last half-dozen seasons.
First, here are the playoff odds for every team through Thursday with roughly a month to go in the season:
| AL East | W | L | Make Playoffs |
|---|---|---|---|
| Yankees | 16 | 11 | 98.20% |
| Rays | 21 | 11 | 99.70% |
| Blue Jays | 15 | 14 | 66.10% |
| Red Sox | 10 | 21 | 4.30% |
| Orioles | 14 | 16 | 10.20% |
| AL Central | W | L | Make Playoffs |
| Twins | 20 | 12 | 99.20% |
| White Sox | 19 | 12 | 98.40% |
| Indians | 19 | 12 | 98.60% |
| Royals | 12 | 19 | 6.20% |
| Tigers | 13 | 16 | 11.00% |
| AL West | W | L | Make Playoffs |
| Astros | 17 | 14 | 97.30% |
| Athletics | 22 | 10 | 99.90% |
| Angels | 10 | 22 | 4.40% |
| Rangers | 11 | 19 | 3.90% |
| Mariners | 13 | 20 | 2.60% |
| NL East | W | L | Make Playoffs |
| Braves | 18 | 12 | 96.50% |
| Mets | 13 | 16 | 61.40% |
| Phillies | 12 | 14 | 56.20% |
| Nationals | 11 | 17 | 18.70% |
| Marlins | 14 | 12 | 32.70% |
| NL Central | W | L | Make Playoffs |
| Cubs | 18 | 12 | 94.80% |
| Reds | 13 | 17 | 46.60% |
| Brewers | 13 | 17 | 48.20% |
| Cardinals | 11 | 11 | 63.50% |
| Pirates | 9 | 19 | 0.60% |
| NL West | W | L | Make Playoffs |
| Dodgers | 24 | 9 | 100.00% |
| Padres | 19 | 14 | 93.90% |
| Rockies | 16 | 15 | 42.60% |
| Giants | 15 | 18 | 30.40% |
| Diamondbacks | 13 | 19 | 13.80% |
And in graph form:

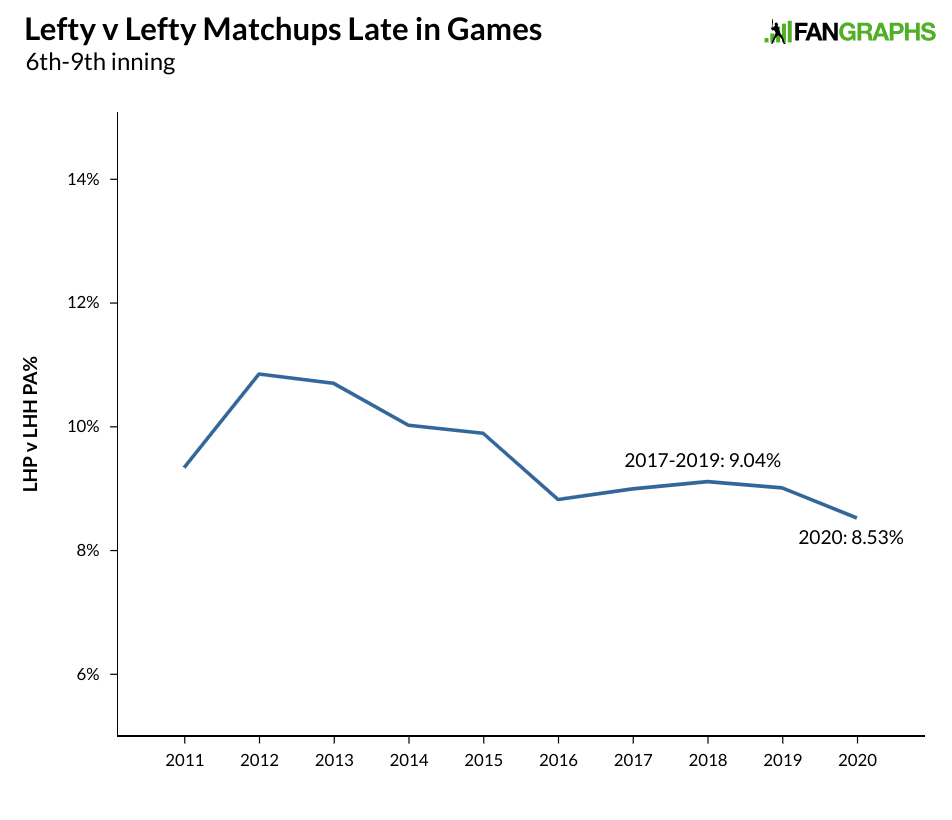
As part of Major League Baseball’s ongoing efforts to improve the pace of game play, this year the league introduced the three-batter minimum rule, which requires that barring injury, any reliever coming into the game either needs to pitch to three batters or finish an inning. The rule was designed to prevent late-game pitching changes and the break in the action those changes entail. Whether the rule was likely to have any great impact was debatable given the lack of changes to begin with. The unusual season might not provide us with too much information with which to evaluate how the rule is impacting pace of play, but reliever appearances per team per game are up from 3.4 a year ago to 3.6, and the length of relief appearances is virtually unchanged at a little over an inning per appearance. While we might not be able to judge pace of play this season, we can see the impact of the rule on late-game strategy.
The rule was seen as the death-knell of the LOOGY, preventing specialists from coming in to face just a single batter. One-batter appearances are occurring about half as often, so there’s certainly an impact there, but how that has changed the platoon advantage is a different matter. To start, let’s just look at the sixth through the ninth innings and how often we are seeing that lefty vs. lefty matchup. The graph below shows the percentage of lefty on lefty matchups late in games compared to total plate appearances:
Through Monday night, major league baseball teams have played 415 games, the same number of games they had played on April 28 of last year. Back then, Cody Bellinger, Christian Yelich and Mike Trout were the top three players by WAR. Also in the top 10 were Matt Chapman, Marcus Semien, Pete Alonso, Anthony Rendon, Javier Báez, and Paul DeJong, who all went on to have good-to-great seasons. Elvis Andrus, on the other hand, put up 1.5 WAR through most of April and was replacement-level the rest of the way. Moving one month forward, a stretch equivalent to half of this season, Pete Alonso was replacement-level in May. Marcus Semien put up an 80 wRC+. All of which serves as a good reminder that in this shortened season, it’s best not to make too much of one month’s worth of performance when looking forward. That said, though, let’s take a look at the current WAR Leaderboard for position players:
| Name | Team | PA | OBP | SLG | wRC+ | WAR |
|---|---|---|---|---|---|---|
| Mike Yastrzemski | Giants | 133 | .429 | .645 | 184 | 2.2 |
| Fernando Tatis Jr. | Padres | 134 | .396 | .678 | 183 | 2.1 |
| Mookie Betts | Dodgers | 122 | .369 | .664 | 174 | 1.8 |
| Anthony Rendon | Angels | 117 | .453 | .558 | 179 | 1.8 |
| Brandon Lowe | Rays | 118 | .398 | .676 | 190 | 1.8 |
| Kyle Lewis | Mariners | 125 | .456 | .585 | 190 | 1.7 |
| Nelson Cruz | Twins | 119 | .429 | .699 | 198 | 1.7 |
| Trent Grisham | Padres | 131 | .369 | .514 | 140 | 1.4 |
| Bryce Harper | Phillies | 96 | .453 | .667 | 191 | 1.4 |
| Ian Happ | Cubs | 108 | .411 | .575 | 161 | 1.4 |
Over the last month, Ben Clemens has written about Mike Yastrzemski, Mookie Betts, and Ian Happ; Jay Jaffe has added his own piece on Betts. Fernando Tatis Jr. has been featured in posts from Jaffe and Dan Szymborski, and ranked very highly in our Trade Value Series. Jake Mailhot has written up Kyle Lewis and Trent Grisham. While Anthony Rendon, Nelson Cruz, and Bryce Harper have all been great and perhaps deserve articles of their own, their greatness isn’t too far removed from our general expectations for them. That just leaves Brandon Lowe, whose start definitely merits attention. Read the rest of this entry »
With two outs in the bottom of the ninth inning of last night’s game between the Braves and Phillies, the visiting Phillies were holding on to a two-run lead. Dansby Swanson stood on first base with Adeiny Hechavarría on second. Freddie Freeman was facing off against new Phillies acquisition Brandon Workman. In terms of compelling endings, this is pretty close to what you hope for. One of the better hitters in the game had a chance to hit a walk-off home run to end the game, while making an out would mean victory for the other side. Freeman did get a hit, pushing a double into the gap, but the game ended when Swanson was thrown out at home trying to score the tying run. The play, already compelling given the game state, was made more interesting by two factors:
Before getting to the collision rule and whether Knapp was where he shouldn’t have been, let’s first consider Swanson’s decision to attempt to score from first base. While Freeman hit the ball pretty far, it was cut off by Roman Quinn. One of the fastest runners in the game, Quinn got to the ball in the gap before left fielder Andrew McCutchen. While McCutchen’s arm strength isn’t terrible, it isn’t much more than average, while Quinn has thrown an easy 87 mph pitch from the mound, and made this throw earlier this month:
While a shortened season might make this year’s version of our Trade Value Series an unusual one, with the deadline looming, we are not about to break with tradition. For a more detailed introduction to this year’s exercise, as well as a look at those players who fell just short of the top 50, be sure to read the Introduction and Honorable Mentions piece, which can be found in the widget above along with the other installments in the Series.
For those who have been reading the Trade Value Series the last few seasons, the format should look familiar. For every player, you’ll see a table with the player’s projected five-year WAR from 2021-2025, courtesy of Dan Szymborski’s ZiPS projections. The table will also include the player’s guaranteed money, if any, the year through which the team has contractual control of the player, last year’s rank, and then projections, contract status, and age for each individual season through 2025, if the player is under contract or team control for those seasons. Last year’s rank includes a link to the relevant 2019 post. Thanks are due to Sean Dolinar for creating the tables in these posts. At the bottom of the page, there will be an updated grid showing all the players who have been ranked up to this point.
With that out of the way, let’s finish the rankings.
| Five-Year WAR | +20.0 |
| Guaranteed Dollars | – |
| Team Control Through | 2024 |
| Previous Rank | #21 |
| Year | Age | Projected WAR | Contract Status |
|---|---|---|---|
| 2021 | 26 | +4.3 | Pre-Arb |
| 2022 | 27 | +4.4 | Arb1 |
| 2023 | 28 | +3.9 | Arb2 |
| 2024 | 29 | +3.8 | Arb3 |
Since the beginning of last season, no pitcher has thrown more innings than Shane Bieber’s 249. Only four pitchers have a higher WAR than his 7.0 over than span: Gerrit Cole, Lance Lynn, Max Scherzer, and Jacob deGrom. Cole just landed a monster contract. Lynn and Scherzer are in their 30s and will be free agents at the end of next season; deGrom is also in his 30s and makes more than $30 million a year. Bieber is 25 years old, will make the league minimum next season, and won’t be a free agent until after 2024.
Bieber’s performance and projections put him in a higher tier than Walker Buehler (18th in these rankings), who has a similar number of years of control remaining, but at a higher cost due to Buehler’s status as a Super Two. Bieber’s projections are just a bit lower than Jack Flaherty’s (19th), with the Cleveland right-hander boasting slightly better performance since the start of last year; he separates himself from Flaherty with an extra year of team control at virtually no cost. Unless Bieber wins a Cy Young award, he seems likely to make between $15 million to $20 million total over the next three seasons, and only $30 million to $40 million through the end of the 2024 season, or roughly the yearly salaries of Cole, deGrom, and Scherzer. Pitchers are inherently risky and the threat of Tommy John surgery always looms, which is really all that pushed Bieber to the back of the top 10 instead of being closer to the middle. When you factor in his contract status, Bieber is the most valuable pitcher in baseball. Read the rest of this entry »
While a shortened season might make this year’s version of our Trade Value Series an unusual one, with the deadline looming, we are not about to break with tradition. For a more detailed introduction to this year’s exercise, as well as a look at those players who fell just short of the top 50, be sure to read the Introduction and Honorable Mentions piece, which can be found in the widget above.
For those who have been reading the Trade Value Series the last few seasons, the format should look familiar. For every player, you’ll see a table with the player’s projected five-year WAR from 2021-2025, courtesy of Dan Szymborski’s ZiPS projections. The table will also include the player’s guaranteed money, if any, the year through which the team has contractual control of the player, last year’s rank, and then projections, contract status, and age for each individual season through 2025, if the player is under contract or team control for those seasons. Last year’s rank includes a link to the relevant 2019 post. Thanks are due to Sean Dolinar for creating the tables in these posts. At the bottom of the page, there will be an updated grid showing all the players who have been ranked up to this point.
With that out of the way, let’s continue with the rankings.
| Five-Year WAR | +20.4 |
| Guaranteed Dollars | – |
| Team Control Through | 2024 |
| Previous Rank | #32 |
| Year | Age | Projected WAR | Contract Status |
|---|---|---|---|
| 2021 | 26 | +4.2 | Pre-Arb |
| 2022 | 27 | +4.2 | Arb1 |
| 2023 | 28 | +4.2 | Arb2 |
| 2024 | 29 | +4.1 | Arb3 |
Hit 53 homers as a rookie and you are going to move up the trade value rankings. There is some risk of an early decline with Pete Alonso’s old-man skillset. His strikeouts are already high, he’s not good in the field or on the bases, and if his power dips, his value will drop precipitously. That’s the bad. The good is that Alonso’s five-win rookie season wasn’t marked by a ton of batted ball luck. He earned those 53 homers, and his 143 wRC+ matched up with his Statcast figures.
The projections like Alonso as well. The table above shows Alonso’s five-year ZiPS for easy comparison with the rest of the players on this list, but his four-year ZiPS projection of 16.6 WAR ranks 19th among the players on this list. It’s hard to move Alonso much higher than this given the potential for decline, but the team control, the minimum salary through next season, and the power he’s already shown makes it difficult to slide him down past this slot. He will have higher arbitration salaries than most given his home run totals, but $40 million or so in salary for the next four years still provides excellent value. Read the rest of this entry »