I spend a lot of time saying the word “April.” It’s a convenient excuse to wave away any notion of changing my mind drastically on a player after two or three weeks of the season. But April isn’t actually meaningless, and as we head toward June, we’re already nearly a third of the way through the season. A lot of the stuff we’ve seen isn’t just a rough patch or a freak BABIP, but career trajectories changing, and that has consequences for the players and their teams. One of the most common questions about players I get in chats is some variation of “What does ZiPS think now?” I can’t answer them all, mainly because “doughy middle-aged nerd talks to his magical baseball box for an hour” sounds like the worst episode of Black Mirror ever. That said, because I do full in-season runs of ZiPS in the middle of every month, now seems like a good time to get some projectionist changes of heart for the overachieving and underperforming players.
So whose changing fortunes are most likely to lead to changed destinies? Well, to get an idea of which trajectories have changed the most, I took the current 2026 projected numbers for each player and compared them to the 2026 ZiPS projections from before this season began. We’ll start with the good news, because I’m a Baltimore native and an Orioles fan, so I need something sunny first. These are park-neutral projections, and I eliminated anyone who is projected as below replacement level, since we’re focusing on major league-relevant players. Today, we’ll cover the position players before moving on to the pitchers tomorrow.
Here are the players whose 2026 ZiPS projections have improved the most since the beginning of this season, sorted by the greatest gains in projected WAR: Read the rest of this entry »
Dan Szymborski: Cowser, I think. You’re not rewarded for the best stuff Parker Meadows does!
12:02
.330/50: I looked it up on stat muse, and, weirdly, there are seven seasons where a player hit 50+ hr with a .349+ BA. And there are seven where a player hit 50+ with a .329+ BA. Barry in 01 was at .328 and one of Foxx’s two biggest years was .349. So… I know Zips doesn’t think AJ can keep THIS up, but given he’s been hitting like .370 for more than a year now, where would you rank the season all time if he “slumps” to finish the year at like a .335/.440/.712 with 50+ (again, measurably worse than he has been over the past year)? To me it would basically just be Barry and his special sauce since expansion ahead of it.
12:03
Dan Szymborski: I can’t give an exact ranking off-hand, but it’s an absolutely monster season, and I think it would cement his status as a Sandy Koufax-esque Hall of Famer if something bad happened.
12:03
Dan Szymborski: I would personally argue he’s already at that level, but I strongly suspect I’m much more willing to vote for a dizzying-peak/shortish career guy than most writers are
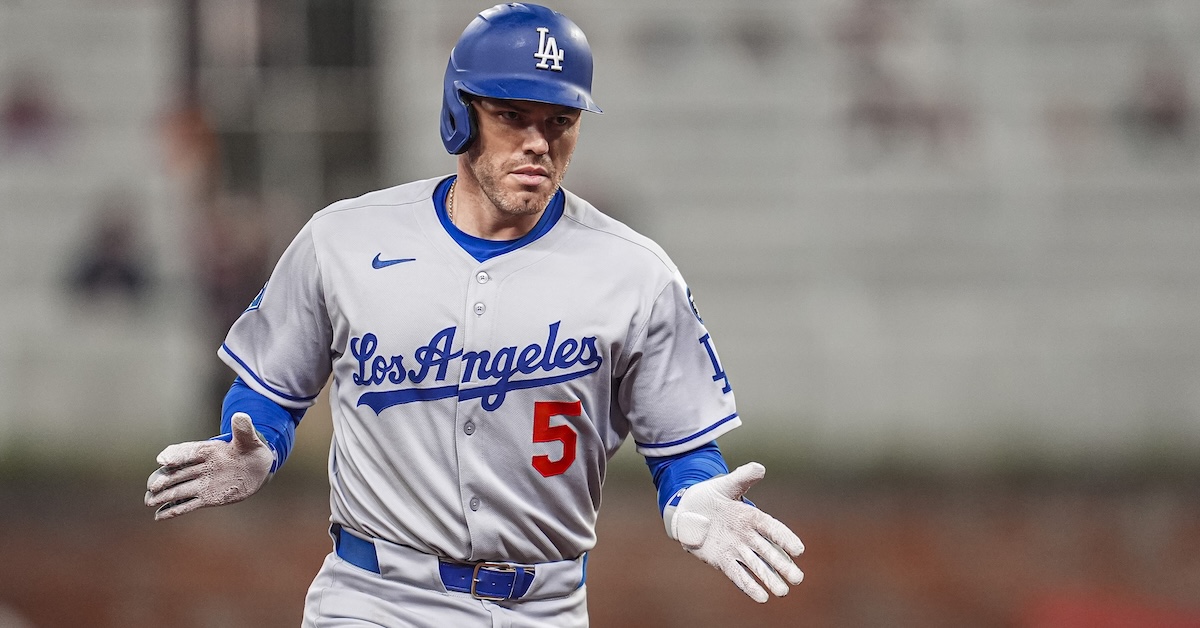
The world has changed in a lot of ways over the last dozen years, some good, and some… not. One thing that doesn’t change, however, is the status of Freddie Freeman at or near the top of the first base dogpile.
If at any point over the last decade you made a list of baseball’s top first basemen and didn’t include Freeman, you hopefully crumpled your list and started over again. Freeman will celebrate the 15th anniversary of his 2010 major league debut with the Braves later this year, and more than 2,000 hits and 350 homers later, he’s likely just rounding out the text on his bronze Hall of Fame plaque. Read the rest of this entry »
Spending your own money is fun, but spending someone else’s money is even better! When it comes to extending major league contracts, unless you’re a billionaire, or a millionaire with a lot of millionaire business partners, you pretty much have to live vicariously through those other parties. Keeping talent wearing your uniform, of course, has more utility than a simple splendiferous shopping spree, since the players you want to retain are unlikely to get less expensive when they hit free agency. The Toronto Blue Jays did their own impressive feat of cash-splashing last month, when they gave Vladimir Guerrero Jr. half a billion bucks or about $700 million puckaroos, maplebacks, or whatever it is that Canadians call their money. Yes, comments section, I’m aware they’re dollars.
For this year’s edition, I’ve chosen seven players to sign to long-term deals with their current clubs, and in all seven cases, I believe an extension would be mutually beneficial for both the player and his respective team. I’ve included the up-to-date ZiPS projections for each player, as well as the contract that ZiPS thinks each player should get, though that doesn’t necessarily mean that I think the player will end up with that figure or even sign an extension.
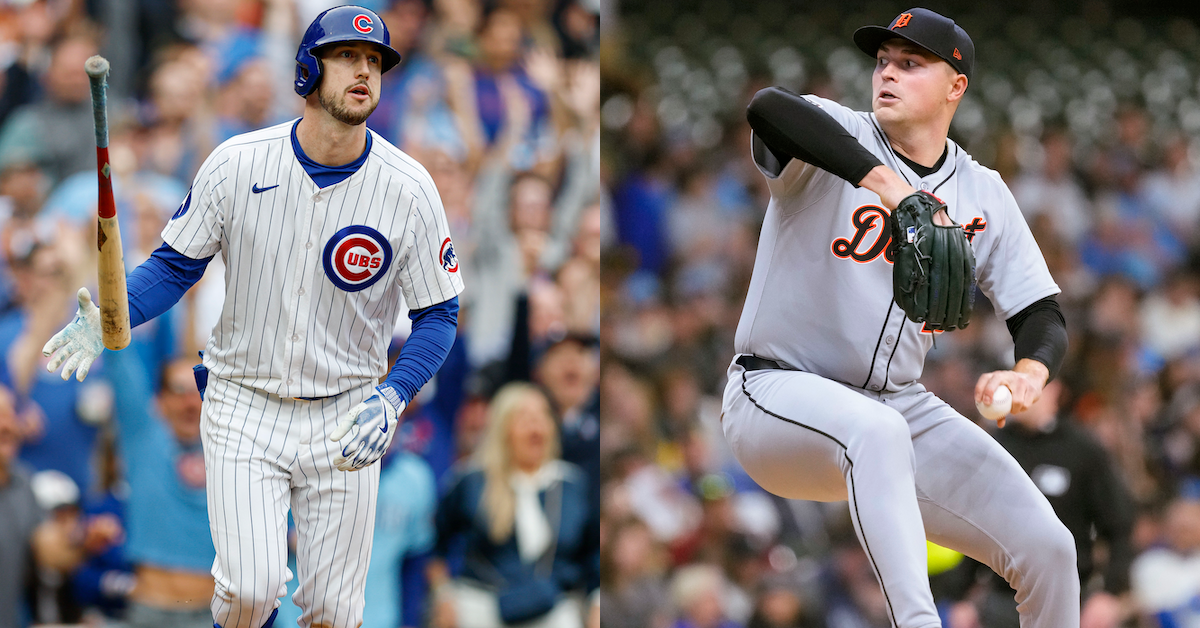
Tarik Skubal, Detroit Tigers – Seven years, $240 million
ZiPS Projection – Tarik Skubal
Year
W
L
ERA
G
GS
IP
H
ER
HR
BB
SO
ERA+
WAR
2026
13
7
2.79
29
29
174.0
141
54
14
33
193
149
4.7
2027
13
7
2.88
29
29
172.0
144
55
15
33
186
144
4.5
2028
12
7
2.99
28
28
165.3
143
55
15
31
174
139
4.1
2029
11
7
3.12
28
28
158.7
140
55
15
30
161
133
3.7
2030
10
8
3.26
28
28
154.7
141
56
16
29
153
127
3.4
2031
10
7
3.50
27
27
149.3
142
58
16
29
143
119
2.9
2032
9
8
3.56
26
26
144.0
139
57
16
29
135
117
2.7
After his unanimous selection as the AL Cy Young winner last season, Tarik Skubal isn’t doing anything in 2025 that would make him less expensive on a long-term deal. When I ran ZiPS late last summer, Skubal just barely beat out Logan Webb for the most rest-of-career projected WAR among active starting pitchers, and he has maintained a very slight edge since. The AL Central is just ripe for some team to dominate the rest, and even if the Tigers don’t spend like they did during the Mike Ilitch years, they don’t need to dish out $300 million a year to be the big dog in this division. Skubal gives Detroit a weapon that no other AL Central team can match, and at this point, he’s probably no more of an injury risk than is any other pitcher. Outside of Javier Báez, the Tigers have very little guaranteed money on the books (Colt Keith’s deal wouldn’t even hamstring the Pirates or A’s), and if they’re looking going to spend to keep one player on the team long term, who else could it be?
Wyatt Langford, Texas Rangers – Nine years, $239 million
ZiPS Projection – Wyatt Langford
Year
BA
OBP
SLG
AB
R
H
2B
3B
HR
RBI
BB
SO
SB
OPS+
WAR
2026
.272
.349
.488
522
84
142
28
5
25
89
57
112
19
134
4.1
2027
.270
.348
.488
541
89
146
29
4
27
93
60
113
19
133
4.2
2028
.269
.349
.489
555
92
149
30
4
28
96
64
112
18
134
4.3
2029
.270
.352
.490
560
93
151
31
4
28
97
66
111
17
135
4.4
2030
.268
.351
.485
557
92
149
31
3
28
96
67
109
15
134
4.3
2031
.266
.351
.479
549
91
146
30
3
27
93
67
107
14
132
4.1
2032
.265
.350
.477
535
87
142
29
3
26
90
65
105
13
131
3.9
2033
.265
.350
.477
516
84
137
28
3
25
86
62
102
11
131
3.7
2034
.265
.350
.471
516
82
137
28
3
24
85
62
103
10
130
3.5
ZiPS was famously in love with Wyatt Langford coming into 2024, projecting him for 2.6 WAR just a few months after he was drafted out of Florida. The projection looked cringe early on as Langford struggled, but after returning from the hamstring injury that cost him most of May, he went on a tear, hitting .261/.334/.452 for a 122 wRC+ and 3.0 WAR the rest of the way. He finished the year off with a flourish, hitting eight homers and putting up nearly a 1.000 OPS in September. Langford has a 145 wRC+ this season and is already at the 1.0-WAR mark, and with nearly two years until he hits even salary arbitration, this is the best time for he and the Rangers to come to a deal that buys out some of his free agent years. He is projected to be the Rangers’ most valuable player in the long term, and they have demonstrated a willingness to spend top dollar on their best guys.
Kyle Tucker, Chicago Cubs – Eight years, $203 million
ZiPS Projection – Kyle Tucker
Year
BA
OBP
SLG
AB
R
H
2B
3B
HR
RBI
BB
SO
SB
OPS+
WAR
2026
.260
.354
.474
546
89
142
27
3
28
92
79
92
22
128
4.4
2027
.260
.353
.471
535
86
139
26
3
27
88
77
90
20
127
4.2
2028
.252
.346
.447
519
80
131
25
2
24
82
74
88
17
119
3.4
2029
.249
.343
.436
497
76
124
23
2
22
75
71
85
15
116
3.0
2030
.245
.339
.423
468
68
115
22
2
19
67
66
82
12
111
2.4
2031
.240
.333
.401
434
61
104
20
1
16
59
60
78
10
104
1.7
2032
.238
.331
.397
391
54
93
18
1
14
52
54
71
8
102
1.4
2033
.235
.327
.389
345
46
81
15
1
12
44
47
63
6
99
1.0
ZiPS was notoriously grumpy about Kyle Tucker back in March, but it’s coming around on him fast, and the gap between ZiPS and Steamer from the preseason has narrowed by two-thirds. No, the Cubs aren’t going to be able to sign him for $203 million; if he were willing to sign for that amount of money, I suspect the congratulatory press conference announcing his signing would have been months ago. But there is a dollar amount that will do the trick, and while that figure almost certainly won’t be as high as what Guerrero Jr. signed for, the fact that so few impact bats will hit free agency over the next few years gives Tucker a great deal of leverage. Now that Guerrero’s off the market, ZiPS projects Tucker to have the best 2026-2028 wRC+ of any player who is set to enter free agency after either this season or next. The second-best outfielder is Cubs teammate Seiya Suzuki, who has a 10-point shortfall compared to Tucker, not to mention that Suzuki is a much worse defender.
MacKenzie Gore, Washington Nationals – Six years, $123 million
ZiPS Projection – MacKenzie Gore
Year
W
L
ERA
G
GS
IP
H
ER
HR
BB
SO
ERA+
WAR
2026
11
9
3.70
30
30
165.3
147
68
19
56
193
110
3.1
2027
10
10
3.77
29
29
160.0
146
67
19
52
184
108
2.9
2028
10
9
3.82
28
28
157.7
146
67
19
50
176
107
2.7
2029
9
10
3.90
28
28
152.3
144
66
19
48
165
104
2.5
2030
9
10
4.01
28
28
150.3
145
67
19
48
158
102
2.2
2031
8
9
4.16
26
26
138.3
137
64
18
44
141
98
1.9
The Nationals aren’t contenders yet, but when you look at their offensive core, you see the fuzzy edges of a lineup that will get Washington back to playing October baseball. While the rotation has actually been surprisingly solid so far this season, pitchers like Jake Irvin and Mitchell Parker are overperforming their peripheral numbers, and we can’t bank on either of them to be a true ace. MacKenzie Gore, on the other hand, has peripherals that are even better than his excellent early-season stats — and he currently leads the league in strikeouts. That’s no fluke, either, as hitters simply aren’t making much contact against the former first-rounder. Gore’s 66.3% contact rate, if maintained, would be the 11th-best number among ERA qualifiers over the last decade, just behind former teammate Patrick Cor… OK, let’s stop that sentence before it gets dark. That Gore has two more years of cost control remaining gives the Nats an opportunity to absorb some risk on the injury front in order to get a better deal for a pitcher who looks like he’ll get rather expensive in a couple of years.
Logan Gilbert, Seattle Mariners – Six years, $121 million
ZiPS Projection – Logan Gilbert
Year
W
L
ERA
G
GS
IP
H
ER
HR
BB
SO
ERA+
WAR
2026
10
7
3.41
31
31
184.7
155
70
24
43
193
114
3.6
2027
9
7
3.49
29
29
173.0
148
67
23
40
176
111
3.2
2028
8
7
3.56
27
27
162.0
143
64
22
38
159
109
2.8
2029
8
6
3.64
26
26
148.3
133
60
20
35
142
107
2.4
2030
7
7
3.80
26
26
144.3
135
61
21
34
134
102
2.1
2031
6
6
3.95
22
22
127.7
123
56
19
31
115
98
1.6
To paraphrase Saint Augustine of Hippo: Jerry Dipoto, give me a Logan Gilbert contract extension, but not yet. You should probably never sign a pitcher who is currently on the IL with a flexor strain to big deal, so unlike the other extensions here, I wouldn’t suggest that the Mariners do this tomorrow. But if Gilbert comes back without problems or red flags, Seattle should sign him long term, especially with pitchers like George Kirby and Bryan Woo farther away for free agency and Luis Castillo not the talent he was as few years ago. ZiPS projects Gilbert to rank 10th among pitchers in five-year WAR, and of the others in the top 10, only Gilbert, Skubal, and Webb are eligible for free agency within the next three years. ZiPS prices Gilbert a bit lower than Gore, simply because the former is older and comes with a little less upside.
Steven Kwan, Cleveland Guardians – Six years, $111 million
ZiPS Projection – Steven Kwan
Year
BA
OBP
SLG
AB
R
H
2B
3B
HR
RBI
BB
SO
SB
OPS+
WAR
2026
.297
.371
.413
560
86
166
24
4
11
65
61
60
15
124
3.8
2027
.292
.367
.404
552
83
161
24
4
10
63
60
58
13
120
3.4
2028
.286
.361
.396
536
79
153
23
3
10
60
58
56
12
116
3.0
2029
.282
.359
.389
514
75
145
22
3
9
56
56
54
10
114
2.7
2030
.276
.353
.379
485
69
134
20
3
8
51
53
51
9
109
2.2
2031
.272
.350
.370
449
62
122
19
2
7
46
49
49
8
106
1.8
Steven Kwan is not a traditional corner outfielder, but even with his lack of power, he’s blossomed into an All-Star left fielder. Kwan is one of the most valuable contact hitters in baseball, and he makes the most of his elite contact ability by not falling into what I call the David Fletcher trap: Being so good at making contact that you hit a lot of pitches that you shouldn’t swing at. On the contrary, Kwan is a rather disciplined hitter for someone with his bat-to-ball skills; his career walk and chase rates are better than the league average. He plays solid defense in left field and gets as much out of his middling speed as is possible. The Guardians don’t like signing big deals, but José Ramírez isn’t impervious to the effects of aging, and the Guardians will have serious issues if they have to replace the production of both J-Ram and Kwan at the same time.
Hunter Brown, Houston Astros – Six years, $105 million
ZiPS Projection – Hunter Brown
Year
W
L
ERA
G
GS
IP
H
ER
HR
BB
SO
ERA+
WAR
2026
11
7
3.35
28
25
153.0
133
57
15
50
153
123
3.2
2027
11
7
3.35
27
24
150.3
132
56
15
48
148
123
3.1
2028
10
7
3.44
26
23
149.3
133
57
16
47
143
120
2.9
2029
10
7
3.55
26
22
144.3
130
57
16
45
135
116
2.7
2030
10
7
3.66
26
22
142.7
131
58
16
45
131
113
2.5
2031
9
7
3.76
23
20
131.7
124
55
16
41
117
110
2.2
Is Hunter Brown an ace now? I get asked that question in my chats three or four times a week now, and for the most part, I’ve avoided answering it because I knew that this piece was coming. So the answer is: Yes, yes he is. We have yet to see him carry a workload of 180-200 innings in a season, but at the moment, he’s on track to get there this year. And besides, volume is becoming less and less a part of an ace’s job description. Over the last calendar year, Brown ranks sixth in baseball with 5.1 WAR. During that span, he’s totaled 185 2/3 innings in 30 starts and posted a 16-6 record with a 2.28 ERA and a 2.89 FIP. Brown makes less than a million this year, and he’s still a long way away from fabulous riches. Buying out a few of his free agency years could be a good idea for both Brown and the Astros.
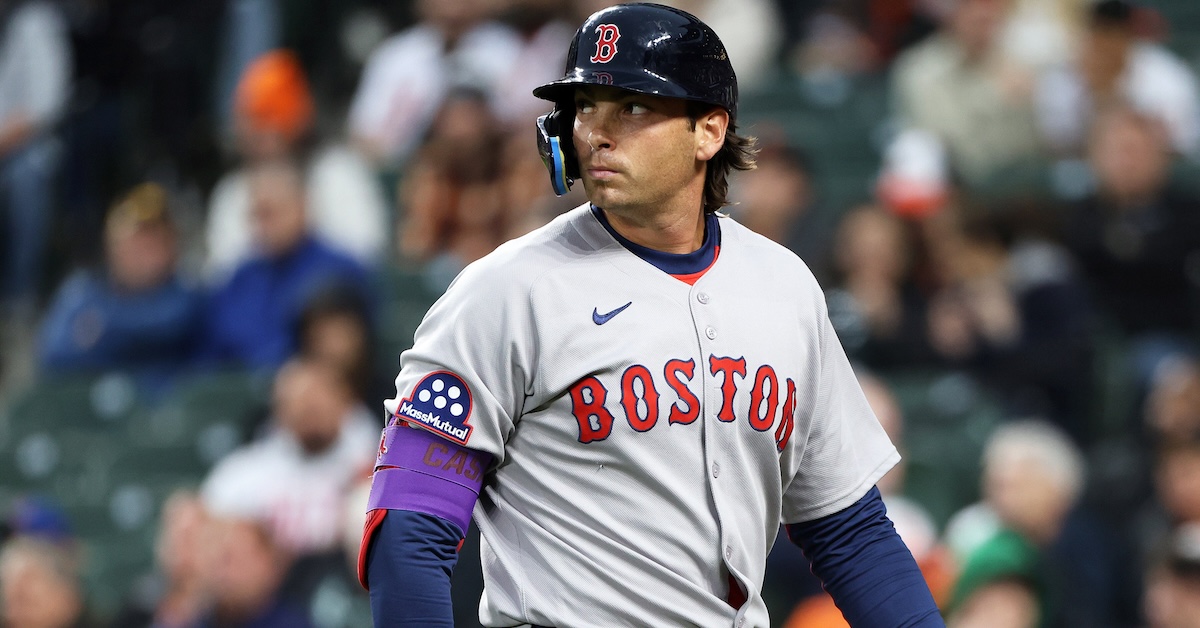
The Boston Red Sox dropped to a .500 record over the weekend, but that bit of unpleasantness was overshadowed by the loss of starting first baseman Triston Casas to a serious knee injury. Running to first during the first of a three-game set against the Twins on Friday, Casas collapsed suddenly while trying to beat out a slow roller fielded by the pitcher, Joe Ryan. It was revealed on Saturday that Casas had ruptured his left patellar tendon, and on Sunday he underwent surgery. Without Casas, the second-place Sox have to reconsider their short-term options at first base, ideally before they fall too far behind in the AL East.
Boston could find no cause for optimism to put a positive spin on what happened. Chief baseball officer Craig Breslow came right out and said the team doesn’t anticipate Casas to return in 2025. So, if you were hoping the first baseman might sneak back in time for the playoffs, that appears to be highly unlikely.
So what does this mean for Casas? Well, from a baseball standpoint — rather than a rehabilitation one, as I’m even less qualified to make medical pronouncements than Dr. Nick Riviera — coming into the season, ZiPS saw Casas as a solidly average first baseman, with a projected slash line of .246/.350/.462, a 125 wRC+ and 1.6 WAR. That last number was on the low side simply because ZiPS projected him to play in only 108 games, partially due to his being platooned in the past but also owing to his history of injuries. I expressed some concern about his profile in the preseason because of his struggles with making contact.
Casas was off to a slow start this year, hitting .182/.277/.303 with a bleak 58 wRC+. That’s worrisome for any player, but even more so for a platoon first baseman without much defensive value. All 27 games he started this season came against a righty. April’s gonna April, but the bad start did put a bit of a damper on his long-term outlook. Crank out some projections, ZiPS-o-Matic!
ZiPS Projection – Triston Casas (Pre-Injury)
Year
BA
OBP
SLG
AB
R
H
2B
3B
HR
RBI
BB
SO
SB
OPS+
WAR
2026
.240
.338
.439
396
49
95
20
1
19
61
57
115
0
113
1.1
2027
.239
.339
.435
402
50
96
20
1
19
63
59
115
0
112
1.1
2028
.240
.341
.436
404
50
97
20
1
19
63
60
113
0
113
1.1
2029
.240
.342
.437
400
50
96
20
1
19
62
60
111
0
113
1.1
2030
.238
.340
.425
390
47
93
20
1
17
59
58
108
0
110
0.9
Without factoring in his injury, Casas’ struggles to start 2025 caused a clear drop-off in his next-five-years projections, though I don’t personally think it was enough to fundamentally change our perception of him. He’s still a power-hitting first baseman you’d be happy to have in your lineup, but he’s not a major star to build around. As an aside, ZiPS is far less worried than the Red Sox are about letting Casas face left-handers; he is projected for a .226/.317/.395 line against southpaws in 2026. That’s not ideal, but it’s also not an unusually large platoon split for a left-handed slugger.
ZiPS is aware of injuries, but mainly in hindsight; it factors in the time missed after the fact because I don’t like being the position of diagnosing current injuries. But in this case, because we know that Casas’ rest-of-season projection is almost certainly going to be zero plate appearances, I don’t mind breaking the rules and telling ZiPS that 2025 is over and Casas missed more than 100 games with a knee injury.
As you can see, the season-ending injury has slightly soured his projection. But if there’s a silver lining here, it’s that Casas’ game isn’t really based on speed, meaning that ZiPS expects the overall long-term impact of the knee injury to be less for him than it would be for a faster runner. By contrast, when I run the same projection for Jarren Duran after giving him a serious knee injury — Sorry, Jarren! — his projected 2026 WAR declines from 3.5 to 2.2 WAR.
Casas ought to be back in 2026, but the Red Sox have to answer the question of what to do at first base for the next five months. Romy Gonzalez has been Casas’ platoon partner this year, and at .327/.382/.449, he’s hit well in his 55 plate appearances as of Monday morning. But he’ll probably lose a hundred points or so from his current .421 BABIP, so it’s unrealistic that he’ll keep up that line. That said, he has been making hard contact this season, with a hard-hit rate approaching 60%, up from 50% last year, meaning that his production is not a stone-cold fluke, either. ZiPS projects Gonzalez to post a 107 wRC+ the rest of the season, a reasonable performance for a Plan B first baseman, but the Red Sox should be a bit more ambitious than settling for reasonable, especially when the player in question is more of a substitute utilityman than a true first baseman.
But whom should they target then? That’s the harder question. Rafael Devers would seem to be the likely internal option, and the team hasn’t explicitly ruled that out, but I wouldn’t be surprised if the Red Sox decided not to switch his position again considering how he responded when they moved him off third base after signing Alex Bregman. In this case, perhaps discretion is the better part of valor. Boston also does not appear to be inclined to temporarily move to prospect Roman Anthony to first base.
Outside the organization, pickings are slim at the moment, as few teams have completely given up on the season. Andrew Vaughn is probably available, and his peripherals suggest that he’s performed better than his actual numbers during his brutal start, but I’m not sure Boston really wants a reclamation project here. The recently demoted Jake Burger would result in the same objection. If the Nats are interested in trading Nathaniel Lowe, he may be the best option out there, and he’s not a free agent until after next season, though that might make them less likely to move him. And the Brewers probably aren’t yet at a point where they’d let go of Rhys Hoskins for cheap. Anthony Rizzo is still a free agent, and Jon Singleton is now in Triple-A with the Mets, but if those are the two best options out there, I think the Red Sox would be better off just rolling with Romy. (I want to see Marcelo Mayer get some time at first, but that’s mostly so I can make some kind of lame Romy and Marcelo’s High School Reunion joke.)
The injury to Casas doesn’t doom his future outlook too much, nor does it shatter Boston’s chances to contend this season, but the Red Sox need to decide what they want to do here fairly quickly. Sure, the impact of any first base move would be limited, but even a marginal upgrade could make a difference in a tight AL East race.
You Buying…: Wilyer Abreu’s start? His k-rate is a smooch above where you’d probably like it to be but the underlying metrics seem to really support this breakout. ZiPS was already the most bullish projection system on him and hopefully that continues, for my fantasy team’s sake.
12:02
dylan: Wilyer Abreu is having an MVP caliber season and it isn’t close!!!!!
12:02
Dan Szymborski: He has an above-average contact rate!
The good news for the Baltimore Orioles is they won the first game of their three-game series against the first-place New York Yankees on Monday night. The bad news is the win only improved the team’s record to 11-17, the fourth-worst mark in baseball. As it stands Tuesday morning, the Orioles sit in last place in the AL East, and with nearly a fifth of the season over, it’s getting harder to dismiss the poor start as merely a blip.
Where the Orioles have struggled is not that hard to pinpoint: nearly everywhere. The rotation has combined for a 5.62 ERA/5.14 FIP and 6.4 strikeouts per nine innings, numbers that firmly place Baltimore at the bottom of the league. The defense hasn’t been much better, and after a decent start, the offense has evaporated over the last two weeks.
The season is longer than just April, of course, and the Orioles theoretically still have plenty of time to right the ship. But do they have the deckhands? To show whether or not they do, I took the current Orioles depth chart, and estimated the projected WAR based on playing time, using both ZiPS WAR from the preseason and the updated ZiPS WAR I ran overnight. Let’s start with the offense. Read the rest of this entry »
Isaiah J. Downing and Jayne Kamin-Oncea-Imagn Images
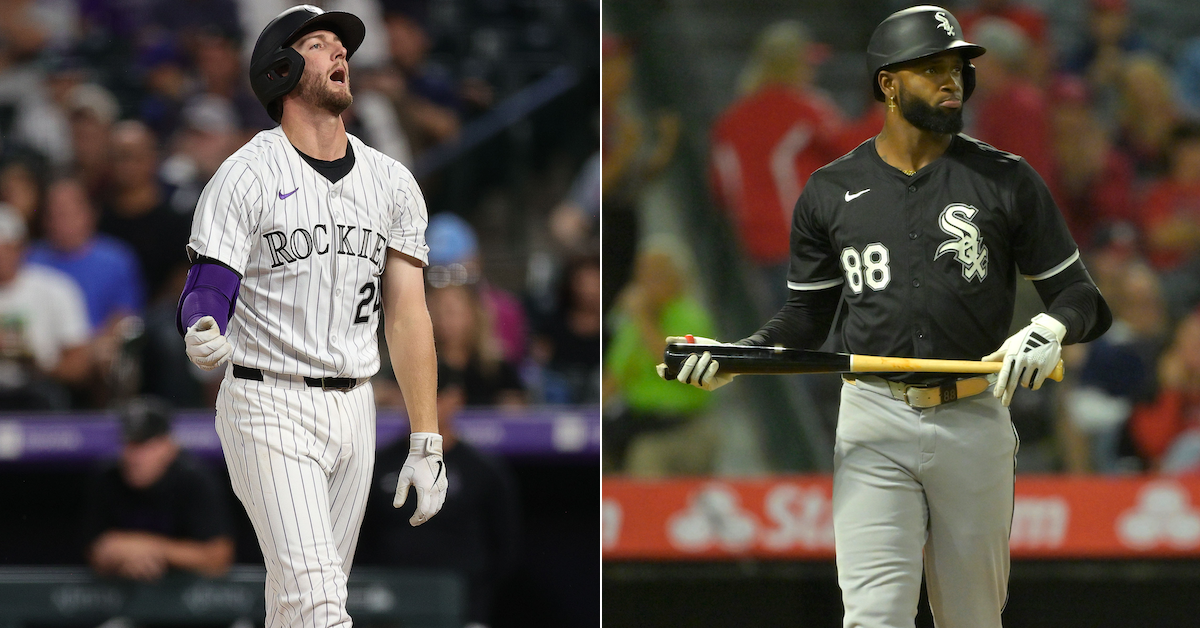
Anything worth doing is worth doing right, and when it came to losing games, the 2024 White Sox were the grandmasters of the art. Sure, the 1899 Cleveland Spiders had a worse record, but that was an intentionally terrible team thanks to an owner who sent the club’s good players over to another team they owned, the St. Louis Perfectos. The 1962 Mets edged the Sox in win percentage, but that notorious team had the advantage of being an expansion club in their first year after an expansion draft that was so short on talent, it resembled a grocery store’s toilet paper aisle during the height of COVID. Last year’s White Sox were just two years removed from a .500 record, and by all accounts, ownership and the front office intended to actually win games. A strong record, however, needs to be forged in the fire of new challengers, and this season, two early contenders have emerged: the Colorado Rockies and the reigning lastpions themselves.
The Rockies are off to a blazing cold start and are the current frontrunners with a 4-20 record. For a team with a winning percentage short of .200, Colorado has received some surprisingly competent pitching performances, with the two main splats being former Cy Young contender Germán Márquez and top prospect Chase Dollander. Where the Rockies have been stunningly poor is on the offensive side of things, with the team hitting .213/.287/.345 and just barely averaging three runs per game. Fourteen hitters have at least 20 plate appearances and more than half of them have a wRC+ below 70. Ryan McMahon’s performance is a particularly low lowlight; the third baseman has 39 strikeouts already thanks to an out-of-zone contact rate under 20%, a number so bananas that it looks like a programming glitch that proves our existence is actually a simulation.
ZiPS thought the Rockies would struggle in 2025, but not to this level. The system’s projection, for a mere 99 losses, even came with a (very) small chance of Colorado making the playoffs as a Wild Card team. After Thursday’s games, I did a full re-simulation of the 2025 season to get a projection for what the Rockies could achieve if they fail to get the wheels back on the cart:
ZiPS Win Projection – Colorado Rockies
Wins
Percentage
Cumulative
28
0.0%
0.0%
29
0.0%
0.0%
30
0.0%
0.0%
31
0.1%
0.1%
32
0.1%
0.2%
33
0.1%
0.3%
34
0.2%
0.5%
35
0.3%
0.7%
36
0.5%
1.2%
37
0.7%
1.8%
38
0.8%
2.7%
39
1.0%
3.7%
40
1.5%
5.2%
41
1.8%
7.0%
42
2.0%
8.9%
43
2.6%
11.5%
44
2.9%
14.4%
45
3.3%
17.7%
46
4.0%
21.7%
47
4.1%
25.8%
48
4.4%
30.2%
49
4.7%
34.9%
50
5.2%
40.1%
51
5.0%
45.0%
52
5.4%
50.4%
53
5.2%
55.6%
54
5.1%
60.7%
55
5.0%
65.7%
56
4.7%
70.4%
57
4.3%
74.7%
58
4.1%
78.8%
59
3.7%
82.5%
60
3.3%
85.7%
61
2.8%
88.5%
62
2.4%
91.0%
63
1.9%
92.9%
64
1.7%
94.6%
65
1.3%
95.9%
66
1.1%
97.1%
67
0.9%
97.9%
68
0.6%
98.6%
69
0.4%
99.0%
70
0.4%
99.4%
71
0.2%
99.6%
72
0.2%
99.8%
73
0.1%
99.9%
74
0.1%
99.9%
75
0.0%
100.0%
76
0.0%
100.0%
77
0.0%
100.0%
78
0.0%
100.0%
79
0.0%
100.0%
80
0.0%
100.0%
81
0.0%
100.0%
Naturally, the team’s small sliver of playoff probability has been wiped out by April. In the preseason projections, the Rockies only had a 1.5% chance of matching 121 losses and a 0.8% chance of setting a new record. So while the feat was at least plausible, it was a long shot. The odds are still strongly against — losing this many games is really hard — but seven and five percent are bonafide countin’ numbers.
Colorado’s biggest obstacle in the pursuit of infamy is that there are real reasons for hope when looking at the roster. As mentioned above, Márquez and Dollander have been terrible, but there is still at least some remaining chance that the former can get back to where he was, and the latter is an elite prospect. Michael Toglia is a Triple-A-caliber first baseman, not a pitcher dragooned into the lineup, and will surely fall short of his -6 WAR pace. Ezequiel Tovar is a better player than this, and guys like Zac Veen and Adael Amador have legitimate upside. The Rockies simply have a lot of saving throws that could lead to more positive outcomes this year. The start makes it possible that the Rockies will match the 2024 Sox for futility, but when you watch Colorado, your eyes aren’t physically forced to stare blurrily into middle distance at the Stygian maw, where nothing will give your frozen gaze succor from the dread of oblivion and Chris Davis‘ contract.
But hey, we still have the OGs, the White Sox, to look at. At 6-19, they’re a game and a half behind the Rockies for these purposes, but if ZiPS is to be believed, they’re a fundamentally worse roster. Chicago’s 52-110 projected record coming into the 2025 season is the worst projection ZiPS has ever given a team (not counting that article last year where I projected how Triple-A teams would fare in the majors):
ZiPS Win Projection – Chicago White Sox
Win
Percentage
Cumulative
28
0.0%
0.0%
29
0.1%
0.1%
30
0.1%
0.2%
31
0.2%
0.4%
32
0.3%
0.7%
33
0.4%
1.1%
34
0.6%
1.7%
35
0.9%
2.6%
36
1.3%
3.9%
37
1.5%
5.4%
38
1.9%
7.3%
39
2.4%
9.7%
40
2.8%
12.4%
41
3.4%
15.8%
42
3.7%
19.6%
43
4.1%
23.6%
44
4.7%
28.3%
45
5.1%
33.4%
46
5.3%
38.7%
47
5.5%
44.2%
48
5.4%
49.6%
49
5.3%
54.9%
50
5.1%
60.0%
51
5.0%
65.0%
52
4.7%
69.7%
53
4.4%
74.1%
54
4.2%
78.3%
55
3.7%
82.0%
56
3.2%
85.2%
57
2.9%
88.1%
58
2.5%
90.6%
59
2.0%
92.7%
60
1.6%
94.3%
61
1.5%
95.8%
62
1.2%
96.9%
63
0.8%
97.7%
64
0.7%
98.4%
65
0.5%
98.9%
66
0.4%
99.2%
67
0.3%
99.5%
68
0.2%
99.7%
69
0.1%
99.8%
70
0.1%
99.9%
71
0.0%
100.0%
72
0.0%
100.0%
73
0.0%
100.0%
74
0.0%
100.0%
75
0.0%
100.0%
76
0.0%
100.0%
77
0.0%
100.0%
78
0.0%
100.0%
79
0.0%
100.0%
80
0.0%
100.0%
81
0.0%
100.0%
ZiPS gives the White Sox a 16% chance of matching last year’s loss total and a 12% chance — better than the probability of an Aaron Judge homer — of besting it. Where the White Sox and Rockies differ in the pantheon of lousy teams is that the Sox are currently configured in a way that greatly limits their upside. For a rebuilding team, the starting lineup is surprisingly old and established; players like Nick Maton, Michael A. Taylor, and Matt Thaiss have a use as role players on a good team, but the ceiling on their performance is quite low. Currently injured players such as Josh Rojas and Mike Tauchman are in the same boat. The Sox have built a Triple-A-caliber team with a roster that looks like one. If you had been out of the country and behind on the baseball news and someone gave you a printout of this roster with “Charlotte Knights” at the top, would it immediately register as wrong?
That’s not to say there aren’t any players with upside. I actually like the return the Sox got for Garrett Crochet, and think that Kyle Teel, Chase Meidroth, and Braden Montgomery could all have futures in the majors. Shane Smith has been a highlight for me as a starter, and I’m totally digging Brandon Eisert’s hot start as a junk-tossing Doug Jones-esque reliever, an archetype you don’t see very often in modern baseball. But the prospects won’t be prominent quickly enough, and the interesting pitchers are too few, to give this team a real sense of short-term optimism.
There’s even a chance that both teams tie or set the record, with the Rockies and White Sox both at least tying the record in 1% of simulations and both beating the record in 0.6% of the runs. It’s too soon to known whether we’ll see a true Lossapalooza or merely two ordinarily lousy teams come September, but it’s fun to dream… darkly.
The Braves entered 2024 with high hopes for the coming season, but their campaign ended in disappointing fashion. After making the playoffs by the slimmest of margins, they were unceremoniously eliminated by the Padres. It’s now been more than seven months since Atlanta’s early exit, and the calendar has flipped to a new season. The same cannot be said for the team’s fortunes.
Indeed, the Braves have started off this year in a funk, and not of the good Sly and the Family Stone variety. A season-opening series against the Padres, followed by a trip to Chavez Ravine for a matchup with the defending-champion Dodgers, left Atlanta with seven losses to start the season and Reynaldo López on the IL for most, if not all, of 2025. A sweep of the similarly underwhelming Minnesota Twins staunched the bleeding somewhat, but another wound opened up soon after, as Spencer Strider strained his hamstring playing catch on Monday and returned to the IL just one start after coming back from major elbow surgery.
A 9-14 start, even when coupled with the loss of López and Strider, doesn’t make 2025 a lost cause, but it does complicate matters considerably. Let’s first look back at the ZiPS preseason projections for the NL East standings. Read the rest of this entry »