On the day that commissioner Rob Manfred set as a deadline for the completion of a new collective bargaining agreement that would end the owners’ self-imposed lockout and keep a March 31 Opening Day on schedule, no deal was reached. For the eighth consecutive day of negotiations, representatives for the owners and the players’ union met at Jupiter, Florida’s Roger Dean Stadium, going back and forth so many times over the course of 16 1/2 hours that the calculations of steps traveled strained FanGraphs’ servers, to say nothing of the brains of the handful of reporters staked out outside the gates. Enough progress towards a deal was made before the two sides broke for the night at 2:30 AM ET that Manfred agreed to extend the artificially-imposed deadline to 5 PM ET on Tuesday.
While nothing has been finalized, the reports of where the key components are heading do not paint a particularly pretty picture for the players’ side. After a decade in which they have largely been shut out of massive revenue growth, with new television deals falling into place, they appear to be improving the lot of their rank and file — no small matter in an industry where 47% of all service time went to players making the minimum salary — but while achieving only modest gains in areas where they initially sought more radical change.
Based upon the drips and drabs that have emerged from various reports, the battle to expand the postseason has loomed large, with MLB presenting alternative proposals based on whether it’s 14 teams (their preference) or 12 (the union’s preference).
Sources: Deal not close, but not impossible. CBT thresholds, prearb pool big issues, among others. MLB has proposed two choices:
A: 14-team expanded postseason, minimum of ~$700k, ~40m into prearb pool
B: 12-team expanded postseason, ~$675k minimum, ~$20m into prearb pool
The 12-team format appears to be the route this deal will take, though according to the New York Post’s Andrew Marchand, the gap between the two formats amounts to only a $15 million difference in what ESPN is offering ($100 million for a 14-team format, $85 million for a 12-team one). Whether the “ghost win” concept — giving the division-winning team that does not receive a first-round bye a one-game-to-none advantage in a best-of-five series — survives is unclear at this writing. Read the rest of this entry »
It’s February 28, the deadline set by commissioner Rob Manfred to have a new collective bargaining agreement in place that would end the owners’ self-imposed lockout and allow the season to open as scheduled on March 31 following an abbreviated spring training. To the surprise of no one, there’s no deal yet, even after seven straight days of negotiations between representatives for the owners and the players union in Jupiter, Florida, talks that have stretched into Monday. Negotiations have yielded incremental progress regarding some core economic issues and other matters, but the two sides remain far apart nonetheless. While a league official characterized Sunday’s talks as “productive” after both sides voiced considerable acrimony on Saturday, it would take something on the order of a miracle to have a deal in place by the end of the day.
What’s more, if the league intends to treat the February 28 deadline as a hard one, living up to its threat to cancel games without making them up, and not paying players for a full 162-game season, a deal may become even harder to reach. That would create another issue to settle via negotiations, because the length of a season is subject to collective bargaining; the league can’t unilaterally reduce it. One need only to dial back to 2020 to recall what a fiasco that can become once service time and contract incentives come into play. What’s more, the cancellation of games would raise the possibility of the players answering with some hardball of their own by not agreeing to expanded playoffs for the 2022 season. The union indicated that was possible earlier this month, when the specter of cancellations arose. The value of those expanded playoffs is estimated at $100 million. Read the rest of this entry »
Though the owners could end their self-imposed lockout of the players at any time and allow the baseball season to proceed on schedule, the first week of spring training games has been scrubbed. Odds are that more cancellations are to come, and commissioner Rob Manfred’s February 28 deadline to reach an agreement on a new collective bargaining agreement that would preserve Opening Day is fast approaching. With a newfound sense of urgency that stands in marked contrast to Major League Baseball offering one formal proposal in the lockout’s first 10 weeks, representatives for the owners and the players union have been meeting on a daily basis in Jupiter, Florida this week to discuss core economic issues — and those meetings have lasted more than 15 minutes at a time! But even with the more frequent back-and-forth and some minor movement here and there, including a formal proposal from the players on Tuesday, the two sides still appear to be far apart on the most central issues.
If there’s optimism to be had, let us know, because we could sure use some. In the meantime, here’s an attempt to capture where things stand as of Wednesday morning.
Competitive Balance Tax
The lack of optimism regarding an impending resolution to the lockout centers on the players making the tax “the lodestar” of negotiations, to use Jeff Passan’s term, and so far this week, neither side has budged from where things stood as of the owners’ February 12 proposal. I broke down the recent history of the CBT — the threshold for which has not kept pace with the growth of revenue over the past decade — in my previous analysis in the wake of that proposal.
The short version is that the players believe the CBT functions as a salary cap. With teams’ total payrolls down 4.6% from 2017 (from about $4.25 billion to $4.05 billion), and with most of the biggest-spending teams pulling up just short of the threshold in 2021 — the Phillies, Yankees, Mets, Red Sox, and Astros were all within $4 million of the $210 million bar, with only the Dodgers and Padres paying the tax — one can understand their frustration. In Tuesday’s proposal, the players didn’t budge from their previous position from January 24. While generally preserving the previous CBA’s tiered penalties for teams exceeding the thresholds by more than $20 million and more than $40 million, they’ve sought an increase in the base threshold from $210 million to $245 million, growing to $273 million by 2026. That jump in part makes up for the threshold’s meager growth over the life of the last CBA (from $195 million to $210 million over five years, an average of 2.1%), while revenues grew at a quicker rate. The only real difference in that aspect of their proposal is that there’s no draft-related penalty involved, where the previous CBA bumped the draft place for the highest pick of any team with a payroll at least $40 million above the threshold down by 10 spots (unless it was a top-six pick). Read the rest of this entry »
Our story so far: It is a dark time for recognizing Hall of Fame starting pitchers. While the 300-wins-or-bust barrier has fallen, starters born in 1950 or later have become significantly underrepresented in Cooperstown. The cream of the crop within that demographic has been honored, with a couple of notable exceptions whose own actions wounded their candidacies, causing them to age off the writers’ ballot. With falling workloads illustrating that the time of the 250-inning starter is behind us, it makes sense to reframe expectations for what constitutes a Hall-worthy hurler.
Enter S-JAWS, the experimental version of my Hall of Fame fitness metric, introduced during the past election cycle. As an attempt to reduce the skewing caused by the impact of 19th-century and dead-ball era pitchers, S-JAWS prorates peak WAR credit for any heavy-workload season to a maximum of 250 innings. The new metric — which is now the default at the starters’ Baseball Reference page — can help to illuminate some candidates throughout history who deserve a closer look even after being passed over so many times, though from a practical standpoint the oldest pitchers of the group could be a decade away from actual placement on an Era Committee ballot.
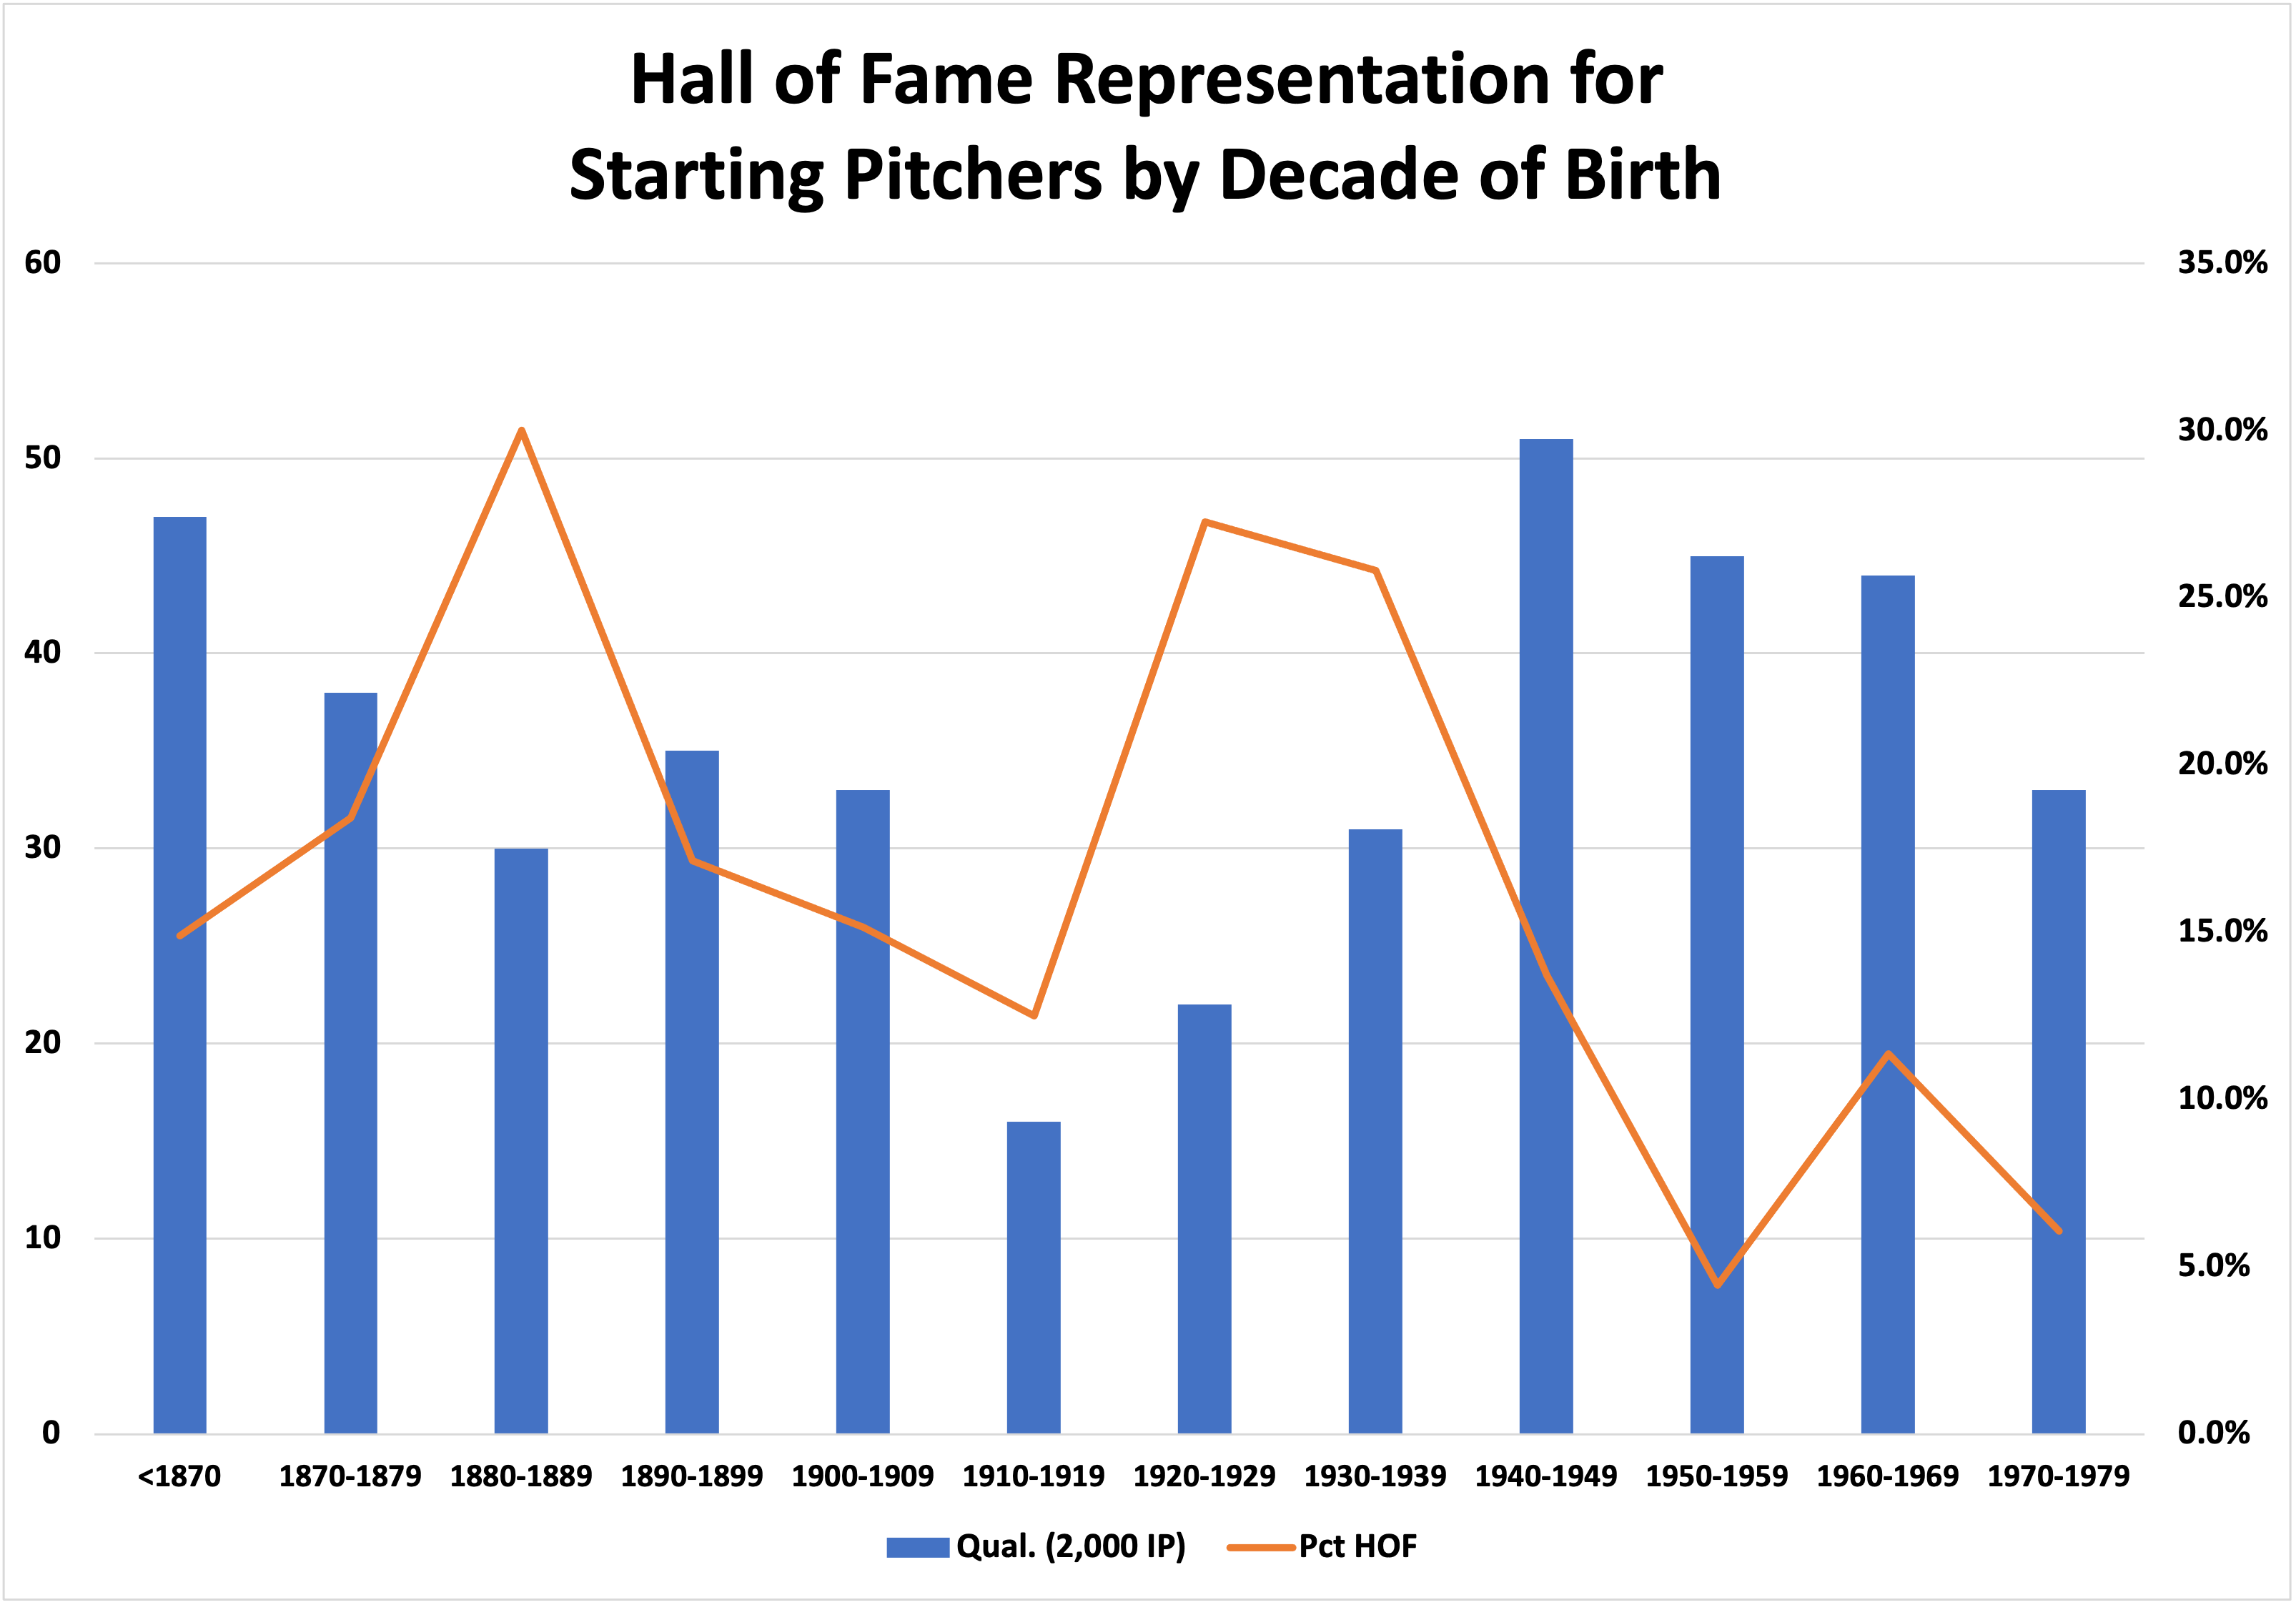
Before taking a breeze through those candidates — the part of this series many of you’ve been waiting for — here once again is the graphic summary of Hall of Fame representation rates for starting pitchers by birth decade, expressed as a percentage of “qualifiers” who reached 2,000 career innings. It’s a handy practical cutoff that includes every enshrined pitcher from the NL, AL, and bygone white leagues except Dizzy Dean (who fell 32.2 innings short), plus relievers Hoyt Wilhelm and Dennis Eckersley, who aren’t included in the counts of enshrined starters.
And here’s an aggregation of longer-term representation rates that I find most helpful:
Hall of Fame Representation, JAWS, and S-JAWS
Birth Decade
Qual
HOF SP
Pct
WAR
Peak
Peak Adj.
JAWS
S-JAWS
Change
Peak Adj.%
<1900
151
29
19.2%
73.5
53.6
38.4
63.6
56.0
-7.6
72%
1900-1929
71
13
18.3%
67.5
45.9
40.6
56.7
54.0
-2.7
88%
1930-1949
82
15
18.3%
73.7
48.1
41.4
60.9
57.6
-3.4
86%
1950-1979
122
9
7.4%
80.7
48.5
47.5
64.6
64.1
-0.5
98%
Total
425
66
15.5%
73.0
49.8
40.7
61.4
56.8
-4.6
82%
Before we dive in, I’ll note that there just aren’t enough eligible pitchers of quality that we can level the representation rates entirely. That isn’t even my goal here, but I am looking to boost the rates of more recent pitchers while keeping in mind that the somewhat looser standards make it apparent that a few guys from the more ancient eras look even stronger in the light of S-JAWS than in JAWS. We shouldn’t leave them by the wayside, but the staggered Era Committee process — with Early Baseball candidates (those who made their marks before 1950) not yet eligible for reconsideration before 2032, and Golden Days candidates (1950–69) not until 2027 — already defaults to making them lower priorities anyway.
With that, I’ll break this down into the top starters for each period who are outside the Hall, identifying those who fall within the top 100 of the rankings — about 43.0 S-JAWS, which captures shorter-career guys such as Félix Hernández, who’s an electoral longshot, to Sandy Koufax, who’s enshrined despite the brevity of his career. This is not to say that all of the pitchers on the outside that I’m highlighting here are Hall-worthy or that S-JAWS should be the only consideration for anointing them. The hope is that by appreciating what their candidacies do offer, we can come up with an appropriate list of pitchers whose elections should be prioritized. Read the rest of this entry »
Jay Jaffe: Hey folks, good afternoon and welcome to my chat! I’m running a few minutes behind here as lunch just arrived and I had a home appliance situation to tend to . Gonna need 5-10 minutes to get settled
Amid a dearth of baseball news, the Nationals took a starring role this week, not only via the retirement of franchise cornerstone Ryan Zimmerman but also the report that before the lockout, the team offered Juan Soto a 13-year, $350 million extension. While we’ve now seen nine deals of at least $300 million in recent years — not to mention a report of a pending extension offer to Soto in the wake of Fernando Tatis Jr.’s $340-million deal last March — the price tag produced the usual sticker shock on social media, as well as incredulity given that the slugger declined it.
Via ESPN Deportes’ Enrique Rojas, the 23-year-old Soto confirmed the news, saying, “Yes, they made me an offer a few months ago, before the lockout. But right now, my agents and I think the best option is to go year by year and wait for free agency. My agent, Scott Boras, has control over the situation.” Read the rest of this entry »
During the 2022 Hall of Fame election cycle, I introduced S-JAWS, an experimental version of my starting pitcher metric, in the service of evaluating candidates on the Golden Days and BBWAA ballots. I promised to return to the topic for a broader look at pitchers from other periods, but before doing so took a littledetour related to the representation rates and demographics of the players elected to the Hall. This larger exploration helps to illustrate the importance of looking at the situation in a new light.
Like JAWS, S-JAWS is a Hall of Fame fitness metric based upon Baseball Reference’s version of WAR, though those shouldn’t be the only factors under consideration in a Hall of Fame case, whether we’re discussing pitchers or position players. They’re nonetheless critical to my analysis, a useful first-cut mechanism to tell me, “Is this a candidate worthy of consideration for a spot on a ballot?” but as I’ve stressed through my annual series and elsewhere, other factors such as awards, postseason play, and historical importance are germane as well. Whether we’re using JAWS or S-JAWS — both of which you can see on the Starting Pitchers page at Baseball Reference — that doesn’t change. In fact, that page now defaults to sorting by S-JAWS, though you can see rankings by JAWS or any other category you choose, whether it’s WAR or innings pitched or ERA+ or some other stat.
Like JAWS, S-JAWS uses an average of a pitcher’s career and peak WAR (best seven seasons at large) for comparisons to the averages of all Hall of Fame pitchers. The idea behind S-JAWS is to reduce the skewing caused by the impact of 19th century and dead-ball era pitchers, some of whom topped 400, 500, or even 600 innings in a season on multiple occasions. The way I’ve chosen to do this is by prorating the peak-component credit for any heavy-workload season to a maximum of 250 innings. I chose 250 because it’s a level that the current and recent BBWAA candidates rarely reached, and only one active pitcher (Justin Verlander) has, albeit by a single inning a decade ago. Over the past 22 162-game seasons — in other words, every one since 1999, save for the pandemic-shortened 2020 campaign — only eight out of 44 league leaders topped 250 innings, with Hall of Famers Roy Halladay, Randy Johnson, and Mike Mussina accounting for five of those eight seasons. Only two of the past 32 league leaders topped 250 inning, Halladay in 2010 and Verlander the following year, and between them they were a grand total of five outs over the threshold. The various emphases on pitch counts, innings limits, and times through the order make it unlikely we’ll see such levels again, at least on a consistent basis, and while we can debate, lament, and discuss whether it’s worth trying to reverse that trend, that’s not my focus here. Given the current trends in the game regarding starting pitcher usage, five or 10 years from now, looking at candidates on a 200- or 225-inning basis might make more sense, but I think this is a reasonable place to start the adjustments (I’ll have a look at a 200-inning basis at some point). Read the rest of this entry »
You didn’t have to be a cynical curmudgeon to know that Saturday’s meeting between Major League Baseball and the Major League Baseball Players Association would not magically produce a deal for a new Collective Bargaining Agreement, thus allowing spring training to begin on time. With its “defensive” lockout and subsequent failure to officially offer more than one proposal to the players on core economic issues over the previous 71 days — a counterintuitive definition of “jumpstart,” never before observed in the wild — the league had already made abundantly clear the fantastical nature of any dates attached to pitchers and catchers reporting. By prematurely calling for the entry of a federal mediator into the proceedings after the barest attempt to negotiate, by telling the media that “phones work two ways” when it comes to bargaining, by downplaying the financial benefits of owning a team relative to investing in the stock market, and by mischaracterizing the owners’ latest proposal for the Competitive Balance Tax rates, commissioner Rob Manfred and the owners have made it clear in recent weeks that they aren’t ready to play ball. And so, for the foreseeable future, there will be no major league baseball played.
Manfred has yet to make a formal announcement to that effect because no spring training games have been scrubbed thus far, but viaUSA Today’s Bob Nightengale, that could happen by the end of this week, as the exhibition season is scheduled to begin on February 26. During his press conference last week, Manfred didn’t offer a deadline for an agreement that would keep the March 31 date for Opening Day intact, though he did express a desire for a minimum of four weeks of spring training, suggesting that the league has absorbed at least one lesson from the frenzied and contentious run-up to the 2020 season and the soaring injury rates that followed. Nightengale reported February 28 as the deadline for an agreement that would preserve Opening Day, though with 197 unsigned arbitration-eligible players and nearly 300 free agents (his figures), such a compressed timeframe would create a level of chaos and logistical difficulty that would make Team Entropy cringe.
If you’re expecting this column to both-sides the failure to hash out a new CBA, to assign equal blame to the MLBPA as to the owners, you’ll have to look elsewhere. This is a lockout, not a strike. It is entirely of the owners’ doing — you could say they own it — and entirely unnecessary, because the 2022 season could be played under the terms of the previous CBA until a new one is in place. The two sides would need to agree to restore the old agreement’s Competitive Balance Tax, Joint Drug Agreement, and domestic violence policy — all of which have technically expired as of December 1, 2021 — until such a point, and that may not be trivial, but it would be a rare glimpse of good faith. Based on the minimal concessions the owners have been offering, not to mention the widening gap between revenues and salaries over the past decade, they must like that old CBA pretty well, because they seem reluctant to change things too radically.
Yes, the two sides have agreed that the new CBA will include a draft lottery of some kind as well as a universal designated hitter and the elimination of draft pick compensation, as Manfred announced on Thursday. But the owners have refused to budge from the status quo on the years to free agency and arbitration, as well as revenue sharing, and the two sides remain miles apart on the core economic issues addressed in Saturday’s proposal. The players are not amused. ViaThe Athletic’s Evan Drellich and Ken Rosenthal:
There are some [players] who would have preferred that the union had not made its last counter offer at all. Some of the same sentiment cropped up Saturday, based on a feeling that MLB is moving too little to consistently warrant counter-offers.
Because Saturday, when MLB made its first economics proposal of February, was predictably just like everything else that preceded it. MLB made moves it thought the players should consider significant, and the players felt, again, lowballed and frustrated. Some players fear that with their counter-offers they essentially are bidding against themselves. The league says it has the same fear with its own offers to players.
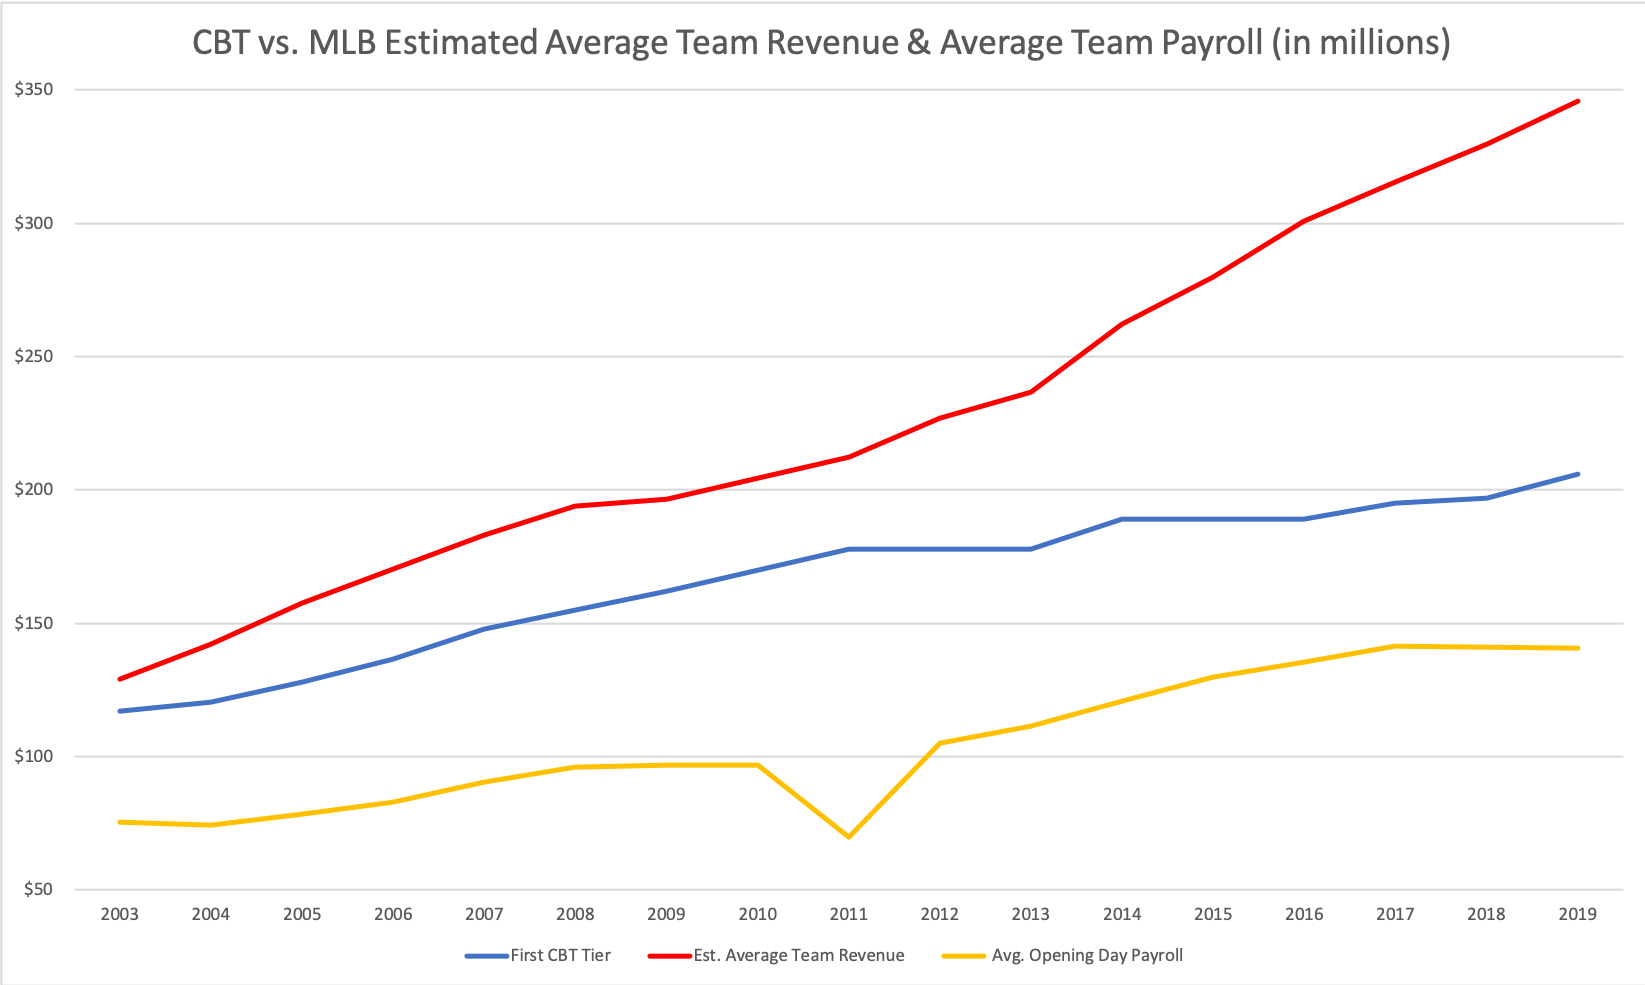
While there’s certainly interplay between the various economic facets under discussion, no single issue illustrates the distance between the two sides, and MLB’s unwillingness to yield, more than the Competitive Balance Tax structure. Over the past decade, the tax threshold has not kept pace with revenue (or, for that matter, inflation), and it has functioned as a soft salary cap that even the wealthiest teams have been willing to approach but very rarely go over; perThe Athletic, the Phillies, Yankees, Mets, Red Sox, and Astros all finished with payrolls less than $4 million below the first CBT threshold in 2021. From that roundtable, using figures from Forbes and the Associated Press, here’s The Athletic’s oft-circulated graph showing the separation between the revenue and the lowest threshold:
In Thursday’s press conference, Manfred mischaracterized the owners’ previous proposal as being similar to last year’s structure with regards to the tax. Via ESPN’s Jeff Passan:
Manfred said the league had proposed taxation rates that were “status quo.” This was incorrect. In recent years, the tax rate was 20% for teams over the $210 million threshold, 32% at $230 million and 62.5% at $250 million. MLB’s proposal calls for a 50% rate at a $214 million threshold, 75% at $234 million and 100% at $254 million. Additionally, teams would lose a third-round draft pick at the first threshold, a second-round pick at the second and a first-round pick at the largest.
Admittedly, things get a bit confusing when trying to distinguish between the penalties for moving up a tier ($20 million or $40 million above the first tax threshold) and those for repeated annual violations. Using MLB Trade Rumors, The Athletic and the expired CBA, I’ve attempted to summarize the CBT’s recent history and the basics of the three economic proposals that have been officially exchanged since the beginning of the lockout (two offered by the league, one by the players). First, here’s a look at the thresholds:
Competitive Balance Tax Thresholds
Year
Threshold ($Mil)
Annual Change
2012
$178
0.0%
2013
$178
0.0%
2014
$189
6.2%
2015
$189
0.0%
2016
$189
0.0%
2017
$195
3.2%
2018
$197
1.0%
2019
$206
4.6%
2020
$208
1.0%
2021
$210
1.0%
MLB 1/13 Proposal
2022
$214
1.9%
2023
$214
0.0%
2024
$214
0.0%
2025
$216
0.9%
2026
$220
1.9%
MLB 2/12 Proposal
2022
$214
1.9%
2023
$214
0.0%
2024
$216
0.9%
2025
$218
0.9%
2026
$222
1.8%
MLBPA 1/24 Proposal
2022
$245
16.7%
2023
$252
2.9%
2024
$259
2.8%
2025
$266
2.7%
2026
$273
2.6%
As you can see, the first threshold has barely budged in recent years, falling short of even a typical 2% or 3% cost-of-living adjustment, let alone the rate of inflation. As MLB Trade Rumors’ Tim Dierkes explained, “A simple 5% increase per year beginning in 2012 would have put the 2021 base tax threshold around $290MM, yet it sat only at $210MM.”
Note that rather than ordering the official proposals chronologically in the table above, I’ve kept the owners’ two proposals adjacent to illustrate how little they differ. The second one increased the thresholds for each of the last three years of the upcoming CBA by a whole $2 million a year. It took the owners a month to come up with that, though to be fair, they did also do away with teams exceeding the first tier losing a third-round draft pick (worth $3.8 million by Craig Edwards’ 2019 estimates, and probably not much more now).
Here’s what those penalties look like:
Competitive Balance Tax Penalties
Amount Payroll Exceeds Base Tax Threshold ($M)
1st-Time
2nd-Time
3rd-Time+
Draft
2017-21
<$20 (Base Tax Rate)
20%
30%
50%
—
$20-$40 (Base Tax + 1st Surcharge Rate)
32%
42%
62%
—
>$40 (Base Tax + 2nd Surcharge Rate)
62.5%
75%
95%
(1)
MLB 1/13 Proposal
<$20 (Base Tax Rate)
50%
50%
50%
(2)
$20-$40 (Base Tax + 1st Surcharge Rate)
75%
75%
75%
(2)
>$40 (Base Tax + 2nd Surcharge Rate)
100%
100%
100%
(2)
MLB 2/12 Proposal
<$20 (Base Tax Rate)
50%
50%
50%
(3)
$20-$40 (Base Tax + 1st Surcharge Rate)
75%
75%
75%
(3)
>$40 (Base Tax + 2nd Surcharge Rate)
100%
100%
100%
(3)
MLBPA 1/24 Proposal
<$20 (Base Tax Rate)
20%
30%
50%
—
$20-$40 (Base Tax + 1st Surcharge Rate)
32%
42%
62%
—
>$40 (Base Tax + 2nd Surcharge Rate)
62.5%
75%
95%
—
(1) = for payrolls at least $40M above threshold, team’s highest pick dropped 10 places unless the pick was among the top six; in that case, team’s second-highest pick dropped 10 places.
(2) = third round pick surrendered for teams in Tier 1, second-round pick surrendered for teams in Tier 2, first-round pick surrendered for teams in Tier 3
(3) = second-round pick surrendered for teams in Tier 2, first-round pick surrendered for teams in Tier 3
While the players’ first post-lockout proposal attempts to make up a bit of the lost ground with a substantial jump in the CBT threshold, it maintains the same tiered and annual penalties that were in the last CBA. Meanwhile, the tiered penalties in the league’s two offers have become more severe even while the thresholds have barely moved. Even with the removal of escalating repeater penalties and the draft pick penalties for teams exceeding the first threshold, the owners’ proposal appears designed to continue the effects of the last CBA, during which the average salary fell by 6.4% relative to 2017, with the brunt borne by baseball’s middle class; via the Associated Press’ Ronald Blum, the median salary dropped 30%, from $1.65 million in 2015 to $1.15 million in ’21.
Regardless of the other bells and whistles in the deal, the players simply don’t believe that the structure of the owners’ proposals will allow them to grow their salaries. As pitcher Alex Wood put it via Twitter on Saturday:
If penalties increase under the CBT/Luxury tax IT DOES NOT MATTER WHAT THE THRESHOLD IS MY GOD. Make the threshold a billion dollars it doesn’t matter. Teams already don’t spend bc they use the current penalties as an excuse not to. Imagine if the penalties got worse. SMH.
Beyond the tax structure, the two sides are far apart on the minimum salary, which in 2021 stood at $570,500, the lowest of the “big four” North American team sports according to The Score’s Travis Sawchick (the NBA’s $925,258 is the highest, and even the NHL comes in at $750,000), and only about 12% higher than in 2016, with annual growth of less than 2% in each of the past four years. What’s more, none of those other sports rely on that minimum-salary labor more than baseball. Via Sawchik, 63.2% of all players in 2019 had less than three years of service time, meaning that they were generally making some function of the league minimum. Those players accounted for 53.6% of all service time accumulated, but only 9.8% of player pay. Via Ben Clemens, in 2021, players making the minimum accounted for 47% of service time accrued, but only 7.5% of player pay. Via Nightengale, 1,145 of the 1,670 players on rosters last year (68.6%) made less than $1 million — a reminder that calling this a fight between millionaires and billionaires is off base.
The union has proposed increasing the minimum salary to $775,000. After making a preliminary offer of $600,000 during negotiations in mid-December, the league offered straight salaries of $615,000, $650,000 and $700,000 for players with 0-1, 1-2, and 2-3 years of service time in their mid-January proposal. On Saturday, they proposed raising the salary for the third year to $725,000, and offered an alternative as well, a flat minimum of $630,000 in the first year of the deal; that’s 10.4% above the current minimum, a jump that would be the largest since the 2012 CBA increased the minimum from $414,00 to $480,000 (15.9%), but it’s less than $6,400 ahead of what the minimum would be if the last CBA’s 2017 minimum ($535,000) had grown with inflation. Under that structure, teams would be able to give raises for subsequent years, but would also be able to unilaterally renew contracts with smaller or no raises as well, just as they have for ages.
Along with the proposals for the minimum salary come proposals for a pre-arbitration bonus pool, where the gap between the two sides might best be described as a chasm. Via ESPN’s Jesse Rogers:
The league increased its offer from $10 million to $15 million while offering a six-person panel — three from each side — to develop a mutually agreeable WAR statistic to allocate the funds. The top 30 players in WAR and award winners would be eligible for the bonus pool.
The union has asked for a $100 million bonus pool, down from a previous offer of $105 million.
The latter reduction came as part of negotiations since the MLBPA’s first formal post-lockout offer. That the two sides have reduced the gap from $95 to $85 million doesn’t exactly count as progress, though to call back to the aforementioned Clemens analysis of the players’ first proposal, the amount in question is now less than 1% of the league’s annual revenues. The structure of how the money would be divided up isn’t clear, but the league’s figure would mean an average of an additional $500,000 for those top 30 players, while the union’s figure would mean an average of $3.33 million — a substantial difference.
Here it’s worth mentioning that nobody who’s in the business of presenting WAR values, not FanGraphs or Baseball Reference or Baseball Prospectus, is comfortable with the idea of its estimates of performance values being deployed in the direct service of determining player salaries. As our own managing editor Meg Rowley said on a recent Effectively Wildpodcast:
“This assumes a precision to WAR that, I think people who think WAR is a really useful framework through which to understand baseball would be very quick to tell you, is not present. So what happens if you are the 31st-most valuable pre-arb player and the difference in value between you and the 30th-most valuable is less than half a win? You’re probably not the same, but you’re within our margin for error on this.”
Other elements of MLB’s proposal that ESPN highlighted pertained to service time manipulation, roster continuity, pre-draft physicals and a restoration of the draft-and-follow system. Via Rogers, “The league increased the incentive for teams to keep their best prospects in the majors, offering them two draft picks within the player’s first three years if he finishes in the top three in Cy Young, Rookie of the Year or MVP voting. Previously, the league had offered one extra draft pick per player within his first three years.”
The example Rogers offered was Kris Bryant; had the Cubs kept him up for all of 2015 instead of farming him out for the first 12 days of the season to [check notes] work on his defense — thus leaving him one day short of collecting a full year of service time — they’d have netted one pick for him winning that year’s Rookie of the Year award, and a second one for his MVP award in 2016.
On the subject of roster continuity, the CBA would limit the total number of times a player could be optioned to the minors in a season to five, which could make a significant difference in the quality of life for pitchers at the bottom of the bullpen food chain, the ones vulnerable to getting sent down if they’ve thrown so many pitches that they won’t be available for a day or two. To cite just a few extreme examples, the past year alone saw the Rays option Louis Head 12 times, with the Dodgers optioningMitch White 11 times, and likewise for the Yankees with regards to Albert Abreu.
On the subject of pre-draft physicals, in what could be called the Kumar Rocker rule (though, as is often the case for players expected to be drafted highly, the Vanderbilt pitcher did not submit to one), the league has proposed that a player who submits to one and is subsequently drafted will be guaranteed at least 75% of slot value and can’t be failed by the team in a post-draft physical. As for the draft-and-follow, the league has proposed reinstating the ability of team to draft a player who’s not yet ready for professional baseball and then sign him the next year. In this case, the team can draft such a player, send him to junior college for one year, and sign him for as much as $225,000 the next year.
For as helpful as those elements may or may not be, they’re of much smaller scale compared to the CBT, the minimum salary, and the structure of arbitration, regarding which “the league has said it won’t move off the status quo,” according to Rogers.
Even with the lack of progress and the players voicing their frustrations, it’s worth noting that the immediate asymmetry of the situation favors the union. Players don’t get paid for spring training, so they won’t feel the bite of missed games as suddenly as the owners will when their exhibition dates begin to dwindle. The owners obviously have much more ability to absorb the loss of games long-term than the players do, but given the empty ballparks of 2020 and the reduced attendance last year, their resolve may be tested more quickly than that of the union. The players appear galvanized and geared up for a stand via which they can regain some of the ground they’ve lost, and guarantee their rank and file significantly more security, financial and otherwise, than they currently enjoy.
Our story so far: At the end of every Hall of Fame election cycle, I have a set of spreadsheets that I update that help me track voting patterns and other long-term trends, as well as some demographics regarding any honorees. Because the 2021 election cycle yielded no honorees — BBWAA voters pitched a shutout, and the two Era Committee votes were postponed — I realized while going through this year’s post-election exercise that I had yet to reckon with the impact of Major League Baseball’s 2020 decision to recognize seven Negro Leagues that operated from 1920 to ’48 as major leagues. Not that I haven’t coveredvariousangles of that decision, particularly as they pertain to the Hall; just that my tools of the trade haven’t kept pace.
I concluded my previous installment with a timeline illustrating the number of active Hall of Famers per team per season, using the Hall’s definition of one game being enough to represent one season played. It’s a display that illustrates the saturation of the immediate pre-World War II era via a very generous Veterans Committee and the extent to which voters haven’t kept pace with the later waves of expansion.
As previously noted, the above version does not include the 28 Hall of Famers elected for their playing careers in the Negro Leagues, a few of whom (Willard Brown, Monte Irvin, and Satchel Paige) had stints in the American and/or National League once they integrated, but not the 10 years needed to wind up on a BBWAA ballot. Adding those players compresses the pre-war peak, quite noticeably:
The scales are the same on the two graphs, but the broad peak in the middle is lower, with the space in the 2.5–3.0 range nearly empty. I did away with the BBWAA/committee distinction on this one, because I can’t stack the values if the denominators are different; the white Hall of Famers are coming from one player pool that for the 1920–48 period was constant at 32 teams, and the Negro Leagues Hall of Famers are coming from another that for the period in question ranged between six and 19 teams.
(Note that I’ve counted every team, even though some were very short-lived, loosely affiliated, and/or lacking in data that’s up to the Seamheads/Baseball Reference standard. I did draw the line by excluding the 1933 Cleveland Giants, who have data for just Negro National League games on B-Ref; they were apparently the replacement for the Columbus Blue Birds, who dropped out, and all 10 of their players appeared with other teams in the league during the same year, so leaving them out seems appropriate. Within the 49 Negro League-seasons now counted as majors, there might be a few other such instances of teams that shouldn’t be double-counted for the purposes of this exercise, but that will require closer study.) Read the rest of this entry »
At the end of every Hall of Fame election cycle, I take an evening or two to sit down and perform what I call “The Ceremonial Updating of the Spreadsheets,” where I gather data from the ballot results so as to track long-term trends as well as some demographic information regarding any honorees. The dirty little secret is that there’s no ceremony involved except perhaps the cracking of a beer, but I’ve spent 20 years building these spreadsheets, which fuel my coverage and occasionally inspire new ideas, and I take satisfaction in maintaining them, even if they are messy around the margins. You have your tools of the trade, I have mine.
It struck me while preparing a post-election follow-up on S-JAWS (my experimental version of starting pitcher JAWS) that it would probably be worth sharing some of that information — bigger-picture stuff — with readers, as it has an influence on how I see the Hall of Fame and approach my coverage. While I make reference to that information during the election cycle, I don’t always find time to share it amid the crunch of candidate evaluations.
It further struck me that the last time I presented some of this data publicly, in my 2017 book The Cooperstown Casebook, Major League Baseball had not yet recognized seven Negro Leagues from 1920-48 as major leagues, and that thus my accounting and the terminology I used to describe it was due for an overhaul. Some of this remains a work in progress, specifically when it comes to JAWS; while Baseball Reference presents WAR, WAR7 (seven-year peak), and JAWS data in addition to WAR for players in the aforementioned Negro Leagues, those figures have not been incorporated into the positional standards because of the significantly shorter season lengths and the fact that several Hall of Famers have only the tail ends of their careers in the major Negro Leagues, having peaked long before 1920. Quite honestly I have not yet figured out a satisfactory way to get around this, but that’s a problem for another day. Read the rest of this entry »