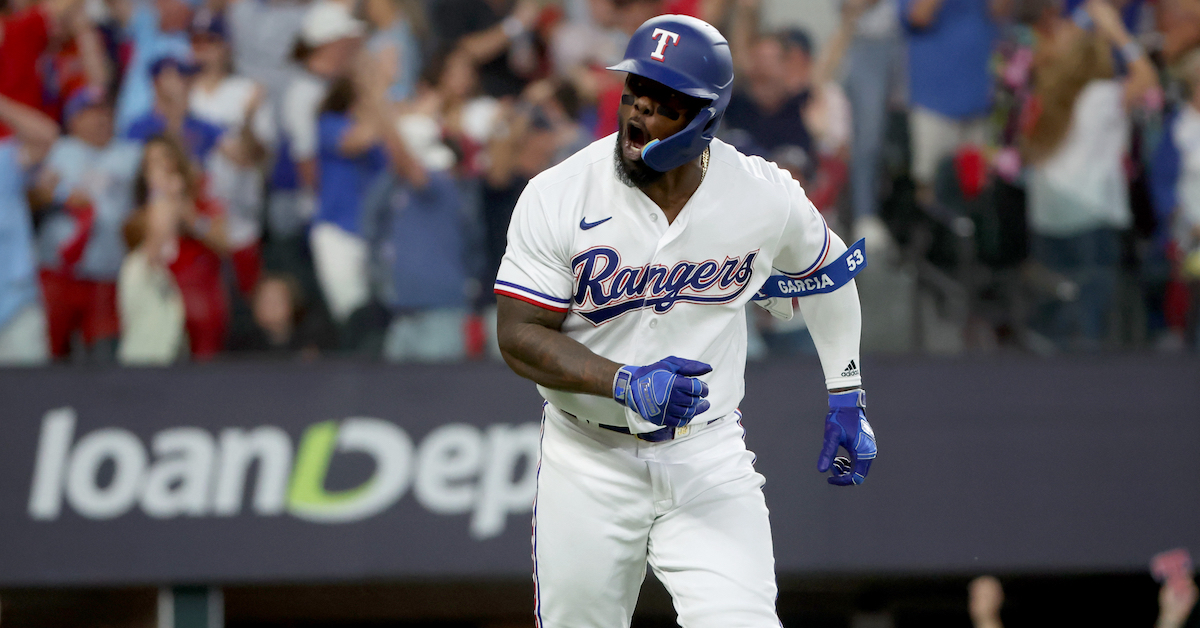
If you know a Mets fan, you’re probably familiar with the speech. The speech starts like this: “Francisco Lindor is the most underrated player in baseball.” The pronunciation is really important here. You have to pronounce the so that it rhymes with he, and you have to put a big long pause between under and rated. Those are the rules. From that starting point, the speech generally continues for somewhere between 30 seconds and six hours, touching on offense, defense, MLB Network rankings, and at least two versions of WAR. I’ve never been all that sure whether the speech was necessarily true. Lindor’s greatness has always struck me as impossible to ignore. As one of the game’s premier defenders, according to both the advanced metrics and the eye test, he’s always on the highlight reels. He’s received MVP votes in six different seasons and won two Gold Gloves, one Platinum Glove, and three Silver Sluggers. He’s just 30 years old, and he’s already got the 25th-best JAWS score among all shortstops. He’s still adding to his seven-year peak, too. When I started writing this article yesterday, he ranked 26th.
But maybe I’m part of the problem. Maybe while I’ve been taking it for granted that everyone knows about Lindor’s greatness, other people have actually been taking Lindor’s greatness for granted. That would be uncool. As such, this is your annualreminder of just how great Francisco Lindor is. Because we’ve done this before, we’ll take a different tack and focus on things Lindor hasn’t done.
Be an Average Hitter
Lindor is now in his 10th big league season, and he’s never once put up a wRC+ below 101. We’ve seen Lindor have a down year at the plate, but even at his worst, he’s still been an above-average hitter. He graced the pages of FanGraphs for the first time in 2012 in an article with a title that fit perfectly with the auspiciousness of the moment: Midwest League Prospect Update. In it, Mike Newman called Lindor “A gold glove shortstop in the making,” but also wrote, “Lindor may wind up being a bit BABIP dependent.” As it turns out, even in 2021, when Lindor’s BABIP fell all the way to .248, seventh lowest among all qualified players, he managed to be an above-average hitter. I don’t bring that up to rag on Mike. If you remember the beginning of Lindor’s career, you know that although he hit throughout the minors, the hype around his glove was understandably louder. But the consistency is remarkable, especially from a switch-hitter. His career wRC+ is 126 from the right side and 115 from the left side. He’s only put up a below-average wRC+ from either side of the plate twice: He had a 94 wRC+ from the right side in 2016, and a 96 mark in ’21. According to our database, there have been 549 primary shortstops who made at least a thousand plate appearances in the AL and NL since 1903. Lindor’s career 119 wRC+ ranks 19th.
This season, Lindor’s 125 wRC+ puts him on pace for his fifth career season above 120. Read the rest of this entry »
Welcome back to Top of the Order, where every Tuesday and Friday I’ll be starting your baseball day with some news, notes, and thoughts about the game we love.
Last week, I explained how players can still change teams even as trades are no longer allowed. Now that we’re a week-plus into August, I’d like to run down the list of players who could be placed on irrevocable waivers before the month ends, which is the latest that a team can claim them and still have them be eligible for the playoffs. Players placed on waivers are first offered to the worst team in the league, then to the other clubs in ascending order all the way up to the one with the best record at the time of the waiver placement.
I’ll be focusing on teams with playoff odds below 5%, though contending teams teams could see if a rival wants to bite on an onerous contract. (Spoiler alert: they will not.) As a reminder, when a player is claimed off waivers, it’s a straight claim. The team that loses the player gets nothing more than salary relief, as the new team is responsible for the remainder of the contract. Read the rest of this entry »
Josh Bell has only been a Diamondback for a little over a week, but in that short time, he’s made his presence felt. Acquired just ahead of the trade deadline in a deal with the Marlins, Bell stepped in for the injured Christian Walker and homered twice in his debut against the Pirates on August 2. On Wednesday he did it again, bashing two homers in the nightcap of a doubleheader against the Guardians in Cleveland. The Diamondbacks swept the pair of games, moving them into a tie for the National League Wild Card lead and into second in the rapidly tightening NL West race.
Indeed, the Padres aren’t the only NL West team that has gained traction in both races lately. With the sweep, the Diamondbacks have now won 18 of their last 23 games, a run that has rocketed them from two games below .500 to 11 games above while nearly tripling their odds of making the playoffs:
Diamondbacks Change in Playoff Odds
Date
W
L
W%
WC GB
Win Div
Clinch Bye
Clinch WC
Make Playoffs
Win WS
July 9
45
47
.489
2.5
1.6%
0.9%
25.5%
27.2%
1.4%
August 7
63
52
.548
+2
11.7%
10.1%
64.1%
75.8%
4.5%
Change
+10.1%
+9.2%
+38.6%
+48.6%
+3.1%
That 18-5 record is the majors’ best in that span, 2.5 games better than the Padres (14-6). The Diamondbacks have done it against a mix of good teams (the Braves, Guardians and Royals occupy playoff positions at this writing, and the Pirates have been right around .500) and not-so-good ones (the Blue Jays, Cubs, and Nationals). Not only are the Diamondbacks now tied with the Padres for the Wild Card lead, they’ve trimmed the Dodgers’ division lead to three games — as close as they’ve been since April 24 — which has really goosed their Playoff Odds. Read the rest of this entry »
Back in February, I wrote (and sang) about the electric debut of Edouard Julien, which featured excellent plate discipline and extreme platoon splits. The rookie second baseman ran a 136 wRC+ and put up 2.8 WAR in just 109 games, then hit even better in the postseason. Facing a steady diet of righties, Julien balanced out a precipitously high strikeout rate with an even better walk rate. He also balanced out roughly average raw power by hitting the ball hard consistently. This season, however, his strikeout rate has gone from high to untenable and his contact quality has taken a significant step back. Julien was sent down to Triple-A St. Paul to figure things out in June. Let’s take a look at what’s going on and how he might be able to fix it.
We should start by making it clear that Julien’s season, while disappointing, has not been disastrous by any means. He has a 93 wRC+, including a much improved 98 wRC+ against left-handed pitching (though once again it’s an extremely small sample size). He’s also improved his defense, and as a result, he’s put up 0.8 WAR over his 63 games with Minnesota. Prorated out over a full 162-game season, he’s right around league average at 2.1 WAR. Read the rest of this entry »
I’m sorry, assorted old people and grumps of the world. Michael Baumann got you all riled up yesterday by looking into whether clutch exists. It does! It’s inarguably a real thing. It’s also not very predictive, and even maybe not predictive at all. I know! It’s shocking (note: it’s not shocking). After reading that, I had no choice but to look into that other baseball truism: momentum.
There have been plentyofstudiesabout it. The findings are consistently uninteresting. It’s basically this: Momentum probably has some effect, but it’s minimal. You can slice it a ton of different ways and get some version of that conclusion, whether you’re talking about a big win helping the next day or a string of important games begetting more.
I thought I’d add to the literature with a different study. I can’t remember which game in particular, but I was watching some ball last week when a team tied the game in the bottom of the fifth or sixth. One announcer mentioned offhandedly that they were heading in the right direction and had the opposition right where they wanted them. This isn’t rare. If you watch baseball, you’ve heard some version of it for sure. I tuned out before the end of the game, so I can’t tell you whether they were right, but I made a note to look at it later.
That particular definition of momentum – rallying to tie the game in the bottom half of the inning – felt ripe for study. I grabbed game logs from every game played since 2000 to take a crack at finding this effect. I went through the score after every half inning and noted a few things. First, I noted the score differential. Next, I noted the change in differential since the last half inning. Finally, I checked who won the game in the end. That let me find whatever subset I wanted and study the difference between games that were tied when the half-inning began and the ones where the home team tied it up during that half-inning. Read the rest of this entry »
The other week, I was talking to a friend as she fretted over her lack of productivity. Her struggle wasn’t with laziness or a lack of motivation, but rather a severe case of burnout, following her around the way No-Face follows Chihiro in Spirited Away. In the moment, I could see her desperately reaching for more energy to get through the day, like when the chip bag is nearly empty, so you bring it to your mouth and tilt your head back to suck down whatever salty goodness remains.
But instead of encouraging her to power through, I went a different way.
“Y’know, it’s okay to take a break.”
She laughed and said, “That’s what my therapist keeps telling me.”
If you’ve ever described yourself as a perfectionist or a people pleaser, or tied your self-worth to your measurable output, you know taking breaks can be hard.
Athletes learn from the beginning to idolize hard work. Hard work is the salve for every ailment. Wanna get stronger? Work harder. Wanna play better? Work harder. Wanna go pro? Work harder than everyone else. The hardest workers earn their own dedicated titles and recognition, separate from their actual production. Cal Ripken Jr.’s consecutive games played streak earned him the Ironman title. MLB gives out a Heart and Hustle award to whichever player’s heart tells him to hustle the hardest. And every year, we read stories about players and coaches who are the first to arrive to work each morning and the last to leave at night. Read the rest of this entry »
The A’s have been a bummer of a team to follow for a few years now. They’re moving to Vegas. The fans are protesting, but probably fighting a losing battle. They’re going to play in Sacramento, in withering heat, at a (really nice!) minor league stadium. The owner’s a walking punchline. They lost 112 games last year and then made almost no moves over the winter.
Something’s been brewing in the East Bay, though. Not in terms of a surprise playoff contender – they’re 47-68 on the year, and their playoff odds hit 0.0% on June 10. But nonetheless, this is a much better team than last year’s edition, and it’s mostly happened thanks to internal improvements. This version of the A’s looks downright frisky. Last year, playing them was basically a bye series; this year, they’ve almost matched their win total from ’23 and we’re in early August. How’d they do it? In one word, variance. In many words, well, read on and find out. Read the rest of this entry »
This probably isn’t a problem for most people, but I’m plagued constantly by the memory of frustrating baseball arguments from days past. I probably get into these arguments more than most people, partially because of my (and I hope it doesn’t sound immodest to say this) vast knowledge of the sport, but mostly because I’ve lived most of my life in New Jersey, which his home to the most stubborn, tendentious people you’d ever have the misfortune of meeting.
One such argument took place probably close to 15 years ago, when I ruined what was supposed to be a relaxing Friday evening down the shore by getting into a shouting match over the issue of Alex Rodriguez vs. Derek Jeter. I preferred A-Rod, who would go on to finish his career with a slugging percentage more than 100 points higher than that of his Yankees teammate. I was arguing against someone whose case rested on Jeter being “more clutch.”
If you’re old enough to remember what “analytics bloggers” like me thought about that argument in the 2010s, you can understand my quickness to anger and probably imagine the colors my face turned. When the dust settled, Jeter — who, it turns out, was actually an exceptional hitter all along — did finish with a better career postseason wRC+ than A-Rod. But it was close: 121 to Jeter, 116 for Rodriguez. Read the rest of this entry »
With Spencer Strider and Ronald Acuña Jr. both out for the season, the Braves haven’t been anywhere close to full strength for awhile, and the injury bug has continued to bite, with Michael Harris II and Ozzie Albies sidelined for extended periods as well. In a dispiriting sequence involving the rotation, Max Fried returned from the injured list on Sunday (and was roughed up), then Reynaldo López landed on the IL. With so many absences, the cracks are beginning to show. Where the Braves occupied the top National League Wild Card spot for a good long time, they entered Tuesday having fallen into a three-way tie with the Diamondbacks and Padres.
The not-so-well-kept secret about the Braves is that since finishing April with a 19-9 record, they’ve gone just 41-42, and haven’t been more than a game over .500 in any calendar month. They went 13-14 in May, 14-13 in June, and 12-13 in July; so far, they’re 2-2 in August. Here’s how they now sit via the standings and our Playoff Odds:
The 2024 season started absolutely terribly for the White Sox. After 25 games, the team’s record stood at 3-22, thanks in large part to an anemic offense that barely scored two runs per game. At the time – the Sox were 3-21 when I wrote the piece – I posed the question of whether the White Sox had a real shot at losing 120 games. I concluded that it was possible, with ZiPS projecting an 8.1% chance that Chicago would lose 120 games, better odds than even the Oakland A’s during their brutal 2023 season. That appeared to be the end of the story, at least until July.
After the awful start, things got slightly sunnier for the Sox for awhile. They swept the Tampa Bay Rays, a team expected to be a contender, and over the next not-so-nice 69 games, they went 24-45. While a .348 winning percentage isn’t in the same zip code as competence, that’s a 56-win pace, a level of lousiness that is fairly commonplace for the worst teams in the league, not the stuff of legend. But as the trade deadline approached, things again turned grim.
The White Sox won the first game of a doubleheader against the Twins on July 10, improving their record to 27-67. That date, almost a month ago, was the last time the White Sox won a game. The team’s 21 straight losses ties them with the 1988 Orioles for the second-most consecutive losses in modern baseball history (since 1901), just two losses behind the biggest loser, the 1961 Philadelphia Phillies. In some sense, the current one might be the most impressive losing streak, simply because the differences between the best and worst teams in baseball has shrunk over the years, making streaks like this more challenging to achieve.
And no, the White Sox haven’t been unlucky. Using a modified Pythagorean winning percentage (I use 1.83 for the exponent rather than two, as it’s been slightly more accurate historically), the White Sox have been the fourth-worst team since 1901.
Worst Teams, Modified Pythagorean Win Percentage
Year
Team
W
L
Pct
Modified Pythag
1942
Philadelphia Phils
42
109
.278
.256
1916
Philadelphia Athletics
36
117
.235
.267
1909
Washington Nationals
42
110
.276
.269
2024
Chicago White Sox
27
88
.235
.272
1904
Washington Senators
38
113
.252
.275
1908
St. Louis Cardinals
49
105
.318
.278
1910
St. Louis Browns
47
107
.305
.286
1915
Philadelphia Athletics
43
109
.283
.290
1919
Philadelphia Athletics
36
104
.257
.292
1932
Boston Red Sox
43
111
.279
.293
1954
Philadelphia Athletics
51
103
.331
.294
1905
Brooklyn Superbas
48
104
.316
.299
1969
San Diego Padres
52
110
.321
.299
1906
Boston Nationals
49
102
.325
.300
1941
Philadelphia Phillies
43
111
.279
.301
1903
Washington Senators
43
94
.314
.302
2023
Oakland Athletics
50
112
.309
.302
1945
Philadelphia Phillies
46
108
.299
.303
1903
St. Louis Cardinals
43
94
.314
.304
2019
Detroit Tigers
47
114
.292
.304
If the season ended today, the White Sox would have the worst modified Pythagorean win percentage in more than 80 years, since the Philadelphia Phils in 1942. No, that’s not a typo; the Phillies officially shortened their team name for a season in 1942, apparently because they decided they didn’t want to have the same name as the line of cigars.
Problem is, the season doesn’t end today, so the Sox haven’t closed the deal yet. Regression toward the mean is a real thing, and one of the primary reasons why people overrate teams when things are going very well, and vice-versa. At the end of the day, a .235 winning percentage or the .272 in modified Pythag are likely – though not guaranteed – to go up over the remaining games. Projections represent a more stable description of a team’s ability, as well as one that’s generally more predictive of the future, and even with the diminished post-deadline roster, ZiPS sees the White Sox as “only” a .355 team, a 58-104 pace that represents merely a ho-hum level of awfulness.
But it’s also likely that given more games, these other terrible teams likely would have played better ball as well, for similar reasons. (Remember, Major League Baseball didn’t implement the current 162-game schedule until 1961.) While ZiPS projections date back to 2005, I have a quick little estimator for a team’s underlying ability that correlates fairly well with projections; it’s a mix of actual record, a team’s “wRC Pythagorean” — which uses wRC rather than runs score and allowed — and a model of regression toward .500. So I calculated the worst teams by this method and compared them to Chicago’s .356 estimate.
Estimate of Worst Teams (Since 1901)
Year
Team
W
L
Pct
Pythag
Team Strength
1915
Philadelphia Athletics
43
109
.283
.290
.328
1904
Washington Nationals
38
113
.252
.275
.340
1916
Philadelphia Athletics
36
117
.235
.267
.348
1910
St. Louis Browns
47
107
.305
.286
.354
1932
Boston Red Sox
43
111
.279
.293
.354
1952
Pittsburgh Pirates
42
112
.273
.312
.355
1909
Washington Nationals
42
110
.276
.269
.355
2024
Chicago White Sox
27
88
.235
.272
.356
1963
New York Mets
51
111
.315
.311
.357
1942
Philadelphia Phils
42
109
.278
.256
.357
1962
New York Mets
40
120
.250
.313
.359
2003
Detroit Tigers
43
119
.265
.305
.360
1945
Philadelphia Phillies
46
108
.299
.303
.360
1909
Boston Doves
45
108
.294
.305
.360
1919
Philadelphia Athletics
36
104
.257
.292
.361
1911
St. Louis Browns
45
107
.296
.341
.361
1920
Philadelphia Athletics
48
106
.312
.324
.361
1903
St. Louis Cardinals
43
94
.314
.304
.361
1939
St. Louis Browns
43
111
.279
.347
.365
1965
New York Mets
50
112
.309
.318
.365
Whew, the White Sox once again fall to satisfyingly hurlicious levels as the worst team since the 1952 Pirates. And the thing is that for the Sox, a .355 record is lousy enough that they stand an excellent chance at losing 120 games anyway with the number of losses they already have banked. With 47 games to play, a .355 record would net them only 16.7 wins, leaving them at just under a 44-118 record, tantalizingly close to the 1962 Mets standard. And since we know that projections aren’t perfect, or at least maybe reality isn’t, that gives the White Sox ample room to continue to underperform and take the grand prize. Luckily, ZiPS can take care of that estimate.
ZiPS Projected Wins Chicago White Sox
Percentile
Wins
99%
52.9
95%
50.2
90%
48.8
85%
47.8
80%
47.0
75%
46.3
70%
45.7
65%
45.1
60%
44.6
55%
44.1
50%
43.6
45%
43.1
40%
42.6
35%
42.1
30%
41.6
25%
41.0
20%
40.3
15%
39.6
10%
38.7
5%
37.4
1%
35.1
Even with things projected not to go quite as badly, ZiPS gives the White Sox a slightly better than one-in-three chance (34%) to lose 120 games. And it could get even worse, with a 1% projected shot of finishing with a 35-127 record (or worse). That is championship brutality right there. The amusing thing is that this probability could’ve been even higher, but the White Sox didn’t trade Garrett Crochet or Luis Robert Jr. at the deadline, leaving the team encumbered with an additional 2-3 wins. If I remove Crochet and Robert Jr. in favor of their likely sub-replacement replacements, ZiPS projects the Pale Hose to have a 66% chance of losing at least 120 games!
I’m not sure I’d go so far as to call it a silver lining, but hope remains even for the most woeful teams in baseball. The last team to make a serious late run at 120 losses, the 2003 Tigers, improved quickly in the following seasons and made it to the World Series just three years later. Those 1952 Pirates were in the middle of a full rebuild helmed by legendary general manager Branch Rickey, hired in ’51, and though health problems forced him to step down in ’55, the organization assembled many of the key players who were on the World Series-winning team in ’60. And let’s not forget that seven years after losing 120 games, the Mets won the 1969 World Series. White Sox owner Jerry Reinsdorf isn’t one to embrace change, but a disaster of epic proportions could, in theory, be the one thing that would prompt him to overhaul the organization. I wouldn’t say I’m terribly optimistic about this actually happening, but with an improved farm system – we now rank Chicago’s farm as the third best in baseball – and maybe a better front office assembled, the Sox could turn things around.
Whether the White Sox have a brighter future is something we’ll have to wait to find out. For now, enjoy these Sox as they reach new levels of ineptitude, because they may be the worst major league team you’ll ever see.