Brett Wisely flies under the radar in a Tampa Bay Rays farm system where it’s easy to get overlooked. A 15th-round pick in 2019 out of Gulf Coast State College, the 22-year-old infielder is coming off a first full professional season where he augmented a .301/.376/.503 slash line with 19 home runs and 31 stolen bases between Low-A Charleston and High-A Bowling Green. Despite those eye-opening numbers, Wisely is unranked — albeit within a deep, talent-laden minor-league system — by Baseball America (our own list is forthcoming).
His low-profile status dates back to the day he was drafted. A two-way player at Jacksonville’s Sandalwood High School, and again in junior college, Wisely wasn’t even sure that his phone would ring.
“I didn’t think I was going to go at all, really,” Wisely admitted late last season. “I was playing summer ball and planning to go to USF the following year. But then the call came, and I got all excited. It was an opportunity that I couldn’t pass up.”
It’s not as though the opportunity came out of the blue. Wisely had been in contact with Tampa Bay’s area scout, and he’d filled out pre-draft questionnaires for “four or five teams,” the Boston Red Sox and Chicago White Sox included. The interest shown by the Rays differed from the others.
“They were the only one for hitting,” Wisely explained. “Everything else was for pitching. The other teams preferred my arm over my bat.” Read the rest of this entry »
On October 1, in the 160th game of the Los Angeles Dodgers’ 2021 season, Clayton Kershaw faced 10 Milwaukee Brewers batters and recorded just five outs. He didn’t look right, and it would soon be revealed that he was experiencing left forearm discomfort. Three weeks later, the Dodgers watched from the dugout as the Atlanta Braves celebrated winning the National League pennant. It marked the conclusion of a disappointing postseason run that did not feature an appearance from Los Angeles’ rotation stalwart.
The public speculation about his future began. Was that the last time we would see Kershaw in Dodger blue? Would the proud Texan and dedicated family man decide to spend the latter part of his career with his hometown Rangers? As it turns out, the answer to both of those questions was “no.” On Friday afternoon, the pitcher signed a one-year deal to return to the only team he’s ever known, per Ken Rosenthal of The Athletic. He’ll receive a base salary of $17 million, with incentives that could get him closer to the $20 million-plus AAV most projected for him. Read the rest of this entry »
After the end of the owners’ lockout on Thursday and the reopening of the offseason, the Giants wasted little time making a big splash in the second free agency period, signingCarlos Rodón to a two-year deal worth up to $44 million with an opt-out after the first season. The addition of the ex-White Sox lefty gives San Francisco the top-end talent that was missing from the rotation after the departure of Kevin Gausman earlier in the offseason. It’s a move filled with risk, but with the potential for great reward.
Rodón was a revelation in 2021. He threw a nearly perfect game on April 14, settling for a no-hitter instead; made the All-Star team for the first time; and set career highs in nearly every meaningful pitching metric, with his 2.37 ERA, 2.65 FIP and 4.9 WAR all leading Chicago’s pitching staff. And all this came after the White Sox had non-tendered him before the season, only to re-sign him on a one-year deal worth just $3 million.
As Rodón put it last March, getting cut by the team that had drafted him was a wake-up call. He committed to an improved offseason training program and diet to help him get into better shape, and the transformation of his body helped him fix his mechanics and improve his overall strength. He entered spring training throwing in the upper 90s regularly, and his fastball wound up averaging 95.4 mph last year, the hardest it had been in his career. All that additional velocity took his fastball from an average pitch to an elite weapon. His heater’s whiff rate had never topped 20% in his career but jumped to 29.7% in 2021, and opposing batters managed just a .264 wOBA off the pitch. It also paired nicely with his already excellent slider and changeup to form a trio of plus pitches to mow down opposing batters. Read the rest of this entry »
The Royals have a wave of strong position player prospects that look like they’re ready to make their debuts as early as 2022, led by the No. 2 player on our Top 100 list, Bobby Witt Jr., as well as MJ Melendez, Nick Pratto, and Vinnie Pasquantino. All four of those players carry a 50 FV or higher and could form a formidable young core in Kansas City for years to come.
Amidst all the hype over those four prospects, it would be understandable if you forgot about Kyle Isbel, who turned a fantastic spring training last year into a starting role in the Royals’ Opening Day lineup. While he didn’t have the prospect ceiling of Witt or the rest of that quartet, he did rank fifth on the 2021 edition of Kansas City’s prospect list with a 45 FV. But after starting off his major league career with five hits in his first two games, Isbel collected just four more across ten more appearances and was optioned down to Triple-A on April 22.
A rookie with a strong spring and a flash-in-the-pan debut who struggles to follow up on his early success isn’t an uncommon storyline, and it’s not surprising given Isbel’s lack of experience. A 2018 draftee out of UNLV, he had only played in just 123 minor league games and only reached High-A before making his debut. The canceled 2020 minor league season had a huge impact on that lack of experience, though he did play at the Royals’ alternate site.
Isbel’s first taste of Triple-A didn’t exactly go well either, as he struggled to a .220/.316/.360 line and a 84 wRC+ through his first 50 games there. But he managed to acclimate and adjust: Over his next 55 games in Triple-A, he slashed .320/.399/.531 (148 wRC+), bopping nine home runs and walking in more than 10% of his plate appearances. His rediscovered production at the plate earned him a second stint in the majors; he was recalled on September 12 and he posted a 138 wRC+ across 16 games down the stretch. Read the rest of this entry »
The baseball season is back! Rejoice! No time for bad feelings – it’s a celebration, and we’re all invited. I don’t really think the rest of this article is something you have to read right now, but I’ll level with you: I had already done the research for it, and it’s worth writing about, so before we descend into a non-stop festival of free agent signings and trades, you’re getting an article about a decision that the MLBPA won’t have to reckon with for a few months yet.
Before we got a merciful end to the CBA back-and-forth, a deal was proposed by MLB that would institute an international draft in exchange for eliminating the qualifying offer system. One detail of the reporting on this issue bugged me: at least one “industry source” gave an estimate for the value of the QO system that I found hard to believe:
1. It is difficult to know what dollar values the sides attach to the international draft or eliminating qualifying offer. Industry sources estimate QO to be worth $50m-$100m annually. Just because one side links two issues does not mean they are identically valued.
I don’t doubt Drellich’s reporting, but that number sounded wildly high to me. A single-digit group of players receive the qualifying offer each year; they’d have to be losing $10 million per player to make the math make sense. The draft picks that teams surrender to sign those players aren’t worth that much. The highest possible estimate for the cost of those picks comes in around $8 million per player, and that’s for teams with a luxury tax bill (or CBT, if you’re into acronyms).
To settle this question, I decided to look at all of the free agents who have received qualifying offers since the first year of the current QO system, the 2017-18 offseason. I’ve previously estimated what teams pay per WARin free agency, which gave me a useful database to start the investigation. Read the rest of this entry »
Brandon Walter hasn’t come out of nowhere, but he has come a long way. A 26th-round pick in 2019 out of the University of Delaware, the 25-year-old southpaw went into last season a veritable unknown, and he left it as the fastest riser in the Red Sox system. Displaying elite movement from a low arm slot, Walter fanned 132 batters and allowed just 67 hits in 89.1 innings, between Low-A Salem and High-A Greenville. He’ll enter the 2022 campaign ranked No. 10 on our newly-released Red Sox Top Prospects list.
Walter discussed his repertoire, and his unexpected emergence in a steadily-improving system, last month.
———
David Laurila: Your Baseball America writeup said, among other things, “His stuff and pitch data suggest reason to believe in a big ceiling.” What does that mean to you, particularly the reference to data?
Brandon Walter: “I’ve learned a lot over the last couple of years, especially since Chaim Bloom came into our organization. They’re big on analytics and pitch data [and] they’re preaching it to us. To me, it mostly means that my stuff is plus, so I can simplify and just throw it in the zone. I can make hitters deal with what I’m throwing instead of trying to hit corners and risk falling behind in the count. Basically, I can just try to get ahead with with my three pitches and compete that way. Getting that information and knowing that my stuff is above average allows me to just attack hitters.”
Laurila: Has the data reinforced things you kind of already knew, or has any of it actually come as a surprise? Read the rest of this entry »
While the discourse surrounding the details of a new CBA has largely focused on economic issues, Sunday offered a glimpse into its potential impact on the playing field. In their proposal that day, the MLBPA agreed to grant the commissioner the ability to implement a pitch clock, larger bases, and restrictions on the shift for the 2023 season with less offseason notice than previously allowed (45 days compared to a year), per Evan Drellich of The Athletic.
Though no element of the new CBA has been finalized, it does seem likely that the league will be free to experiment with rule changes, given little incentive on the players’ part to resist them when broader matters are at stake. Already, there’s been speculation about how they’ll impact the game, with much of it concerning the demise of the infield shift. On the fantasy side, articles have popped up analyzing which hitters would benefit. On the social media side, there have been memes — lots of them.
On the FanGraphs side — well, let’s give it a shot! It’s a few days overdue, but late is better than never. There’s no guarantee that the commissioner will outlaw infield shifts, but if he does, what happens? Will the game be nudged in the right direction, or will its supposed problems worsen instead? What do we want out of a plan to ban the shift, anyways?
A huge part of it isn’t related to any numbers, but rather aesthetics. Consider how baseball is both a symmetrical and stationary game. It’s true that team sports designate positions to players corresponding to offensive or defensive roles, but in most cases, they come with the freedom to mingle and roam about. In soccer, varying formations are regarded as tradition, not experimentation. In football, there are seemingly endless amounts of routes and passes for teams to implement. In hockey, they play hockey.
Baseball is different. For decades, fielders have remained loyal to their assigned districts, moving only to respond to an incoming ball; even then, they take caution so as not to disrupt an adjacent teammate. Fans, players, and coaches have long understood this. The shift, in this context, is an incongruity that evokes a feeling of discomfort. When a hitter sends a ball through a gap created by an infield shift, we tend to focus on the aberration (the shift) rather than the outcome (a base hit). Likewise, when a line drive is snared by a second baseman in right field, the same out appears unnatural. It’s no wonder numerous fans want the shift gone. It’s also no wonder that they attribute this disruption of baseball’s law and order to a myriad of issues. Read the rest of this entry »
Robert Van Scoyoc has diligently built a reputation as one of the best hitting coaches in the game. Hired by the Los Angeles Dodgers in November 2018 after first having served as a consultant (with a year spent as a hitting strategist with the Arizona Diamondbacks in between), the 36-year-old Santa Clarita, California native is respected both for his communication skills and his nuanced understanding of the craft. Well-versed in technology and modern-day concepts while still being an adherent of proven old-school practices, he honed his knowledge base working alongside longtime hitting instructor Craig Wallenbrock.
In the latest installment of our Talks Hitting series, Van Scoyoc addressed several philosophies and principles, including the importance of angles and the relationship between process and outcome.
———
David Laurila: Since coming to pro ball, the two titles you’ve held are “hitting strategist” and “hitting coach.” What’s the difference?
Robert Van Scoyoc: “In Arizona, the strategist role was more broad. I was involved in multiple departments, along with doing some of the major league advancing work. Being the hitting coach, my responsibilities are just with the major league team. That being said, we have a very collaborative organization where all three hitting coaches — me, Brant Brown, and Aaron Bates — are all working with [player development], and will even talk with amateur scouting and some of the guys watching our players. So my day-to-day responsibilities are with the major league staff, obviously, but with us being very collaborative, I’m involved with many different parts.”
After another 24 hours of intense negotiations, MLB’s lockout of the players remains in effect. Just like the last time negotiations ticked past a league-imposed deadline, MLB announced that they had canceled a week (two series) of games, postponing Opening Day until April 14. That brings the total number of weeks canceled to two and series to four, with the possibility of more to come should the two sides not reach a compromise in their negotiation of a new collective bargaining agreement.
It’s unclear whether these games will remain canceled, or whether some newly structured season will change the schedule. After all, the league canceled a week of games last week, then spent most of this week saying they would un-cancel them and play a full 162 if the two sides reached a deal by their new deadline. Plus, the length of the season, and the salaries and service time that go with it, is itself a matter of bargaining. But let’s take the league at their word and assume that we’re now looking at a 150-game season. Read the rest of this entry »
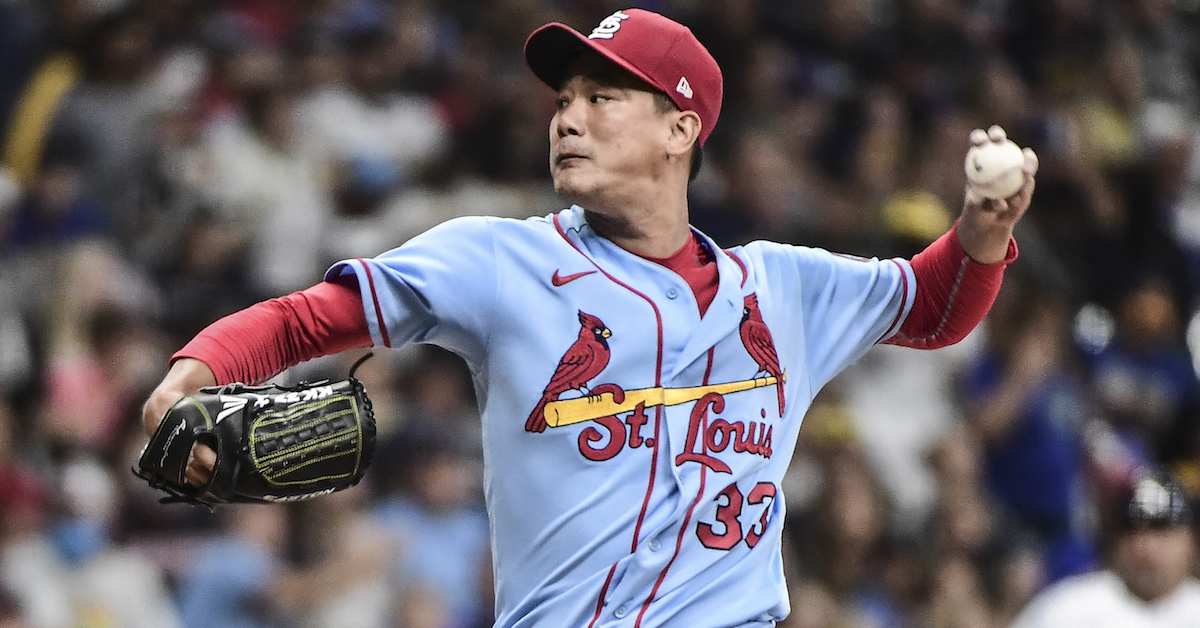
With no clear end in sight to the owner’s lockout, free agent Kwang Hyun Kim 김광현 has decided to return to Korea for the 2022 season. On Monday, Jeeho Yoo of Yonhap Newsreported that Kim has signed a four-year deal with the SSG Landers (previously the SK Wyverns). The deal is worth 15.1 billion won ($12.3 million dollars) and breaks the record for largest KBO contract that was previously held by Dae-Ho Lee 이대호 and Sung-bum Na 나성범. In a statement released by the Landers, Kim said, “I was able to challenge myself in the majors because of support from fans here. I decided I wanted to give back to them once I returned to the KBO. The Landers recognized my value with the biggest contract ever in the KBO — I didn’t have to think long and hard about the reunion.”
Kim returns to his old team in Incheon, a squad that has missed the playoffs both years since he made the jump to the major leagues after the 2019 season: They placed ninth in the 10 team league in 2020 but came up half a game short of qualifying for the Wild Card game in 2021. Kim solidifies a starting rotation that also includes former major league pitchers Iván Nova and Wilmer Font. Font led the Landers pitching staff with a 3.46 ERA and a 3.25 FIP, but the four pitchers in the rotation behind him all had ERAs and FIPs over five. With Kim back in the fold, the Landers are likely one of the preseason favorites heading into the regular season.
I asked former FanGraphs contributor Sung Min Kim for some additional context on Kwang Hyun Kim’s return to the KBO.
“Landers are now in a very good position, especially with their pitching staff. Not only do they get one of the better KBO pitchers back in their rotation, but they also bet highly on Wilmer Font, who pitched very well with them in ’21, and Iván Nova, and they also have two solid Korean-born starters in Jong Hoon Park and Seung Won Moon set to return mid-season from injuries. Those five pitchers would make up the best rotation in all of KBO, and make them instant pennant favorites for 2022. They will certainly be a very fun team to watch.”
Kim’s time in America was anything but easy. A club legend while playing for the Wyverns from 2007-19, he made the transition to the US prior to the 2020 season. Unfortunately, his introduction to the major leagues was interrupted by a global pandemic. The next season was a little more normal, but his two-year deal with the Cardinals expired at the end of 2021 and the 33-year-old again found himself in strange circumstances, with the owner’s lockout disrupting his foray into MLB free agency.
While pitching for St. Louis, Kim’s role was as settled as the circumstances around him these past two years. He began the 2020 season as the Cardinals closer, notching his first professional save in his first major league appearance. A COVID outbreak on the team forced him into the starting rotation soon after, and he made seven starts during the remainder of the abbreviated regular season with an additional start in the Cardinals Wild Card series against the Padres. He allowed just nine total runs to score against him in those eight regular season appearances, good for a 1.62 ERA.
Last year, two separate stints on the injured list limited Kim to 21 starts and six relief appearances. The second of those trips to the IL came in mid-August after the Cardinals had acquired J.A. Happ and Jon Lester to bolster their rotation for the stretch run. Kim returned after two weeks on the sidelines but had lost his spot in the rotation by then. He made two more starts through the end of the season but was mostly relegated to mop up duty in the bullpen over the last month of the season.
All told, he made 28 starts during his time with the Cardinals and seven additional relief appearances. He compiled 1.8 WAR with an excellent 2.97 ERA that outpaced a more middling 4.34 FIP. He never racked up big strikeout totals, instead relying on good command and a solid ability to limit hard contact. Just 25.6% of the plate appearances against him ended with a hard hit batted ball, right in line with the league average over the last two seasons. He allowed a 6.3% barrel rate during his time in the majors and just a .348 expected wOBA on contact.
On the pitcher’s decision to return to Korea, Sung Min Kim had this to say:
“I think he was always inclined to stay in the US and try to prolong his career in the US by signing with another team. He’s had a desire to challenge himself in the majors for a long while, even before he signed with the Cardinals. With his age and the decreased velocity he showed during his two seasons in St. Louis, I wasn’t sure what the market looked like for him, especially given that he was relegated to a bullpen role later in 2021. I think, with the lockout taking awhile, him missing his family being back in Korea, and definitely having a clearer role guaranteed back in KBO, it was very hard to say no to a lucrative deal to come back.”
Kim’s departure from the US creates an even bigger hole in the depleted free agent starting pitching market. Twelve of the 18 starters listed on our top 50 free agents list signed new deals prior to the lockout. That leaves very few options for teams looking to bolster their rotations once the offseason resumes. Kim was ranked 35th on that list of top free agents, ahead of Zack Greinke, Michael Pineda, and Yusei Kikuchi. Though he probably wasn’t likely to land a significant payday from an MLB club, he could have been a solid back-of-the-rotation option for a contending team that needs a bit more depth in their rotation. Those teams that might have been interested in Kim’s services are now limited to looking at starters like Pineda, Kikuchi, Tyler Anderson, and Garrett Richards.
This may also be the first instance of the ongoing owner’s lockout influencing a player to leave the US to find other opportunities abroad. Obviously, Kim returning to his home country to play for the same team he starred for previously is a unique circumstance, but the fact that there was no clear end to his free agent limbo in America had to have entered into his decision-making process when opting to return to Korea. Kim chose to leave behind the uncertainty of MLB for a record-setting KBO deal.
If negotiations between MLB and the Players Association continue to drag on, jeopardizing more and more of the regular season, it wouldn’t be surprising to see players consider signing with international leagues to give them some guarantee of earnings and playing time. Bryce Harper already joked about playing in Japan and Taiwan on his Instagram account:
It’s not hard to imagine a situation where MLB players start to seriously consider their options abroad if progress towards a new CBA deal hasn’t been made. Opening day in Korea is set for April 2, while the Nippon Professional Baseball season begins on March 25. That gives players an increasingly narrow window to make a decision. Established stars like Harper probably won’t be making the jump to Asia this year, but for players still mired in free agency or on the fringe of a major league roster and ineligible to play in minor leagues, a guaranteed paycheck and playing time in a foreign league could become increasingly enticing.