Archive for Daily Graphings

A Playoff Odds Check Supplement

Yesterday, I tested how well our playoff odds have predicted eventual playoff teams. Today, I’m going to slice the data a few more ways to get a more robust look at what our odds do well, and where they have fewer advantages over other models. It will be number- and picture-heavy, word-light. Without further ado, let’s get started.

A discussion with Tom Tango got me wondering about why our Depth Charts-based odds do so well early in the season relative to other systems. Their advantage is particularly strong at the beginning of the season and fades as the year goes on. For all charts in the article that are based on days into a season, I’ve excluded the 2020 season for obvious reasons. Here are the mean average errors for each of the three systems over the first 60 days of the season:

What’s driving that early outperformance? In essence, it comes down to one thing: the projection-based model is willing to give teams high or low probabilities of making the postseason right away. Our season-to-date stats mode is hesitant to do that, and the coin flip mode obviously can’t do it. Take a look at the percentage of teams that each system moves to the extremes of the distribution — either less than 5% or more than 95% to make the playoffs — by day of season:

Why does this matter? If you’re judging based on mean absolute error, making extreme predictions that turn out to be right is a huge tailwind. If you predict something as 50% likely, you’ll have an error of 0.5 no matter what. The further you predict from the center of the distribution, the more chance you have to reduce your error.

Of course, that only works if you get it right. If you simply randomly predicted either 5% or 95% chances without any information about the teams involved, you’d do just as poorly as predicting 50% for everything. Making extreme picks when you have information that suggests they’re likely to be right is the name of the game. Read the rest of this entry »


The Unsung Heroes of the Mariners’ September Surge

The Mariners are entering the final weekend of the regular season with their best shot since 2016 at breaking their infamous postseason drought, having gone 18–8 in September and won 11 of their last 13 games after losing a crucial series to the Red Sox mid-month. Earlier this morning, Jay Jaffe took a look at the bigger picture for the Mariners, their negative run differential, and the historic positive turn of their playoff odds. But this climb up the standings wouldn’t have been possible if it weren’t for some unheralded performances by a number of players on their roster.

From a season-long perspective, the Mariners’ offense has been lackluster, with a wRC+ of 94, ranking tenth in the American League. That went up to 103 in September, but the driving force behind the improved offense has been excellent performance in tight situations. Seattle has the most clutch offense in recorded MLB history (WPA records only go back to 1974), which goes a long way toward explaining the team’s 33–18 record in one-run games this year.

Clutch hitting can take a team far, but it’s not something that can be counted on every night. Luckily, the core of the Mariners’ lineup started hitting extremely well during the final month:

Mariners September Offensive Performers
Player PA BABIP ISO wRC+ Clutch WAR
J.P. Crawford 123 .340 .162 138 0.15 1.1
Mitch Haniger 117 .277 .288 139 0.16 0.7
Jarred Kelenic 106 .262 .295 135 0.64 0.7
Ty France 114 .338 .104 130 0.14 0.6
Luis Torrens 68 .412 .186 119 0.27 0.2
Kyle Seager 107 .224 .186 80 0.67 0.1

After shuffling through a number of early-season contributors, the lineup stabilized after the All-Star break — something that coincided with Kelenic’s second call-up from Triple-A after his rough debut in May. The hits didn’t start falling immediately after his return to the majors; from July 16 through the end of August, he posted a .181/.263/.315 line (a 65 wRC+) with a 30.5% strikeout rate. But something clicked once the calendar turned over to September, with Kelenic hitting .242/.321/.537, good for a 135 wRC+. His strikeout rate dropped to 25.5%, he launched seven home runs, and more than half of his hits went for extra bases.

Read the rest of this entry »


Team Entropy 2021: Dial M for Mariners

This is the fifth installment of this year’s Team Entropy series, my recurring look not only at the races for the remaining playoff spots but the potential for end-of-season chaos in the form of down-to-the-wire suspense and even tiebreakers. Ideally, we want more ties than the men’s department at Macy’s. If you’re new to this, please read the introduction here.

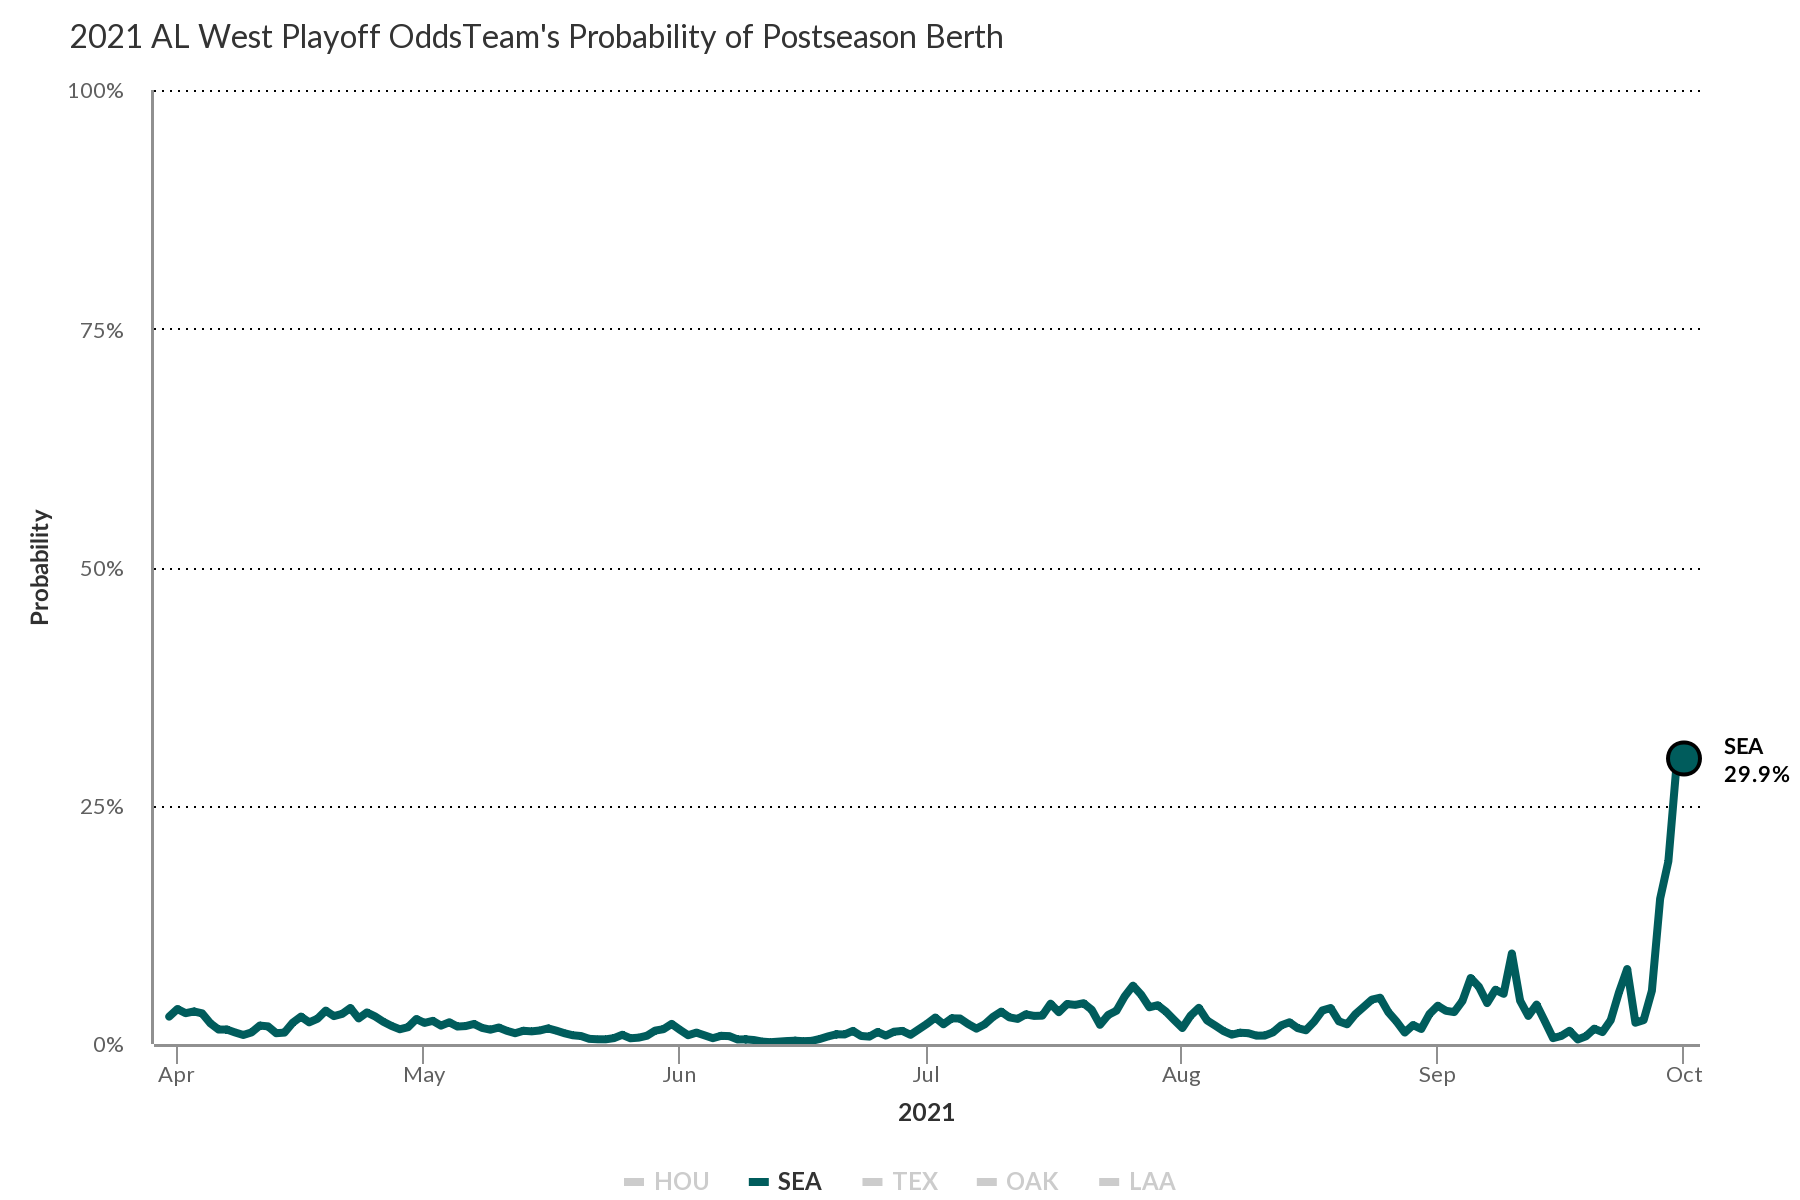
The Mariners haven’t reached the postseason since 2001, and all season long, our Playoff Odds have strongly suggested that their drought — the majors’ longest active one — will continue. But as we head into the final weekend of the 2021 season, they’re on a 10-1 tear that has interjected them right into the thick of an American League Wild Card race with a decided East Coast bias. With the Yankees sweeping the Red Sox in Boston and then taking two out of three from the Blue Jays in Toronto while the Red Sox somehow dropped two out of three to the Orioles in Baltimore, we now have four teams separated by three games from top to bottom, with just three to play for each:

AL Wild Card Standings Thru Sept. 30
Team W L Win% GB
Yankees 91 68 .572 +2
Red Sox 89 70 .560 —
Mariners 89 70 .560 —
Blue Jays 88 71 .553 1

This is not a drill! I’ll get to the mechanics of how this will be sorted out soon enough, but first, I’m taking the opportunity to spotlight the Mariners’ unlikely run and the trends they’re up against. This isn’t a dive into individual performances; elsewhere on FanGraphs today, Jake Mailhot has a closer look at what’s fueled their September run. Here I’m looking at the bigger picture. But first, an illustration of the Mariners’ Playoff Odds over the course of the season:

It’s been awhile since the Mariners were anywhere close to this position. While they went 89-73 just three years ago before slipping below .500 in both 2019 (68-94) and ’20 (27-33), that ’18 squad fell eight games short in the AL Wild Card race and finished 14 games behind the Astros in the AL West race. They did finish three games back in the AL Wild Card race in 2016, going 86-76 while both the Orioles and Blue Jays went 89-73, but they were a distant nine games behind the Rangers in the AL West. Not since 2003, when they went 93-69 in Lou Piniella’s final year at the helm, have they come as close by both routes to the postseason; that year, they finished three games behind the A’s in the division race and two behind the Red Sox in the AL Wild Card. And not since that 2001 team set a modern record with 116 wins have they qualified for the playoffs. Read the rest of this entry »


The Brewers’ Devin Williams Has Punched Himself Out of the Postseason

The Brewers clinched the NL Central title on Sunday, becoming the third team to wrap up their division after the Rays and White Sox. The occasion was certainly cause for celebration, but one key player took things too far. Devin Williams, the team’s top setup man, fractured his right hand — his pitching hand, that is — punching a wall and will require surgery that could keep him out through at least the National League Championship Series and perhaps longer.

Renowned for his Airbender changeup, one of the game’s most effective and unhittable pitches, Williams won NL Rookie of the Year honors and Trevor Hoffman National League Reliever of the Year honors in 2020 while posting a 0.33 ERA and 0.86 FIP in 27 innings. A bout of right shoulder soreness, later diagnosed as a rotator cuff strain, kept him off the Brewers’ roster during last year’s Wild Card Series, during which the team was swept in two games by the Dodgers.

Though he did not require surgery, Williams was brought along slowly in the spring, and scuffled early in the season. He missed 10 days in July due to right elbow discomfort and was limited to five appearances in September due to a right calf injury but still posted a 2.50 ERA and 2.81 FIP in 54 innings. Read the rest of this entry »


Kansas City’s Kris Bubic on the Art of the Changeup

Kris Bubic leans heavily on his changeup. The 24-year-old Kansas City Royals left-hander has gone to his signature pitch 30.9% of the time this year, the fourth highest percentage among hurlers with at least 120 innings. Low velocity and low spin are two of its attributes. Bubic — a Stanford product whom the Royals drafted 40th overall in 2018 — throws his change-of-pace 80 mph on average, with a 1,602 rpm spin rate.

———

Kris Bubic: “At the end of Little League, around 13 [years old], I had a club coach — his name was Erick Raich — and I tried to throw a changeup. At that point you’re not really developed enough to throw a breaking ball, at least not in my opinion. Your hand speed isn’t there, and the ball is bigger than your hand, so it’s tough to hold it and whatnot. Even a changeup. But the changeup was the first off-speed pitch I learned, and he showed me a standard circle grip. I threw a four-seam fastball, and [the changeup] was just a four-seam circle. It was pretty simple.

“As I developed it, I would play catch with it constantly, at 90 feet, at 120 feet, just to get the feel for it. I’d feel myself releasing it out front to get that good extension. But I think the separator for me… there are two things, actually. One is the velocity difference I’m able to create off my fastball. Two is that it essentially spins the same. There is variability with changeups — some have sidespin, some guys have split grips and whatnot — but mine essentially spins the same as my fastball. The axis is a little tilted toward more sidespin, but not enough that you can really tell from the eye. Read the rest of this entry »


How Well Do Our Playoff Odds Work?

It’s the time of year when folks doubt the playoff odds. With the St. Louis Cardinals going from 71-69 long-shots to postseason clinchers, and the rollercoaster that is the American League Wild Card race, you’ve probably heard the skeptics’ refrains. “You had the Jays at 5%, and now you have them at 50%. Why did you hate them so much?” Or, hey, this tongue-in-cheek interview response that mainly makes me happy Adam Wainwright reads our site:

In that generic statement’s defense, it really does feel that way. In your head, 5% rounds to impossible. When the odds say “impossible” and then the season progresses to a point where outcomes are far less certain, what other impression can you take away than “these odds were wrong”?

I feel the same way from time to time. Just this year, the Cardinals and Blue Jays have been written off and then exploded back into contention. St. Louis bottomed out at 1.3% odds to make the playoffs – in August! It’s not quite negative 400 percent, but it sure feels that way. Can it really be that those odds were accurate, and that we just witnessed a one-in-100 event?

To investigate this question, I did what I often do when I don’t know where to turn: I bothered Sean Dolinar. More specifically, I got a copy of our playoff odds on every day since 2014, the first year when we calculated them using our current method. I left out 2021, as we don’t have a full season of data to use yet, but that still left me with a robust (some would say too robust) amount of data. Read the rest of this entry »


Joey Gallo Approaches a Dubious Record (While Remaining Good)

As we enter the final few days of the regular season, our collective attention is fixed on the push for the few remaining playoffs spots, including the race for the American League Wild Card. Three East division clubs — the Yankees, Red Sox and Blue Jays — are competing for a shot at playing in the coin flip game, with the Mariners still clinging to a puncher’s chance that seems to grow by the day. All of the focus is on those teams’ games and the standings, as it should be, but as the Yankees take the field, something is quietly happening in the record books as well.

Enter Joey Gallo, one of the more inimitable talents in the game. There is no question that Gallo is a valuable player. Even with his struggles since being traded to New York at the end of July, his on-base skills and tremendous strength have him on the brink of a four-win season. But his is a profile of extremes. In the world of video games, particularly RPGs or any game in which you build a character with skill or attribute points, there is the concept of min-maxing a character. To min-max is to put all of one’s skill points in a small number of categories while ignoring the others. Gallo is the ultimate min-max character in that all of his offensive skill points have been put into two categories: power and patience. Read the rest of this entry »


Kyle Tucker Is Hitting Seventh and That’s Fine

Kyle Tucker has evolved into the elite hitter the Astros and scouts believed he could be. The outfielder, who graduated from prospect status in 2019 with a 60 Future Value grade and ranked 10th on our top 100 that preseason, is slashing a robust .290/.355/.548 in 548 plate appearances, good for a 144 wRC+ — tops on the team — and 4.5 WAR. David Adler of MLB.com recently wrote about how good Tucker has been this season, but I want to focus on how he’s being used, and whether the Astros are giving away an advantage with where they’re hitting him.

The Astros are dealing with injuries, as they have all season, with Michael Brantley the latest regular to land on the injured list. As such, the last game in which they had all of their starters in the lineup was on September 11, and it looked like this:

Read the rest of this entry »


The Fascinating and Still Unsettled NL MVP Race

With five days remaining in the 2021 regular season, it’s abundantly clear that there won’t be much clarity offered in the National League Most Valuable Player race. Yes, Bryce Harper’s Phillies still have a mathematical shot at a postseason spot per our Playoff Odds, unlike Fernando Tatis Jr.’s Padres and Juan Soto’s Nationals, but not everybody is of the belief that an MVP needs to hail from a postseason-bound team or even a contender.

From a practical standpoint, it’s usually the case that an MVP does hail from such a team; in the Wild Card era (1995 onward), 42 of 52 (80.8%) have done so. The tendency shows an upward trend, the degree of which depends upon where one sets the cutoff. For example, three out of 18 MVPs from 1995-2003 missed the postseason, and likewise three of 18 from 2004-12, but four of 16 from 2013 onward; it’s just as accurate to say that from 1995-2004, four of 20 missed the playoffs, dipping to two of 20 from 2005-14 and then four of 12 since. Either way, all-time greats Larry Walker (1997), Barry Bonds (2001 and ’04), Albert Pujols (2008), Alex Rodriguez (2003) and Mike Trout (2016 and ’19) account for the vast majority of those exceptions, with Ryan Howard (2006), Harper (2015), and Giancarlo Stanton (2017) rounding out the group. That Rodriguez, Stanton, and Trout have doubled the all-time total of MVPs who have won while hailing from sub-.500 teams — a list that previously included only Ernie Banks (1958 and ’59), Andre Dawson (1987), and Cal Ripken Jr. (1991) — is perhaps the more notable trend, with Shohei Ohtani likely to increase that count this year. Effectively, that’s a green light for Soto’s late entry into the race, and also worth pointing out with regards to Tatis, as the Padres slipped to 78-79 with Tuesday night’s loss to the Dodgers.

From a practical standpoint, it’s also true that the notion of value is extensively tied to the things that can be measured via Wins Above Replacement. As old friend Eno Sarris noted at The Athletic (in an article on the value of Ohtani’s roster spot that’s well worth a read), in the past 14 years, only two MVP winners were not in their league’s top three by FanGraphs’ WAR, namely Jimmy Rollins in 2007, and Justin Verlander in ’11. Read the rest of this entry »


Ryan Mountcastle Talks Hitting

Ryan Mountcastle has a relatively straightforward approach to hitting. To say that it works for him would be stating the obvious. Since debuting with the Baltimore Orioles in late August of last year, the 24-year-old first baseman/outfielder has gone deep 37 times in 706 plate appearances. There are admittedly swing-and-miss issues — Mountcastle’s 26.1 K% is less than ideal — but his .273/.326/.492 slash line and 118 wRC+ are rock solid for a player with barely more than a full season under his belt. Power is Mountcastle’s calling card. Earlier this month, the former first-round pick set an Orioles rookie record for home runs in a season when he left the yard for the 29th time. He’s since added three more.

Mountcastle talked hitting on a recent visit to Fenway Park.

———

David Laurila: Let’s start with one of my favorite ice-breaker questions: Do you view hitting as more of an art, or as more of a science?

Ryan Mountcastle: “Man, that’s tough. I would say more of an art. Everybody’s got their own swing, and everybody’s got their own mindset when it comes to hitting. So I think it’s more of an art for each person, how they picture it in their minds.” Read the rest of this entry »