Archive for Essential

2017 MLB Arbitration Visualization

It’s that time of year again! This past Friday was the filing deadline for arbitration-eligible player contract offers. Once these numbers are published, I like to create a data visualization showing the difference between the team and player contract filings. (See the 2016 version here.) If you are unfamiliar with the arbitration process here’s the quick explanation from last year:

Teams and players file salary figures for one-year contracts, then an arbitration panel awards the player either with the contract offered by the team or the contract for which the player filed. More details of the arbitration process can be found here. Most players will sign a contract before numbers are exchanged or before the hearing, so only a handful of players actually go through the entire arbitration process each year.

The compiled team and player contract-filings data used in the graph can be found at MLB Trade Rumors.

Three colored dots represent a different type of signing: yellow represents a mutually-agreed contract signed to avoid arbitration, red represents the award of the team’s offer in arbitration, and blue represents the award of the player’s offer. A gray line represents the difference in player and team filings. Only players with whom teams exchanged numbers on January 13, 2017 will have grey lines. These can be filtered by clicking the “Filed” button.

The “Signed” button filters out players who have signed a contract for 2017; this will change as arbitration hearings occur. Finally, “All” includes every player represented in the graph. This year Jake Arrieta and Bryce Harper had the two largest contracts ($15.367M and $13.625M, respectively), but they both signed contracts before the filing deadline. This causes changes on the x-axis scale on the “Signed” and “All” tabs compared to the “Filed” tab, which is scaled to contracts under $10M.

The chart is sorted either by contract value or by the midpoint of the arbitration filings. The midpoint is the average of the two contracts and determines which contract the arbitrator awards based on his assessment of the relevant player’s value. The final contract value takes precedent over the midpoint since this represents the resolved value. Contract extension details will be written out over the data points. For our purposes, an extension is a multiyear deal that can’t be shown on the graph, since we are looking only single-year contracts for 2017.

Read the rest of this entry »


2017 FAN Projections!

The 2017 FAN Projection ballots are now open!

Before you can project any players, you’ll have to select the team you follow most closely towards the top of the screen. If you really don’t follow a team, just pick one. You’ll only have to do this once.

After you’ve selected a team, there are 9 categories for pitchers and 10 categories for position players. Pick the values in the drop-down boxes closest to what you think the player will do in 2017, hit the submit button and you’re done! If you made a mistake, you can always go back and change your selection at any time.

Please note that everything this year is a rate stat. You’re projecting 2B+3B, HR, SB, and Fielding as a measure of 150 games (basically a full season). The player’s previous stats are shown per 150 games in the projection ballot too. This will make changing playing time projections much easier as you’ll only have to change the games played portion.

That’s really all there is to it. You can filter players by team, or if you go to the player pages, you can project players individually. If you want to see all the players you’ve projected, you can click on the “My Rankings” button which will show you only what you specifically projected a player to do.

Fan Projections will show up on the player pages after there have been 5 ballots submitted.

If you do notice any issues, please let us know.


2017 FanGraphs Chat Schedule

With the new year, you’ve probably noticed a few new things around here. For one, you can now help support the site with an ad-free membership, which is a pretty neat thing for both you and us. If you’re a heavy user of the site, it’s a great way to keep us in business but also make your FanGraphs experience more enjoyable.

And supporting us allows us to do things like hire Travis Sawchik, who made his debut as a staff writer last week, and has already made himself an integral part of the staff with pieces like the one he wrote this morning on home-field advantage. We’re really excited to have Travis here, and think he’s going to help make 2017 a great year for FanGraphs.

And we want you guys to get to know him better as well, so starting today, Travis is going to be taking over the Monday chat, and will be answering your questions starting at 12pm ET.

But don’t worry, fans of the Dan Szymborski chat; he’s not going away, he’s just moving. Dan will now be chatting on Wednesdays at 2pm ET, which should also lead to more Dan Szymborski chats, since there are fewer Wednesday holidays, so if you enjoy the Szymborski chat, you’ll probably have more of them in 2017.

So, that leaves us with the following chat schedule for 2017. All times listed are in eastern time.

Monday, 12 pm: Travis Sawchik
Tuesday, 12 pm: Eric Longenhagen
Tuesday, 9 pm: Paul Swydan and Jeff Zimmerman
Wednesday: 12 pm: Dave Cameron
Wednesday, 2 pm: Dan Szymborski
Thursday, 12 pm: Eno Sarris
Friday, 12 pm: Jeff Sullivan
Friday, 3 pm: Paul Sporer (RotoGraphs chat)

We hope you enjoy the chats, and we look forward to talking with you all this coming year.


Introducing Ad Free Membership

Today we’re introducing a new form of FanGraphs Membership: Ad Free Membership. With Ad Free Membership, you become a full-fledged member of the site and you will not see a single third-party advertisement on the FanGraphs website so long as you maintain your membership. The price of Ad Free Membership is $50 per year.

If you are already a FanGraphs Member, you’ll be able to easily upgrade your membership at a pro-rated rate, depending on how much time you have left before your renewal date. Just select the new “Ad Free Yearly Membership” and hit the Sign Up Now button.

To give everyone a sense for what Ad Free Membership looks like, we’re going to put the site into Ad Free mode for all users through Monday. We hope you’ll like what you see. I know for the few of us who have been beta testing the product, we can attest that it really does make a noticeable difference in both the speed and responsiveness of the site.

Let me give you some details on why we’ve decided to do this. Earlier this year we introduced FanGraphs Membership, and we are incredibly thankful for everyone who has decided to become a member thus far! FanGraphs Membership is a way for you to help fund the site’s current operations and its future growth. If you think we’re doing a good job and you’d like to support our efforts, it’s a great way to show your support.

However, even with FanGraphs Membership, the majority of our revenue comes from advertising. Without advertising, there is no way the site could continue to operate. This has become a bit of a double-edged sword for us. As online advertising technology has advanced, it has also become more resource intensive, taking up both processing power and bandwidth. While there are movements within the online advertising industry to combat advertising bloat, we want to give our users a way to avoid ads completely, without cutting off the revenue stream which is essential for FanGraphs to operate. Ad Free Membership does exactly that.

We rely on various advertising networks to provide ads to us, and we do our best to vet all of these networks to make sure they’re not serving intrusive or malicious ads. But, even the most diligent ad networks have intrusive ads that slip through the cracks. Tracking down intrusive ads has more or less become a game of whack-a-mole for us over the past few years. Intrusive ads annoy us just as much as they annoy you, and we are constantly trying to make sure the advertising experience on FanGraphs is acceptable.

We will remain completely committed to having a non-intrusive advertising experience for those who would prefer not to become Ad Free Members.

It would be disingenuous of me to not mention ad-blocking. Ad-blocking is a real problem for us, but we also understand the many reasons people decide to install ad-blockers. If you are using an ad-blocker and you regularly visit FanGraphs, I urge you to become an Ad Free Member. There is now a real option for you that will help us continue to bring you high quality baseball content, without ads.

As we’ve stated before in our previous membership posts, Ad Free Membership, or any type of FanGraphs Membership is not a paywall. Whether you decide to be a member or not, all the content on FanGraphs remains available to you. We are incredibly thankful to the entire FanGraphs community for supporting us over the years and hope that we can continue to earn your support going forward.


Our Most Popular Pieces of 2016

Every year, we run lots of pieces here in the FanGraphs family of blogs. We take a look at the “best” of them each week, but that’s fairly subjective, and there’s also an effort to spread the love, since a true “best of” post would just be 10-15 articles by Jeff Sullivan every week, and that wouldn’t be an entertaining exercise. Not even for Jeff.

This article is something we try to do every year, though sometimes I forget. This is all about the numbers — which posts were the most popular? We’ll do an overall top 15, since we do 15 posts for the “best of” post, with some honorable mentions as well. We’ll start at No. 15, because if nothing else, I want to make you scroll you down the page a little. Just in case it’s not clear, this top-15 list is going to be limited to pieces which were posted in 2016.

No. 15 (Mar. 29)
Let’s Find Rusney Castillo a New Home, by Dave Cameron
Sadly, Rusney Castillo did not find a new home, though he did hit better in the second half in Triple-A. I’m still not ready to give up on him, but Boston’s outfield is beyond crowded, so this story might not have a happy ending.

Read the rest of this entry »


Splits Leaderboards!

Here it is: the split leaderboards! Now, you can create custom splits using multiple splits, much like you can on the player pages — except now in the form of an entire leaderboard, and accessible directly from the leaderboard menu.

splits-leaderboards-full

Read the rest of this entry »


Filtering Options Have Been Added to the Splits Tool

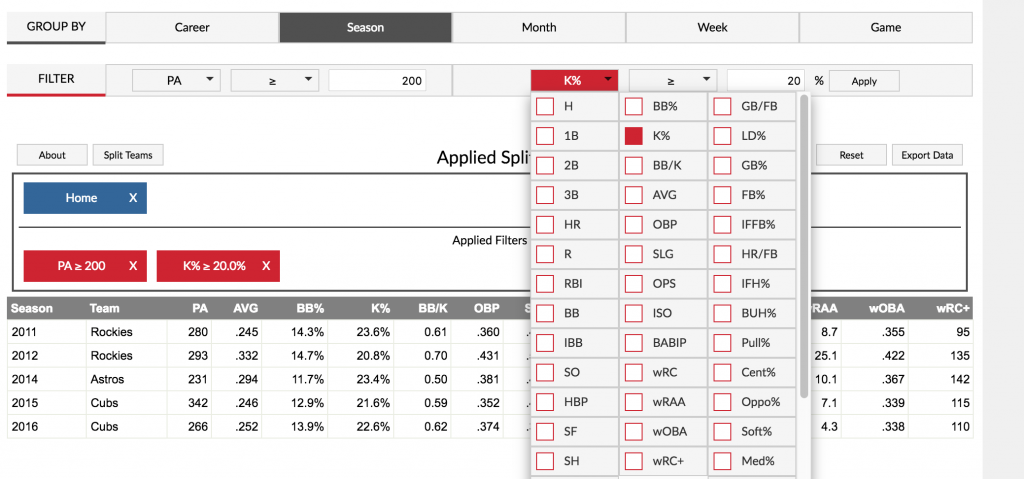
This past season we debuted our custom splits tool for players, and over the weekend, we updated the tool to include filtering options. These filtering options allow you to remove the lines of stats which don’t meet a specific criteria.

splits-tool

For example, if you wanted to view only those seasons in which Dexter Fowler recorded more than 200 plate appearances at home, you can add a filter for that. You could also add a filter to see the seasons where Fowler had over a 20% strikeout rate on those splits. This filter also works if you group by months, weeks and games, so, for example, you could return all the games in which a player had three or more hits. Filters act like the splits in that they can be combined and customized.

Read the rest of this entry »


A Long-Needed Update on Reliability

It’s been over a year now since Sean Dolinar and I published our article(s) on reliability and uncertainty in baseball stats. When we wrote that, we had the intention of running reliability numbers for even more statistics, including pitching statistics, of which we had included none.

That didn’t happen. So a little while ago, when I was practicing honing my Python skills by rewriting our code in, well, Python (it was originally in R), I figured, “Hey, why not go back and do this for a bunch more stats?” That did happen. Sean was/is swamped making the site infinitely better, though, so I was on my own rewriting the code.

In case you need a refresher, never read our original article, and/or don’t want to now, here’s a quick description of reliability and uncertainty: reliability is a coefficient between 0 and 1 that gives a sense of the consistency of a statistic. A higher reliability means that there’s less uncertainty in the measurement. Reliability will go up with a larger sample size, so the reliability for strikeout rate after 100 plate appearances is going to be much lower than the reliability for strikeout rate at 600. Reliability also changes depending on which stat is being measured. Since strikeout rate is obviously a more talent-based stat than hit-by-pitch rate (well, maybe not for everybody), the reliability is going to be higher for strikeouts given two identical samples. You can think of it like strikeouts “stabilize” quicker than hit-by-pitches.

Reliability can be used to regress a player’s stats to the mean and then to create error bars around that, giving a confidence interval of the player’s true talent. To continue with the strikeout example, I’ll add another point — namely that, the more plate appearances a player has recorded, the closer the estimate of his true talent will be to the strikeout rate he’s running at the time. In fact, strikeout rate is so reliable that, after a full season’s worth of plate appearances, a player’s strikeout rate will probably be almost exactly reflective of his true talent. The same cannot be said for many other stats, like line drive rate, which is mostly random; the reliability for LD% never gets very high, even after a full season’s worth of batted balls.

Read the rest of this entry »


FanGraphs on Facebook Live

Live from wherever we live: it’s FanGraphs Live (on Facebook)!

New to our chat lineup will be video chats via Facebook Live. Various writers will pop our Facebook page to recap or preview games, answer your question or talk about events with which we’re involved in video form. Want to ask a question? Just comment on the video and we’ll see it.

Hang tight with us as we work out some the kinks in the system. As we get going, we might run into some technology struggles, such as not being able to see the comments. Dave Cameron and Jeff Sullivan figured that one out last time though while on the road!

Lead prospect analyst Eric Longenhagen will pop in to give updates and thoughts on various players he’s seen recently, as well.

Keep an eye on our Twitter for alerts on when we’ll have a new Live chat and be sure to follow our Facebook page to be able to tune in.


Custom Date Range Added to Splits Tool

A few weeks ago we added a custom splits tool to our player pages. This weekend, we added the ability to select a specific date range. To do this, we added the “Time Frame” control bar, which now contains all date-related splits and controls.

The “Filter” menu is the old “Time Frame” splits menu. This gives you the option to view plate appearances occurring in a month or season half, and the day or night time-of-day split. These are different from a custom date range. Choosing the “May” split in the filter menu will display plate appearances from every May. This would be used for getting career stats in May.

Date Range Splits Tool

To look at splits from a specific date, there’s a drop-down calendar with which you can select the start date and end date. This will limit the splits to those specific days. This can be useful if you want to look at splits after a player returns from an injury, a trade or an adjustment. We’ve also included preset ranges like the last 30 days or the past calendar year.

Read the rest of this entry »