Archive for FanGraphs Prep

FanGraphs Prep: How Many Runs Should Have Scored?

This is the ninth in a series of baseball-themed lessons we’re calling FanGraphs Prep. In light of so many parents suddenly having their school-aged kids learning from home, we hope that these units offer a thoughtfully designed, baseball-themed supplement to the schoolwork your student might already be doing. The previous units can be found here.

Overview: A short unit centered on understanding the concept of expected runs and sequencing. In one of our earlier lessons, we learned about the relationship between runs and wins. Now, we’ll take that concept a step further and learn about expected runs and how they can tell us more about a team’s true talent.

Learning Objectives:

  • Use logic to determine all possible sequences of given events.
  • Use algebra to solve multiple equations.
  • Identify the effects of event sequencing in baseball.
  • Identify and apply the Pythagorean Expectation.
  • Explain the relationship between expected runs and wins.
  • Explain the uses of the Pythagorean Expectation using different inputs.

Target Grade-Level: 9-10

Daily Activities:

Day 1
In baseball, sequencing is the concept that the order of events on the field have an effect on run scoring results. Sometimes this concept is referred to as cluster luck because teams that cluster hits together appear more “lucky” than teams who don’t. This concept is pretty easy to demonstrate. Say a team collects three singles and one home run in a given inning. The order of those events will lead to very different outcomes. If the team hits the three singles before the home run, it will likely result in four runs. But if the home run is hit first with the three singles following, the likely result is fewer runs, perhaps as few as one. Read the rest of this entry »

FanGraphs Prep: Is Context King?

This is the eighth in a series of baseball-themed lessons we’re calling FanGraphs Prep. In light of so many parents suddenly having their school-aged kids learning from home, we hope that these units offer a thoughtfully designed, baseball-themed supplement to the schoolwork your student might already be doing. The previous units can be found here.

Overview: A short unit centered on understanding the difference between context-neutral stats and context-specific stats. Both tell us very different things about what happens on the field. What’s the difference between them and how do we use them?

Learning Objectives:

  • Identify and apply a run-expectancy matrix.
  • Explain the difference between context-specific and context-neutral statistics.
  • Evaluate which type of statistic to use in a given situation.

Target Grade-Level: 9-10

Daily Activities:

Day 1

At the end of 2019, Pete Alonso led all of baseball with 53 home runs. But all those home runs weren’t created equally. Thirty-one of them came with no runners on, while the remaining 22 were hit with at least one runner on base. Should those two- and three-run home runs count for more than all those solo shots? That’s the question at the center of our lesson today: Should we take the game context into account when evaluating players? Not to spoil anything, but the answer is both yes and no. Read the rest of this entry »


FanGraphs Prep: Ups, Downs, and Rolling Averages

This is the seventh in a series of baseball-themed lessons we’re calling FanGraphs Prep. In light of so many parents suddenly having their school-aged kids learning from home, we hope is that these units offer a thoughtfully designed, baseball-themed supplement to the school work your student might already be doing. The first, second, third, fourth, fifth, and sixth units can be found here, here, here, here, here, and here.

Overview: A short unit centered on calculating rolling averages. Calculating the mean, median, and mode are fundamental concepts in math. But when we’re dealing with a dataset spread out over weeks, months, or years, simply calculating the average value for the entire dataset hides the data’s peaks and valleys. For a baseball player, those are the hot and cold streaks that everyone goes through during the season.

Learning Objectives:

  • Identify and apply a rolling average.
  • Explain how changing an interval affects interpretation.
  • Consider the potential uses of a rolling average in baseball.

Target Grade-Level: 9-10

Daily Activities:
Day 1
Khris Davis famously hit .247 four seasons in a row from 2015–2018. If we take his total hits and total at-bats over those four seasons, it’s no surprise that his combined batting average is .247.

Khris Davis Batting Average, 2015–2018
Year At-bats Hits AVG
2015 392 97 0.247
2016 555 137 0.247
2017 566 140 0.247
2018 576 142 0.247
Total 2089 516 0.247

Read the rest of this entry »


FanGraphs Prep: Regression Towards the Mean

This is the sixth in a series of baseball-themed lessons we’re calling FanGraphs Prep. In light of so many parents suddenly having their school-aged kids learning from home, we hope is that these units offer a thoughtfully designed, baseball-themed supplement to the school work your student might already be doing. The first, second, third, fourth, and fifth units can be found here, here, here, here, and here.

Overview: A one-week unit centered around understanding the concept of regression to the mean. This can be a difficult concept to grasp but it’s important for any aspiring statistician to understand.

Learning Objectives:

  • Explain the difference between “true talent” and a statistic.
  • Use algebra to calculate probabilities.
  • Estimate future performance using a projection.
  • Identify and apply Regression to the Mean.

Target Grade-Level: 9-10

Daily Activities:
Day 1
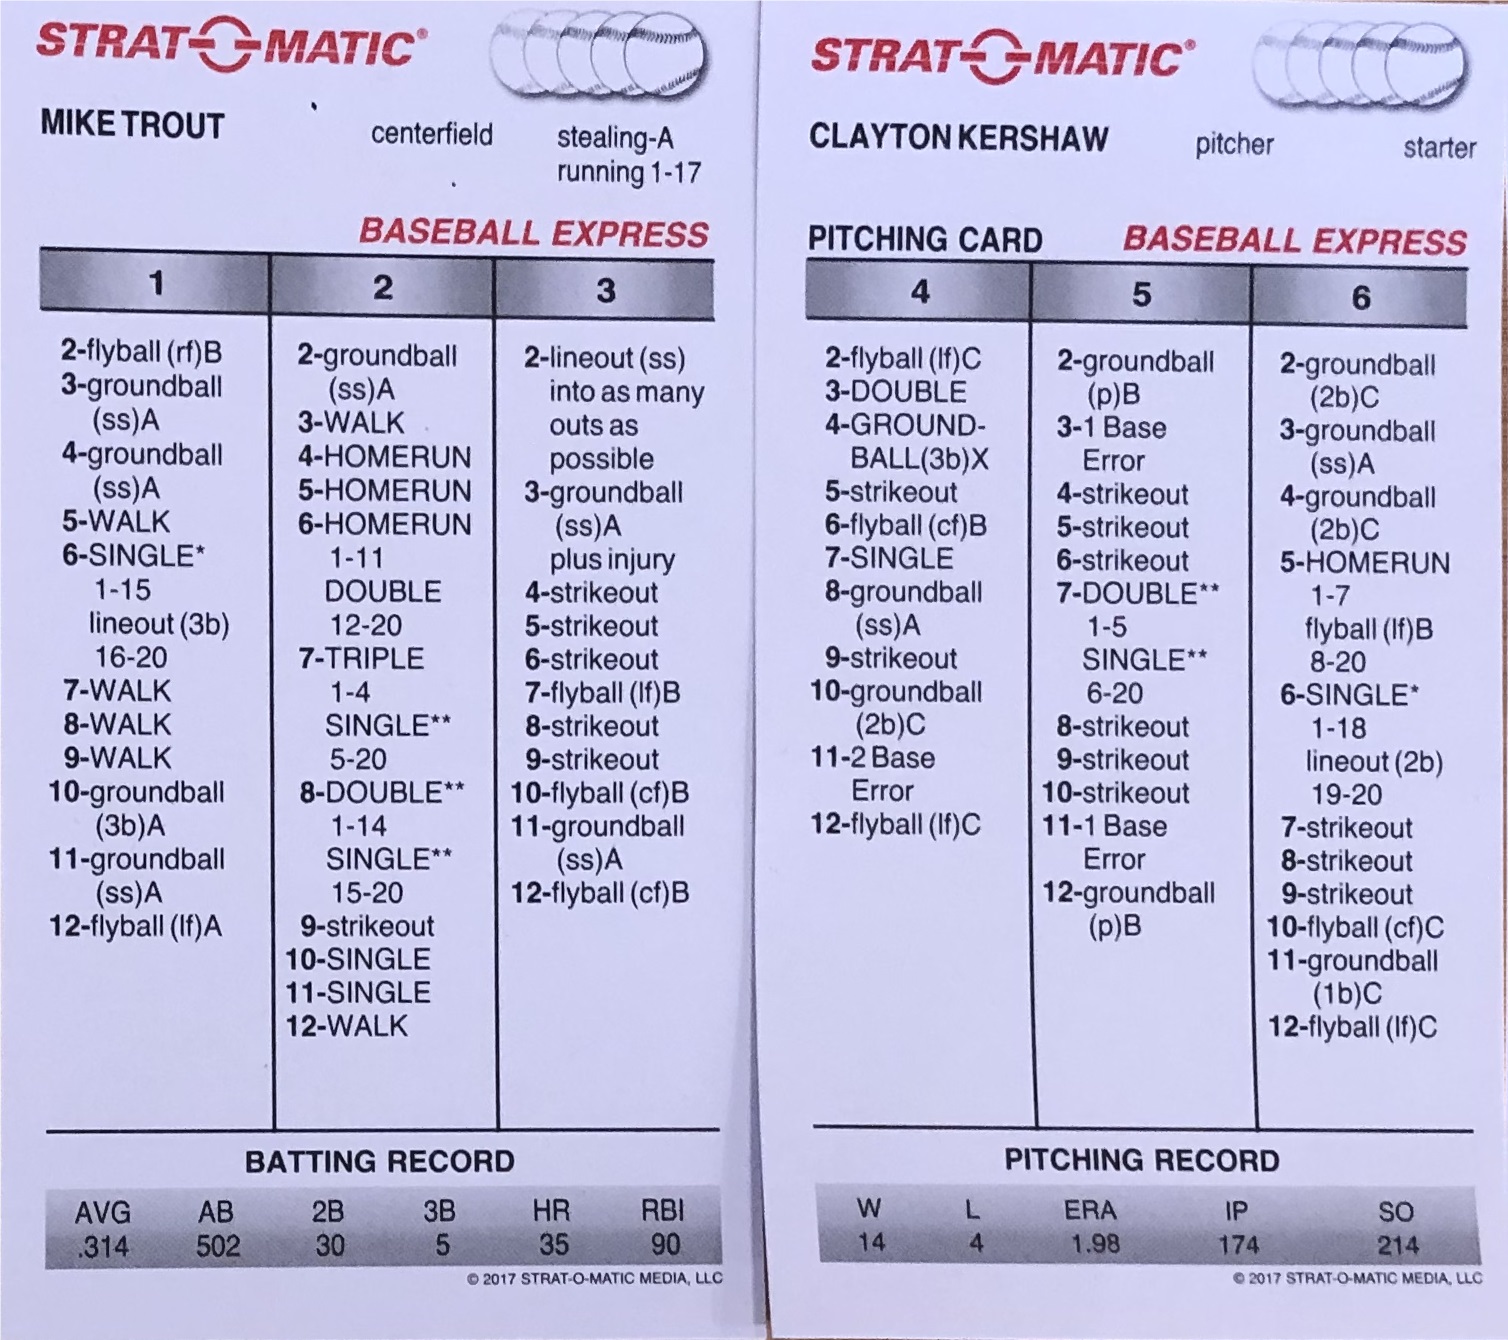
Strat-O-Matic is a two-player card-based baseball game. You start by making lineups and then play out a series of batter-pitcher matchups like the one below between Mike Trout and Clayton Kershaw.

Each matchup involves rolling three six-sided dice. The first one tells you which column to use and the next two determine the outcome, although sometimes we will need to roll an additional 20-sided die. For instance, if the first die roll is a 1, we’ll direct our eyes to the left-most column on Trout’s card. If the next two dice add up to 7, Trout has worked a walk. Read the rest of this entry »


FanGraphs Prep: Build Your Own Mock Draft

This is the fifth in a series of baseball-themed lessons we’re calling FanGraphs Prep. In light of so many parents suddenly having their school-aged kids learning from home, we hope is that these units offer a thoughtfully designed, baseball-themed supplement to the school work your student might already be doing. The first, second, third, and fourth units can be found here, here, here, and here.

Overview: A one-week unit centered around the MLB Draft.

The amateur draft is one of the most important events in baseball. Months and years of work go into each team’s preparation for the exercise. In this unit, you’ll squeeze all of that work into a single week as you learn about the decision-making process that goes into making a selection in the draft.

Learning Objectives:

  • Gather data from various sources to form an opinion.
  • Evaluate a dataset using a set of criteria to identify data points that fit.
  • Project potential fits based on needs and trends.
  • Adapt and adjust as new data is available.
  • Explain the reasoning behind a decision-making process.

Read the rest of this entry »


FanGraphs Prep: Strikeouts, ERA, and the Relationship Between Variables

This is the latest in a series of baseball-themed lessons we’re calling FanGraphs Prep. In light of so many parents suddenly having their school-aged kids learning from home, we hope is that these units offer a thoughtfully designed, baseball-themed supplement to the school work your student might already be doing.

Overview:

A four-day unit that uses strikeouts, walks, and home runs to describe relationships between variables and predictive logic.

Many statistics in baseball are inter-related. We examined the relationship between runs and wins a few weeks ago. Today, we’ll learn about a few more of these relationships and how to think predicatively about them.

Learning Objectives:

  • Make a hypothesis about the relationship between two variables
  • Create a scatter plot using a dataset containing multiple variables
  • Estimate and calculate a trend line
  • Evaluate a hypothesis using data
  • Describe the relationship between variables

Target Grade Level: 7-9

Daily Activities

Day 1
ERA, or earned run average, measures how many runs a pitcher gives up per nine innings. It’s measured in runs — the only thing this statistic cares about is how many innings a pitcher throws and how many earned runs they surrender. But we can look at other statistics as well: what percentage of opposing batters a pitcher strikes out, what percentage they walk, and what percentage of opposing batters hit home runs.

Come up with a hypothesis about how these three statistics relate to ERA. Do you think that pitchers who strike out more batters allow fewer runs on average, or more? Why? Do the same for each of strikeout rate, walk rate, and home run rate. Read the rest of this entry »


FanGraphs Prep: Build and Test Your Own Projection System

This is the third in a series of baseball-themed lessons we’re calling FanGraphs Prep. In light of so many parents suddenly having their school-aged kids learning from home, we hope is that these units offer a thoughtfully designed, baseball-themed supplement to the school work your student might already be doing. The first and second units can be found here and here.

Overview: A two-week unit centered around building and testing your own projection system.

From the simplest forecasts to the most complex projection systems, one of the most challenging questions to try to answer with statistics is predicting player performance from one year to the next. We do this by using their past stats to create an estimate for their future performance. Accounting for other factors like age and injury adds complexity, though not necessarily accuracy. In this unit, you’ll create a simple projection system and then test its accuracy.

Learning Objectives:

  • Identify and apply a weighted mean.
  • Gather and organize data from various sources.
  • Construct a weighted projection using historical data.
  • Explain why a projection system produces errors.
  • Identify and apply Mean Absolute Error.
  • Identity and apply Root Mean Square Error.
  • Evaluate which projection error to use for a given problem.
  • Review a projection system and adjust to fit data.

Target Grade-Level: 9-10

Read the rest of this entry »


FanGraphs Prep: Wins, Runs, and Pythagoras

This is the second in a series of baseball-themed lessons we’re calling FanGraphs Prep. In light of so many parents suddenly having their school-aged kids learning from home, we hope is that these units offer a thoughtfully designed, baseball-themed supplement to the school work your student might already be doing. The first unit, on constructing a team’s Hall of Fame, can be found here.

Overview: A one-week unit centered on the Pythagorean Theorem and Pythagorean Expectation.

The Pythagorean Theorem is a fundamental principle in geometry that describes the relationship between the three sides of a right triangle. In baseball, the Pythagorean Expectation describes the relationship between runs and wins.

Learning Objectives:

  • Identify and apply the Pythagorean Theorem
  • Identify and apply the Pythagorean Expectation
  • Explain the relationship between runs and wins
  • Evaluate various example problems and apply mathematical reasoning to solve them

Target Grade-Level: 9-10

Read the rest of this entry »


FanGraphs Prep: Build Your Own Team Hall of Fame

As you may recall, a few weeks ago, we asked for your feedback on FanGraphs Prep, a new project we’re embarking on in light of many parents suddenly having their school-aged kids learning from home. We thought we might be able to use baseball as a teaching tool, and give parents a way to keep their kids engaged with their school work. Since then, we’ve spoken with a few current and former educators to get our bearing and try to design units that are useful to parents and students. For instance, Jake, the author of today’s unit, has a Masters in Teaching with a certification in Secondary (Middle & High School) Social Studies. He taught in Washington public schools from 2010 to 2012, and also worked for a local non-profit serving at-risk youth from 2010 to 2014, where he developed curriculum and a behavior management system.

This is our first effort in the series, and before we get to our lesson, we thought we should lay out what FanGraphs Prep is, and what it is not. These are not meant to be a substitute for your student’s existing curriculum. Curriculum design is not our primary occupation, and if the last few weeks have reinforced anything, it’s just how much skill and expertise it takes to guide students’ learning and design educationally enriching materials for them. What we hope is that these lessons offer a thoughtfully designed, baseball-themed supplement to the work your student might already be doing. We’ll endeavor to provide clear learning objectives, as well as activities or problems for each unit, and offer some pointers for how to tailor the lessons for students who might not fall into each unit’s target grade level. And we want to hear from you on what works and what doesn’t. This week’s lesson skews more heavily toward the writing side of things, but others will tackle math subjects more directly. They’ll be pitched to a variety of grade levels. We welcome your feedback on what other subjects would be useful to you. Thank you for reading the site. Now, on to this week’s lesson! – Meg Rowley

Build Your Own Team Hall of Fame

Overview: A two-week unit centered around the Hall of Fame.

You’ve just been appointed the director of your favorite team’s Hall of Fame. Your first task is to evaluate a single player for possible election to the Hall. Then, you’ll build a new set of criteria for election and determine which players are eligible. Read the rest of this entry »


Introducing FanGraphs Prep!

In the new reality of sheltering in place, most schools are now closed. Parents might be looking for new problems and lessons that are interesting to students; it’s a lot easier to keep your mind on a problem when it’s about something that’s already interesting. Teaching addition is a lot easier when you’re counting balls and strikes, or shots and points, than when you’re counting Greek letters or something equally obscure.

To that end, we’re going to be testing out a new program over the coming weeks: FanGraphs Prep. I’ll lay out the project in this article, but in essence, FanGraphs Prep will use baseball as a teaching tool. What we teach is still up in the air, and you can help us with that part by answering a few questions.

For many of the writers at the site, part of baseball’s enduring appeal is the math underlying the game. It’s not the only reason we like the sport, or even necessarily the main reason, but in almost every case, it hooked us as kids. Batting average, ERA, wins and losses; baseball and numbers are inextricable.

For others, the call of the game has been more literary. Roger Angell, Stephen Jay Gould, Jim Bouton — baseball’s written history is rich and varied. Many of us took a flashlight under the covers to read about baseball at night as kids.

In that spirit, we’d like to share our knowledge, and provide what we hope will be a welcome educational diversion for students and those helping to teach them at home. Our plan is to create writing prompts and sample problems that frame different school subjects in the context of baseball. Want to learn basic math? A box score is a treasure box of numbers. Want to learn algebra, or probability? The sport provides excellent examples of those as well. Read the rest of this entry »