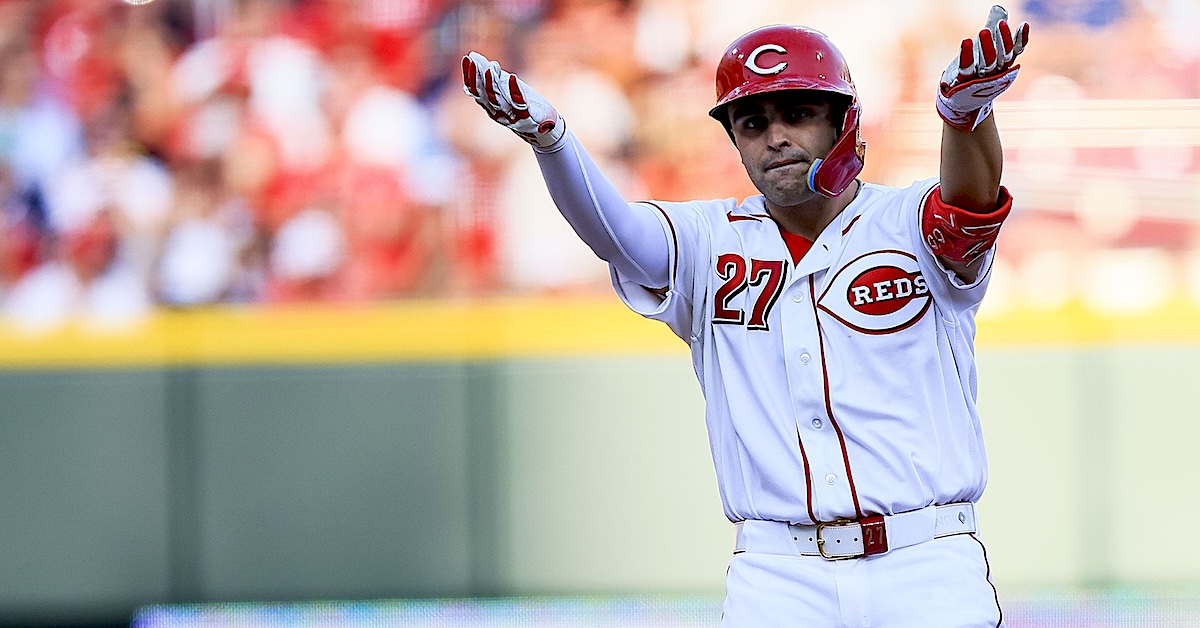
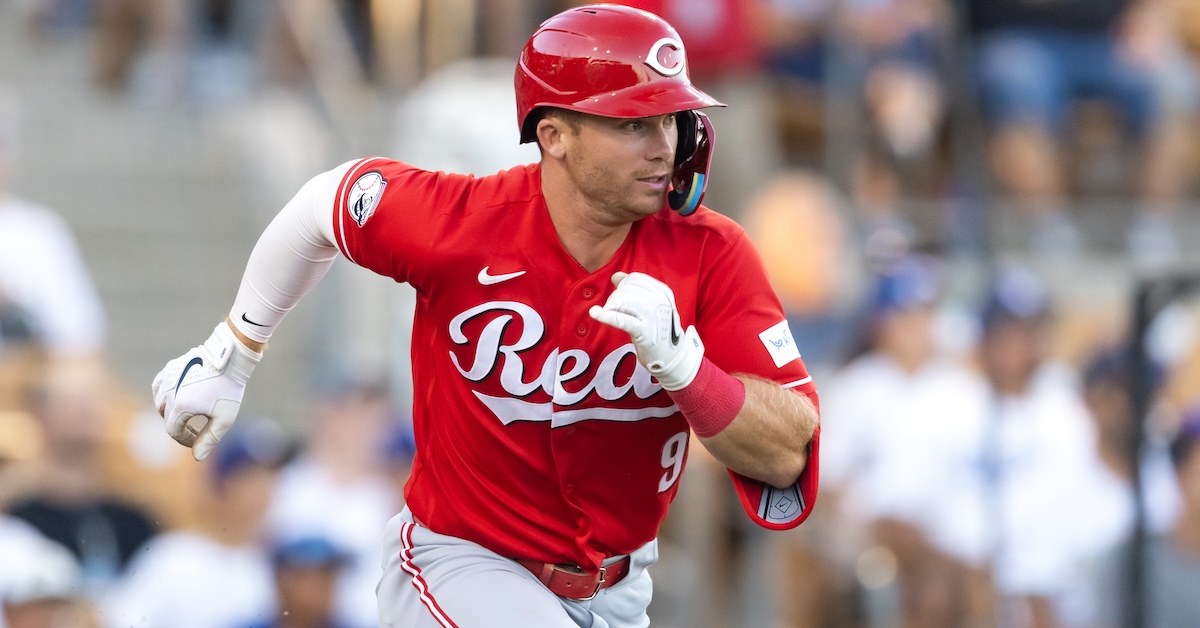
Sal Stewart made a promising showing when the Reds called him up last September, clubbing five home runs in 18 games while helping Cincinnati reach the postseason for the first time since 2020. His 2026 campaign is off to a flying start, as well. Not only did he bank NL Player of the Week honors for the season’s opening week, but his performance underscores the notion — supported by both scouting and statistical projections — that he’s leveled up significantly.
Through the Reds’ first six games, the 22-year-old first baseman has put up video-game numbers, batting .474/.615/.947 (313 wRC+) with two homers in 26 plate appearances. His hot streak began with an eventful Opening Day; while the Reds lost to the Red Sox, 3-0, it was hardly his fault. He went 3-for-4, including a pair of bases-empty doubles, one apiece off starter Garrett Crochet and reliever Garrett Whitlock, as well as a single to right field off Crochet with men on first and second. With third base coach Willie Harris wary of testing two-time Gold Glove winner Wilyer Abreu’s arm, lead runner Matt McLain was held up and ultimately stranded.
Stewart also survived a scare in the fifth inning, when a 110-mph liner off the bat of Roman Anthony hit his left wrist as he tried to backhand the ball. He was shaken up but remained in the game, and reassuringly collected two of his three hits after being drilled. Read the rest of this entry »
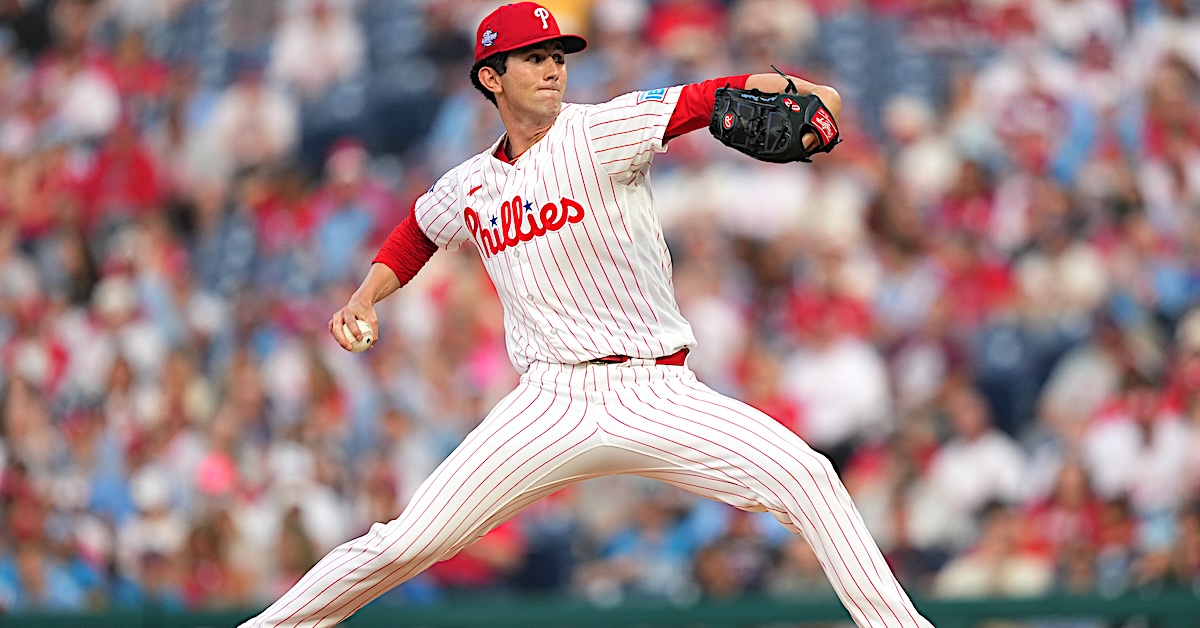
Andrew Painter made his major league debut on Tuesday, as the Phillies were coming off a three-game losing streak. That’s a tough assignment; I know it’s the first week of the season, but that has never stopped Phillies fans — who even in the best of times are always looking for a reason to jump off a bridge — from declaring the team irretrievably cooked.
Not so fast, my friends. Because anyone who’s willing to overreact to a one-game sample in April must be over the moon about Painter.
Painter, who turns 23 next month, was one of the top pitching prospects in the entire sport in the 2022-23 offseason. At age 19, he was promoted to Double-A, where he posted a 2.54 ERA in five starts and struck out 37, while walking just two, in 28 1/3 innings. As 2023 dawned, there was a not-unreasonable expectation that Painter would contribute down the stretch in his age-20 season, perhaps as a bullpen stopper, like a young David Price or Adam Wainwright, or perhaps in the rotation. (Remember, this was before Cristopher Sánchez turned into the world-destroying ace he’s become.)
But Painter’s elbow started barking, and an early hesitation to sending him to get Tommy John surgery led to both 2023 and 2024 being written off. With two years of rust, Painter struggled in 2025, pitching to an ERA over 5.00 across two minor league levels, and the first single-digit K/9 ratio of his professional career. The Phillies pitched well last postseason, but they still could’ve used Painter. He simply hadn’t earned the call-up that he’d seemingly had in the bag since early 2023.
He dropped his arm slot and lost a ton of life off his fastball while returning from Tommy John, but the promise remained. He was no longer the top pitching prospect in baseball, nor the top prospect in the Phillies’ system, but he rated no. 27 overall this past offseason and eighth among pitching prospects, with a 55-FV grade. This is still Philadelphia’s most anticipated rookie pitcher since at least Cole Hamels.
It speaks to the Phillies’ faith in the young right-hander that they did not go out and get anything resembling a like-for-like replacement for the departing Ranger Suarez. With Zack Wheeler on the mend from thoracic outlet syndrome, that left Painter in the big league rotation with no safety net. I genuinely do not know who starting pitcher no. 6 is for the Phillies right now, but I am confronted with the possibility that it might be Bryse Wilson if 40-man roster glut were not a consideration.
So, yeah, there’s a bit of pressure on Painter.
If he was feeling that pressure, you couldn’t tell. Painter, who stands an Ent-like 6-foot-7, strolled serenely to the mound for his first competitive big league action. And as good as the stuff and the results were — don’t worry, I’m getting there — Painter’s composure seemed to impress his teammates most.
But it doesn’t matter how calm a rookie pitcher is if he’s throwing slop and getting shelled. So let’s check Painter’s stuff and results.
Yes, the Nationals’ lineup isn’t that good overall, but it features a few challenging hitters: CJ Abrams, Daylen Lile, and the genuinely capital-D Dangerous James Wood. Joey Wiemer is coming off a run of literally not making an out for 10 straight plate appearances, though it looks like the magic (or quantum ray power) has finally worn off.
The value proposition for Painter is that there’s nothing weird about him. He’s just what an ace looks like. He’s huge, he throws hard, he has a varied arsenal of six pitches… there’s just nothing to talk yourself into on the scouting report.
Painter throws two fastballs, a four-seamer and sinker, both of which sat 94-97 and topped out at 98.7 mph. He hit that figure twice in the first inning, when he was freshest and the adrenaline was surely pumping hardest, but he got back to 98.6 mph in the fourth.
Like a lot of modern starters, Painter has one look for left-handed hitters and another for righties. The platoon advantage works because breaking balls move away from same-handed batters and toward opposite-handed hitters. So pitchers like Painter, who have multiple fastballs and breaking balls, want to work side-to-side against same-handed batters and up-and-down against opposite-handed ones. That means four-seamer, sinker, slider, sweeper against righties, and four-seamer, slider, curveball, changeup against lefties in Painter’s case.
Nationals manager Blake Butera loaded up on the former. With six lefties and two switch-hitters in the lineup, Wiemer was the only right-handed batter Painter faced all evening, so we saw a lot of his four-seamer, slider, curveball, and changeup, and relatively little of his sinker and sweeper.
Painter was kind enough to get at least one strikeout on each pitch from that first group of four, so that you can see all of them in this highlight video.
Painter’s first and last strikeouts came against Wood, and both came from working fastball up, curveball down, to change Wood’s eye level and mess up his timing. He struck out in the fifth inning after taking an 80.6-mph curveball for a strike, and then chasing a 97.2-mph four-seamer up and away.
With the fastball and curveball established, Painter could tunnel his changeup into a middle ground in terms of movement and speed. The scouting report on Painter has “FASTBALL VELOCITY” and “NASTY CURVEBALL” written in all caps, but the changeup is a new weapon, perhaps the only positive development from his forgettable 2025 season in Lehigh Valley.
He was able to paint the bottom left-hand corner of the strike zone with his changeup to get Luis García Jr. looking in the third, and he did it again to Jorbit Vivas in the fourth. Both of those pitches were right on the edge of the zone, but Painter worked there so effectively that the Nats were out of challenges when Vivas tried to summon ABS to bail him out.
And when Painter did allow contact, it was pretty innocuous. He let up 12 balls in play out of 21 batters faced. Only three of those batted balls had an xBA of .100 or higher, and only one reached Baseball Savant’s hard-hit threshold of 95 mph. That was the last pitch Painter threw all night: Abrams ripped it to right for a single, and Phillies manager Rob Thomson, wanting his rookie starter to go out on a positive, pulled the plug.
The damage the Nats did against Painter, such as it was, didn’t do much to discredit the rookie’s effort. Lile seemed to have Painter’s number, reaching twice, but one of those two came on a popup that four different Phillies lost in the lights. As a general rule, when someone tags Jon Bois on social media with “watching baseball,” it doesn’t speak well of what’s depicted.
The state of perpetual garment-rending around the Phillies might be unhelpful, as I mentioned up top, but as debuts go, at home in April against the Nats is a pretty soft assignment for a rookie. Painter aced it, so to speak, but that success only earns him a new set of questions to answer. Can he get it done against deeper lineups? Can he survive a third time through the order? Can he hold his velocity? If so, how far up the rotation can he climb — a question that could become quite relevant given the questions about Wheeler’s health and Aaron Nola’s getting abducted by aliens last year.
But that’s life in the big leagues. The hits just keep on coming. Or, in Painter’s case, maybe they won’t.
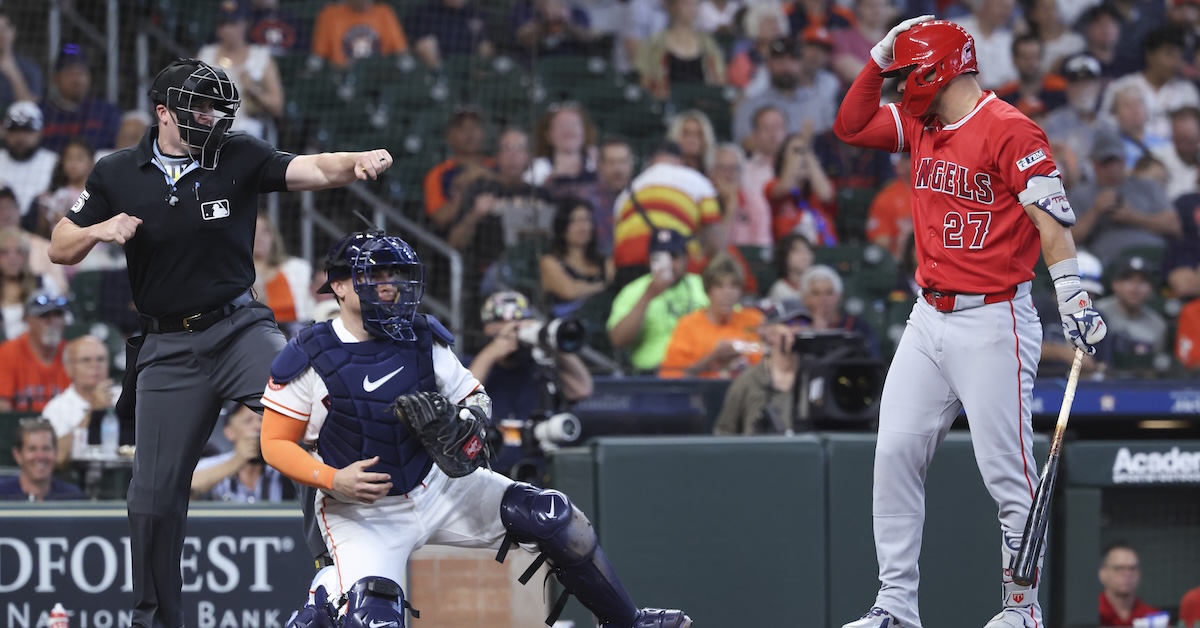
In the new season’s early going, the challenge system has been all the rage across the majors. If you don’t believe me, you can read ESPN’s coverage of it, or The Athletic’s, or MLB.com’s, or … well, you get the idea. The coverage has been extensive and positive, and I couldn’t agree with its enthusiasm more. I love the new system, and I’m also really excited to think about challenges in general. There are so many fun angles to consider. So here’s the math nerd’s take on what challenges have looked like so far, and what I’m most interested to learn about them moving forward.
How I’m Thinking About Challenges
Every time a strike or ball is called, there’s an opportunity for a challenge, at least so long as the relevant team has one remaining. That makes it easy to measure the prospective value of a challenge on any given pitch: It’s worth however much flipping the result of that particular pitch would change the game situation in the challenging player’s favor. All we have to do is figure out how many runs were likely to score in the inning in each case and compare the two. Read the rest of this entry »
Over the past few years, one thought has kept bouncing around in my mind: “I must be taking crazy pills.” Don’t run off to the comments to complain about this post getting political, because that’s not the point I’m trying to make. Over the past few years, longstanding institutions and norms have come crashing down without so much as a peep from the people charged with defending them. Whether you think that’s good or not, it’s a matter of historical fact.
Therefore, we live in disconcerting times. COVID, AI, mass media consolidation, man’s inhumanity to man… it messes with one’s sense of order in the universe. We’re rapidly approaching an era in which battery tech and solar power actually make electricity too cheap to meter, but NATO and the Washington Post might not exist by the time we get there.
It’s unsettling. There have been times when I’ve looked around and found that the most logical explanation is that I am, genuinely, being slipped crazy pills without my knowledge. Because surely this must make sense to someone. Read the rest of this entry »
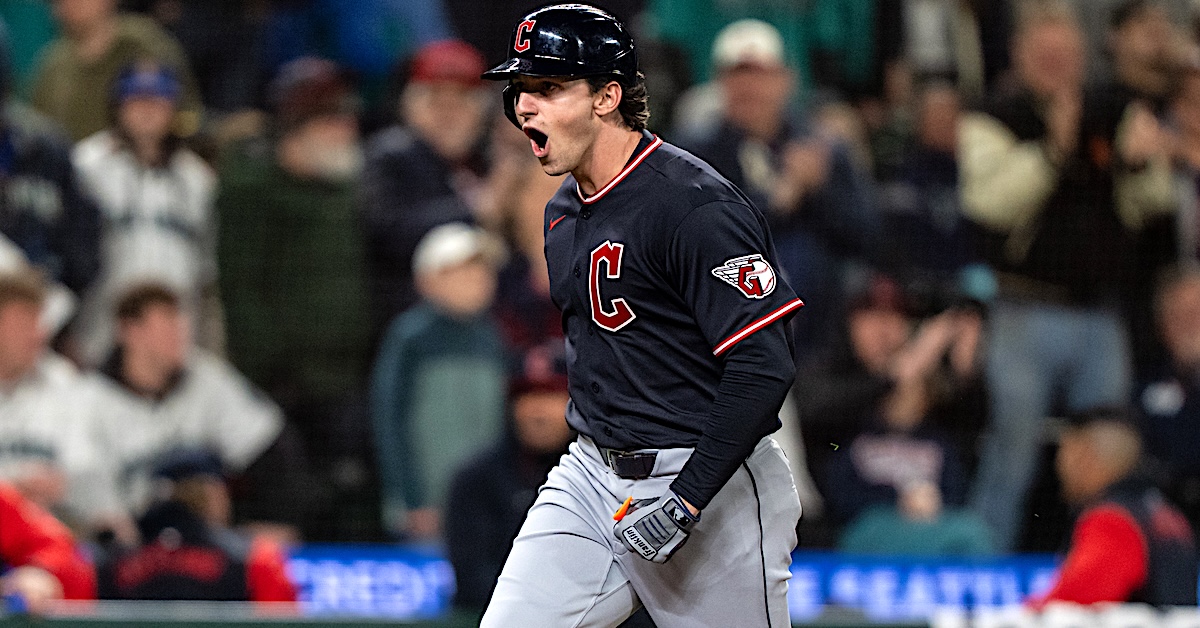
Chase DeLauter got an odd start to his major league career last fall — and an inauspicious one, at that — when he became the sixth player to debut in a postseason game before playing in a regular season one. The Guardians’ rookie right fielder has fared much better in the early stages of his first regular season in the majors, going on a home run binge that made a bit of history.
Facing the Mariners in Seattle on Opening Day last Thursday, the 24-year-old DeLauter started things off by homering in his first plate appearance, launching a towering 358-foot solo shot off Logan Gilbert. It was the first Cleveland run of the season, and though at least 140 players in AL/NL history have homered in their first career at-bat, in the ninth inning he joined a much more exclusive club. With the Guardians ahead 5-4, DeLauter hammered a 422-foot solo home run off Cooper Criswell, helping to seal the victory and becoming just the sixth player to homer twice in his regular season debut:
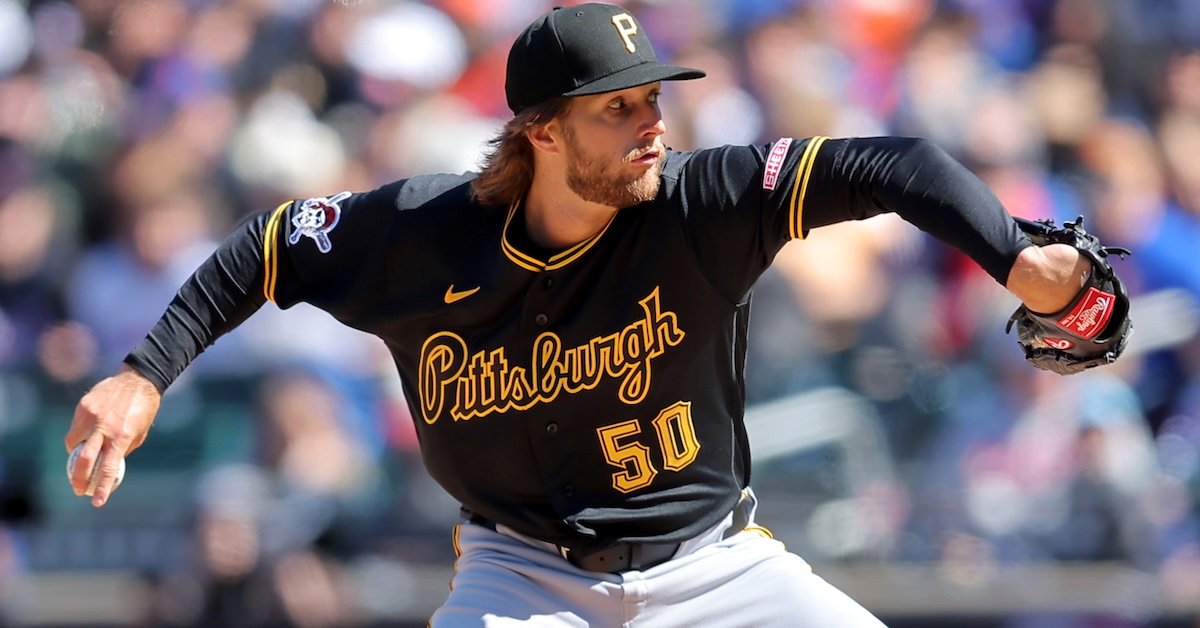
In general, the Pirates’ first series of the year could’ve gone better. What everyone’s going to remember from this past weekend is the worst start of Paul Skenes’ career — probably of his entire life. But it could’ve been worse. Winning one of three at Citi Field against the Mets is probably going to end up looking like even par for one of the tougher assignments in the National League, especially with one of those losses coming in extra innings.
Brandon Lowe hit three home runs. Even Skenes’ awful opening inning was only made possible by some horrendous defense and ridiculous batted-ball luck. And Carmen Mlodzinski struck out the side against the top of the Mets’ order on Sunday. Twice. Read the rest of this entry »
Below is an analysis of the prospects in the farm system of the Colorado Rockies. Scouting reports were compiled with information provided by industry sources as well as my own observations. This is the sixth year we’re delineating between two anticipated relief roles, the abbreviations for which you’ll see in the “position” column below: MIRP for multi-inning relief pitchers, and SIRP for single-inning relief pitchers. The ETAs listed generally correspond to the year a player has to be added to the 40-man roster to avoid being made eligible for the Rule 5 draft. Manual adjustments are made where they seem appropriate, but we use that as a rule of thumb.
A quick overview of what FV (Future Value) means can be found here. A much deeper overview can be found here.
All of the ranked prospects below also appear on The Board, a resource the site offers featuring sortable scouting information for every organization. It has more details (and updated TrackMan data from various sources) than this article and integrates every team’s list so readers can compare prospects across farm systems. It can be found here. Read the rest of this entry »
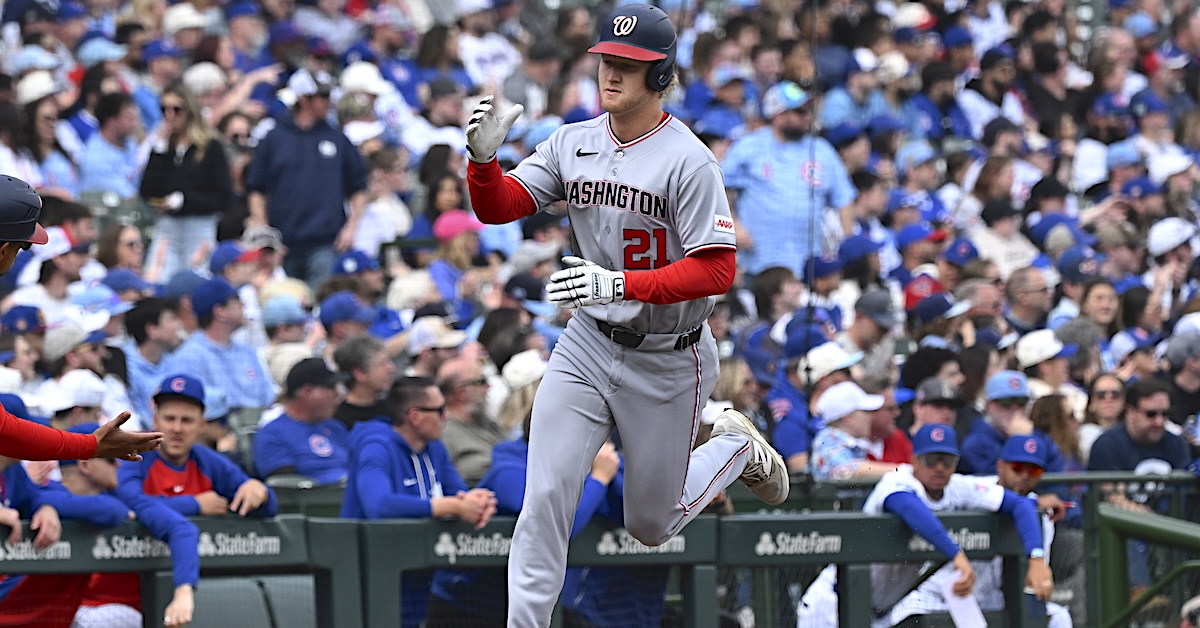
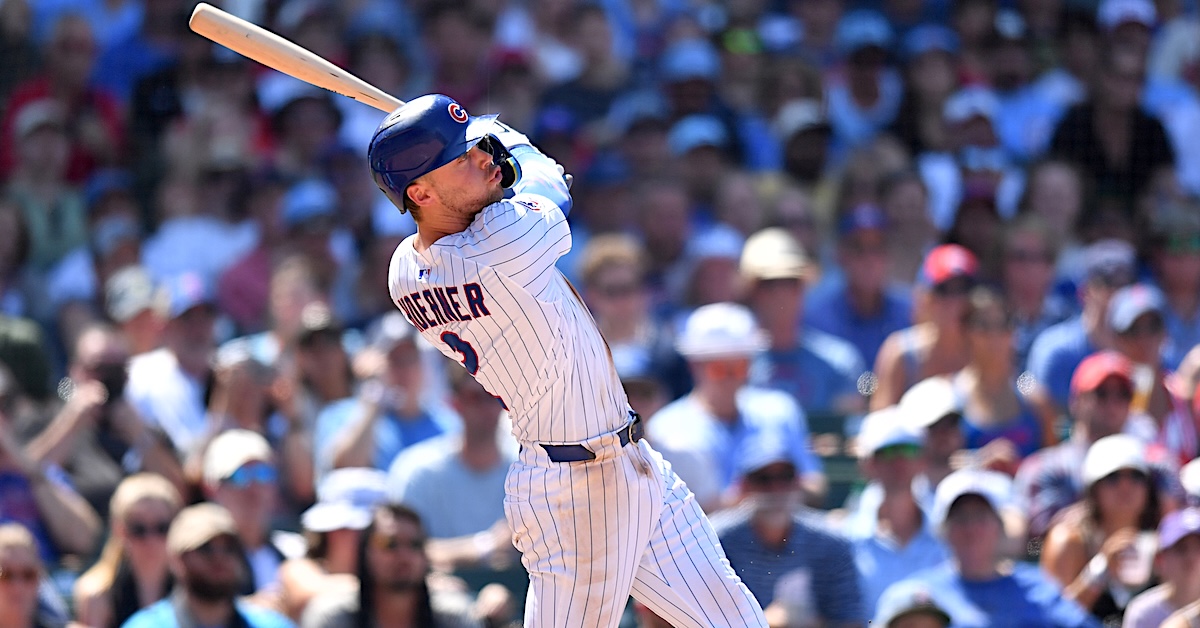
A week ago, the Cubs roster was light on long-term commitments. Only Alex Bregman and Dansby Swanson held guaranteed contracts that extended past 2027, and only two others – Phil Maton and Shelby Miller – even had guaranteed years in 2027. But as it turns out, Chicago payroll commitments abhor a vacuum. On Tuesday, Pete Crow-Armstrong signed a six-year extension. On Thursday, Nico Hoerner followed suit with a six-year pact of his own, as Michael Cerami first reported. The deal starts in 2027 and is worth $141 million, with minor deferrals that drop the total present value to the mid-130s.
If you don’t catch many Cubs games, it’s easy to overlook Hoerner. His offensive game is most notable for its lack of extremes. He doesn’t walk much. He doesn’t strike out much. He doesn’t hit for a ton of power. He’s not excessively swing happy like so many contact hitters. He doesn’t pound the ball into the ground, but he equally doesn’t sell out to lift and pull. He’s produced low-power, solid-OBP seasons for four years running, and they’ve been almost metronomically consistent: his seasonal wRC+ marks of 108, 103, 102, and 109 work out to a 105 average.
That’s the 105th-best batting line among hitters over that span. That doesn’t sound particularly impressive. Hoerner is wedged between Jake Cronenworth and Mike Yastrzemski, solidly in nice-but-forgettable territory. He’s 57th in OBP over that span, which is a little bit more exciting, but truthfully, he is not a star at the plate.
The fun starts when you get into the rest of his game. Over that same time frame, from 2022-2025, Hoerner is the sixth-best baserunner in the majors. The guys in front of him – Corbin Carroll, Bobby Witt Jr., Trea Turner, Jarren Duran, and Elly De La Cruz – are famed for their exploits on the bases. Hoerner is the slowest of that group by a fair margin, but he makes up for it with excellent instincts and great reads. He’s fifth in the bigs in steals during that span, and his 85% success rate is better than everyone in front of him on the list. When he gets on base, he’s a threat to steal, and yet he almost never gets thrown out. Read the rest of this entry »
Tarik Skubal commanded the zone while dominating the San Diego Padres on Thursday. Making his third straight Opening Day start for the Detroit Tigers, the reigning back-to-back Cy Young Award winner threw 49 of 74 pitches for strikes, including 17 of 22 to start an at-bat. Moreover, he mixed with aplomb. Skubal garnered 14 called strikes, 10 of them on either his four-seamer or sinker, as well as 11 whiffs, nine coming on changeups. He departed after six innings having surrendered just three hits, with six strikeouts and nary a free pass.
His M.O. for attacking the strike zone? I asked the 29-year-old southpaw about that following one of his spring training outings earlier this month. As it has become increasingly common for pitchers — particularly power pitchers — to aim middle and let their stuff play from there, I wanted to know how precise he is with intended location.
“My changeup, I throw down the middle, but that’s because when I throw it down the middle, the result is down and away,” replied Skubal. “And when I throw my slider down the middle, the result is glove-side and down. So, there are pitches I throw down the middle, but that’s just visually, as opposed to what I’m actually doing.
“I feel like I do a good job of throwing strikes,” continued Skubal. “As far as really executing every pitch that I throw… I don’t know. There is probably a metric on it. I’d like to think I’m a little bit above average, but I don’t know what the numbers say.“
Measuring command is an imperfect science, so where Skubal ranks depends on your metric of choice. According to our PitchingBot model, he was among the best of the best. Last season, Skubal graded out at 64 (on a 20-80 scale) tying him with Seattle’s Bryan Woo at the top of our botCmd leaderboard. Read the rest of this entry »
We did it everyone! We made it through the long offseason. Regular season baseball is back, and it has already delivered the goods. I attended Mets-Pirates at Citi Field on Opening Day to witness the highly anticipated pitching matchup between reigning NL Cy Young winner Paul Skenes and new New York ace Freddy Peralta. Naturally, Skenes had the worst game of his career thus far, failing to make it through the first inning, and Peralta didn’t pitch well either. The two teams combined for 18 runs in the 8 1/2 innings of play. I wrote about the Skenes start, the two defensive blunders by Oneil Cruz in center field that contributed to Pittsburgh’s first-inning fiasco, and the lineup’s surprisingly strong showing. You can read that here.
Because I was covering that contest, I didn’t get a chance to watch any of the other early games and saw only a portion of the later ones. That means I missed White Sox catcher Edgar Quero successfully challenge three ball calls in the first two innings before finally getting one wrong in the sixth inning. In that same game, which the Brewers won 14-2, Jacob Misiorowski struck out 11 Chicago batters. I also didn’t catch the pitcher’s duel between Orioles lefty Trevor Rogers and Twins righty Joe Ryan; Baltimore won, 2-1, and Adley Rutschman, not to be confused with Badley, went 2-for-4, though Tyler O’Neill’s Opening Day home run streak was snapped at six. In the later afternoon games, the Cardinals scored eight runs in the bottom of the sixth inning to secure a comeback win over the Rays, after allowing Tampa Bay to plate six runs in the top of the frame. JJ Wetherholt, who went 1-for-4 with a home run and two RBI in that game, was one of a number of prospects who shined in their big league debuts. Kevin McGonigle had four hits in the Tigers’ 8-2 win over the Padres, and Justin Crawford went 2-for-4 in the Phillies’ win over the Rangers. I actually got to see Mets right fielder Carson Benge blast his first homer, this after a dead bird had fallen in front of him in right field. It wasn’t technically his first major league game because he debuted in the postseason last year, but Cleveland’s Chase DeLauter bopped two home runs in a 6-4 win over the Mariners.
I ran through all those games up top because that’s the last we’ll be covering the Opening Day action in this week’s mailbag. Instead, we’ll be answering your questions about Matt McLain’s strong spring, Aaron Judge’s low squared-up rate, players who might benefit the most from ABS, and Tony Vitello. But first, I’d like to remind you that this mailbag is exclusive to FanGraphs Members. If you aren’t yet a Member and would like to keep reading, you can sign up for a Membership here. It’s the best way to both experience the site and support our staff, and it comes with a bunch of other great benefits. Also, if you’d like to ask a question for an upcoming mailbag, send me an email at mailbag@fangraphs.com. Read the rest of this entry »