Archive for Featured Photo

The Easiest Home Run Record Chase in Baseball History

The 2019 Baltimore Orioles are not very good at baseball. This should be no shock to anyone who has watched the Orioles play baseball during the last two seasons. Finally starting into a long-overdue rebuilding phase, this is a state of affairs that will likely last for several years. If you’re going to be terrible at something, however, I’m an advocate of being the best at being terrible at that thing. The 1962 Mets, with the most losses in modern major-league history, were lousy enough to become beloved in a way the 2003 Tigers or 1935 Braves weren’t. And there’s one lousy thing the 2019 Orioles are great at: allowing home runs.

Now, every team allows home runs these days, so standing out from the pack is even harder than it usually is. The Orioles have allowed 75 home runs in just 35 games, a frightening pace; it’s always a Home Run Derby when the orange-and-black are in town. Notice I said pace, Giants fans; your staff isn’t exactly amazing at keeping the ball in the park.

Read the rest of this entry »


On Bees, Pandas, and Hit-by-Pitches

Aside from the cool 1911 denim throwback uniforms worn by the home team, Sunday’s Giants-Reds game was a relatively conventional affair. The Reds ran up a 4-0 first inning lead thanks in part to a three-pitch, three-homer sequence, Luis Castillo threw some devastating changeups but also gave up a game-tying three-run homer to Buster Posey, and the Giants won, 6-5. Zzzzz, right? Monday’s game, on the other hand, featured several different flavors of wild, all of them worth savoring. Twenty years from now, somebody will do an oral history of this game, and ESPN will air a 30 for 30 feature.

Let’s start with the bees. More bzzzz than zzzzz…

You thought I was kidding? A swarm of ’em delayed the start of the game by 18 minutes, perhaps a message from above about those weird wraparound series, where teams play Friday, Saturday, Sunday, and Monday just to mess with peoples’ circadian rhythms. Or something.

Read the rest of this entry »


Daily Prospect Notes: 5/2/19 & 5/6/19

These are notes on prospects from lead prospect analyst Eric Longenhagen. Read previous installments here.

I turned last Thursday’s edition in too late for publication (I lost track of time at an Extended game) but certainly won’t deprive you of the notes I have from that day. Here they are:

Xavier Edwards, SS, San Diego Padres
Level: Low-A   Age: 19   Org Rank: tbd   FV: 45+
Line: 5-for-5, 2B

Notes
After 21 Low-A games, X is hitting .390/.450/.455 and has walked more than he has struck out. He has just one extra-base hit and has been caught stealing a bunch, but even for one of the more advanced high school bats from last year’s class, this is a strong start. Gabriel Arias was just put on the IL at Hi-A Lake Elsinore and Edwards has out-performed Justin Lopez and Tucupita Marcano, so he might be in line for a quick move up depending on the severity of Arias’ injury.

Yordan Alvarez, LF/1B, Houston Astros
Level: Triple-A   Age: 21   Org Rank: 7   FV: 50
Line: 6-for-8, 2 2B, HR, BB (double header)

Notes
The use of the major league baseball at Triple-A combined with the PCL hitting environment has had, um, some impact on offensive performance. It’s important to keep this in mind when considering what Alvarez has done so far, though his line through 23 games — .386/.474/.916(!) with 12 homers — is remarkable. Notably, several of those homers have come against breaking balls, which Alvarez is particularly adept at identifying and adjusting to mid-flight. He does not have a sellout, max-effort swing — this power comes easy and it plays to all fields, as seven of Alvarez’s homers this season have been opposite field shots. He was toward the back of our 50 FV group pre-season because of concerns about his body and defensive limitations, but he’s hitting like someone who belongs toward the front of that tier, up near Pete Alonso. Read the rest of this entry »


Kyle Hendricks Threw the Least 2019 Game of the Year

Friday afternoon at Wrigley Field, a week after lasting just five innings (and giving up seven runs) against the Diamondbacks in Arizona, Kyle Hendricks threw perhaps the finest game of his six-year career. Nine innings. No runs. Four hits. Eighty-one pitches, not one of them flying faster than 90 miles per hour and only 18 of them landing, unchallenged, outside of the strike zone. If Noah Syndergaard’s complete-game, 10-K, no-run performance against the Reds on Thursday — during which he hit the home run that won the game 1-0 — was the logical end of 2019’s high-strikeout, high-velocity environment, then Hendricks’ was its precise opposite: the least 2019 game of the year. That these two starts could come on consecutive days is why we love baseball; it’s a beautiful game.

If you are willing to accept a contextual definition of “struggled,” then Hendricks probably struggled most in the first inning (the other candidate is the fourth, about which I’ll say more later). He went 2-1 on the always-dangerous Matt Carpenter to lead off the game, then retired the Cardinal star on the fifth pitch of the sequence with a sinking fastball right down the middle. Nobody knew it at the time, but Hendricks had already thrown more than six percent of the pitches he’d throw in the entire game. It took him just five more pitches to close out the first inning — four to Paul Goldschmidt and one to Paul DeJong — and Hendricks was on his way.

The DeJong plate appearance was perhaps the most critical of the entire game for what it told Hendricks and catcher Willson Contreras about how the Cardinals would approach him on Friday. When Hendricks has struggled this year, it’s been when he’s forced into the strike zone late in counts when hitters know he’s got to be there. Eight-eight miles an hour, in that situation, is often just too easy for big-league hitters to hit. Against DeJong, though, Hendricks saw what would become a trend for the Cardinals throughout the game: A willingness to be aggressive early in the count. Hendricks was perfectly willing to play into it. After starting the first two hitters with at least two balls before first getting into the zone, Hendricks started 21 of the next 27 with a pitch in the zone. Read the rest of this entry »


Called Up: Nick Senzel

Nick Senzel burst onto the national scouting scene with an MVP campaign in the Cape Cod League in 2015, hitting .364 with 21 extra base hits in 40 games. He steadily rose up boards throughout the spring when it became clear his raw tools were better than many had thought at first blush, with above average raw power, speed, fielding, and throwing tools, and a 1.051 OPS, 40/21 BB/K, and 34 extra base hits in 57 games. Senzel’s baseball skills (specifically a 60-or-better hit tool with at least above average plate discipline) along with being young for his class (he didn’t turn 21 until after the draft) came together to make him a complete package as the top hitting prospect in the 2016 draft for most clubs.

The Reds took him second overall and we ranked him as the top prospect in the Reds’ system and 30th best prospect in baseball that winter after a loud pro debut, mostly in Low-A:

Senzel has above-average bat speed and bat control. His swing can get long at times and, despite simple hitting feet, his front foot sometimes gets down late which causes the rest of his swing to be tardy, as well. He was getting that foot down earlier during instructional league. He has above-average raw power, which should grow to plus as Senzel reaches physical maturity (he was only 20 on draft day and is well built), though it doesn’t play to that level in games because Senzel doesn’t incorporate his lower half into his swing especially well. If Senzel reaches a point when it would be useful to alter some aspects of his swing to generate more game power I think he’s athletic enough to make the adjustments.

Read the rest of this entry »


James Paxton’s New Toy, Same As the Old Toy

We’ve written a lot about James Paxton here at FanGraphs, and deservingly so. The obvious reasoning is that Paxton is a very good pitcher. The intrigue builds once you consider that he throws hard, is a lefty, has thrown a no-hitter, and flaunts a lot of tools that just have the look of being very electric. In 2019, he also plays for the Yankees, which, whether you like it or not, means that he will be in the general media spotlight more.

In the past, Jeff Sullivan wrote several articles on Paxton’s explosive fastball and how he gets swinging strikes with it in the top of the zone. In terms of fastball usage, not a lot has changed. Paxton still throws pretty hard, and he uses his heat pretty frequently and gets whiffs with it. However, there’s always a room for improvement, even for pitcher who’s as good as Paxton is.

Paxton has struck batters out a lot this season. That is not a news. He’s always been a strikeout pitcher in his big league career. But after striking out 32.3% of the hitters he faced last year, his 2019 numbers are up to 36.2%. There was a concern over how Paxton, a fly ball pitcher, would adjust to the home run-friendly confines of Yankee Stadium, but we haven’t seen any problem yet; he’s posted a 0.78 HR/9 IP and 9.1% HR/FB rate so far. And he’s been one of the most valuable pitchers in all of the majors. As of May 2, his 1.5 WAR ranks third among all starters behind Max Scherzer and Matthew Boyd. All in all, he’s having a pretty good season. So what has led to the improvement?

Looking at his pitch usage, we don’t see a huge overhaul, but there is a notable change. Read the rest of this entry »


Tyler Glasnow, Aflame

When a meteoroid strikes the top of the Earth’s atmosphere, it’s traveling at an unthinkable speed — something like 30 miles per second. Though it’s initially as cold as the void of space, the friction of striking the atmosphere creates intense heat. The thermal energy is sufficient to vaporize it, layer by layer. If the meteoroid survives long enough to strike the Earth’s surface as a meteorite, its outer layer will be blackened beyond recognition. I learned all this on Wikipedia today, because I wanted to understand what it must be like to face Tyler Glasnow.

Tyler Glasnow is a singular pitcher. He stands 6-foot-8, one of only three current major league pitchers that tall. He throws a 97.4 mph fastball. Among starters, only Noah Syndergaard throws harder. It’s not so much that Glasnow releases the ball tremendously high in the air; he’s a long strider, which lowers his release point. It’s more that there’s no one in baseball who throws quite like Glasnow throws — at extreme velocity, with extremely long levers, from a unique release point. Glasnow’s perceived velocity is second only to Jordan Hicks — his fastball explodes towards batters.

As if that weren’t enough, Glasnow’s curve has long been above-average. Want to know how long this has been the scouting report on Glasnow? Take a look at what Eric Longenhagen had to say about him before the 2017 season: “Glasnow’s scouting report has read the same way for the last four years. He throws hard, has touched 100 in the past (I have him maxing out at 97 this year) and spins one hell of a curveball — a potential plus-plus curve, in fact.”

The knock against Glasnow has always been control. In the minor leagues, he often ran double-digit walk rates, and when he got his first extended playing time in the majors in 2017 he walked 14.4% of the batters he faced. Glasnow was a project — and there was hope that his command would come. Here’s Longenhagen again: “That said, there are reasons for patience with the command. Glasnow’s velocity exploded in pro ball, and it’s not easy for someone to quickly learn how how to harness and command that kind of newfound arm speed — and even more difficult when the prospect in question is built like a giant whooping crane.” Read the rest of this entry »


April Attendance Was a Mixed Bag for Baseball

A year ago, warning bells rang out across the league as attendance dropped precipitously in April, down nearly 3,000 fans per game from the previous season and about 2,500 fans per game from the April average from 2014 through 2017. The rough April came on the heels of a 2017 season that finished rather meagerly as well. From 2014 through 2016, total average attendance at the end of the season gained over 1,300 fans on average compared to the April numbers. But in 2017, the league added fewer than 500 fans per game in the summer months, ruining a once-promising season at the gate. A lackluster summer followed by a disappointing April was worrisome, though the weather might have been a factor. As it turned out, the summer made up a lot of the ground lost in April, but attendance still fell by 1,237 fans per game. This April has been met by slightly better weather, but attendance has not improved, and without a great summer, we might see a pretty big loss at the end of the season.

Before comparing previous seasons, here’s home attendance per game by team so far this season.

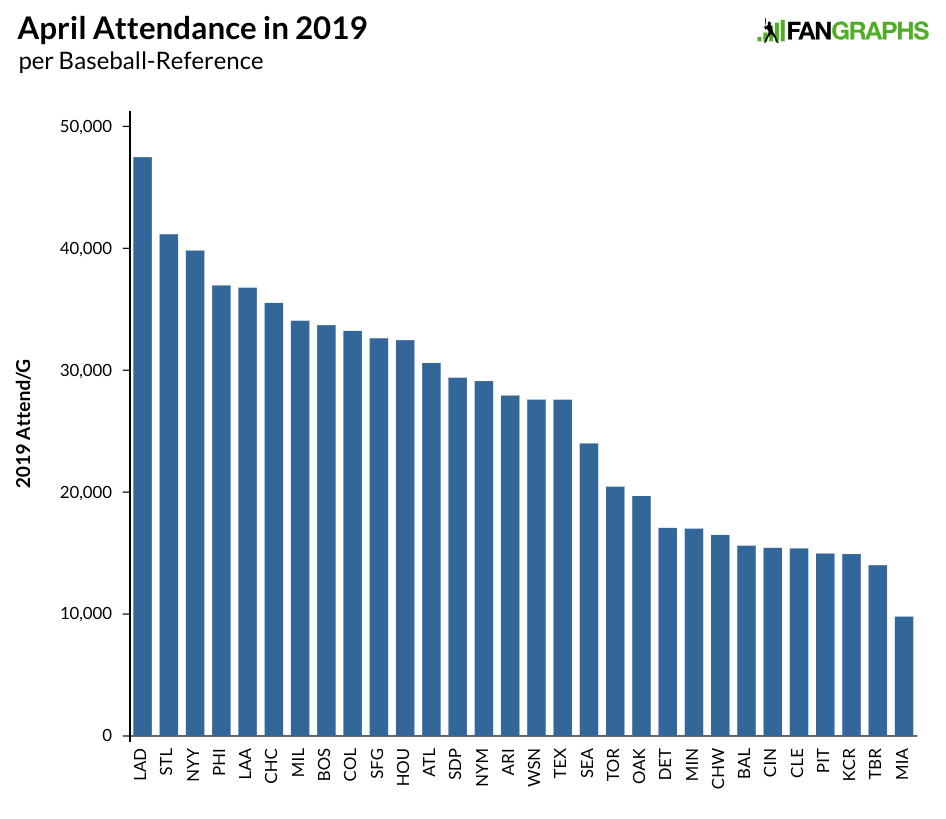
We see mostly what we would expect near the top, with the Dodgers, Cardinals, and Yankees checking in with the best attendance. The Dodgers and Cardinals have claimed the top two spots at the end of the season in each of the previous six seasons except for last year when the Yankees overtook the Cardinals for second-place. Philadelphia is benefiting from a decent record a season ago and a big offseason this winter, while the Cubs and Red Sox are still doing well, though they are limited by the size of their parks when it comes to attendance. They more than make up for it with the highest prices in the game. Milwaukee is hardly seen as a large market, but Brewers fans have long done a good job supporting their team, particularly when the team is successful. The most surprising absence from the top of this list is the Giants, who averaged over 41,000 fans per game from 2011 through 2017 and still had a fairly robust 39,000 fans last season but have dropped off pretty significantly. The Giants are coming off a very good run, and it is possible their fans and stadium might insulate them a little during a rebuild, but they will have to figure out how much losing they can stomach; the Phillies had half as many fans attend games in 2015 compared to 2010, and the Giants could be facing even bigger drops the next few years.

This next graph shows the change in attendance from last April.

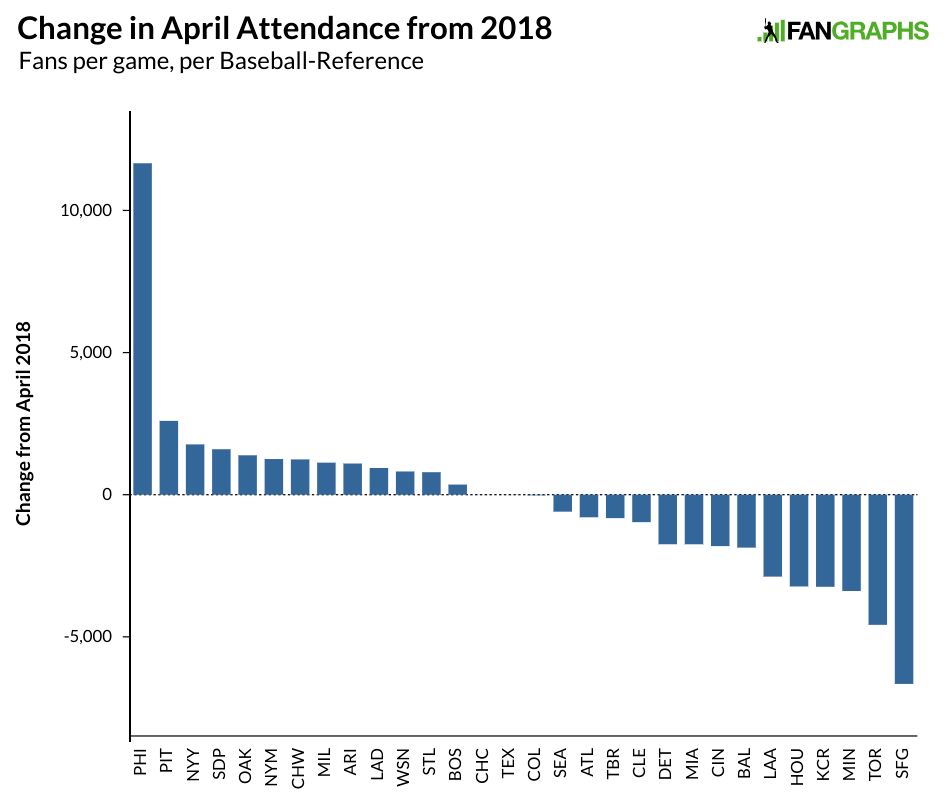
The Phillies created a fair bit of excitement in the offseason with trades and free agency, including signing Bryce Harper, and that excitement has translated to the box office. Nearly 200,000 more fans watched the Phillies this April compared to a year ago. The increase is bigger than the total attendance for five teams this season. A year ago, the Pirates traded away Andrew McCutchen and Gerrit Cole and saw a pretty significant attendance drop. Contending in July saw a decent increase as the season wore on and that has carried over to this season. The Yankees have seen more growth as they return to perennial contender status. Oakland and Milwaukee are seeing some gains after solid 2018 campaigns, while the Padres and Mets are seeing an uptick after making some big offseason moves.

At the other end of the graph, Houston is seeing a dip, but they were coming off a World Series win in 2017 that likely goosed attendance last year. Cincinnati not seeing more fans is a bit disappointing given their moves in the offseason. The Angels really need to start winning, though their overall attendance numbers are pretty good. Baltimore and Kansas City are seeing drops commensurate with their rebuilding status. The Twins were supposed to be good last season, but disappointed. They are off to a good start and it wouldn’t be a surprise if they end up with more fans than they did a year ago. The Blue Jays drew extremely well when they were in contention, but do much worse when they aren’t in the running. The team did see about 18,000 more fans during Vladimir Guerrero, Jr.’s debut weekend series compared to how they did for a weekend series against the Rays two weeks prior.

While the factors for attendance are numerous, it is possible that teams’ plans for rebuilding are creating more big drops than in season’s past. From 2013 through 2017, there were a total of six attendance decreases exceeding 5,000 fans per game over the previous season; there were six of those drops in 2018 alone, and we might be looking at two more this year. As for how much April numbers presage those at the end of the season, here’s how last year’s April attendance looks when compared to the end of the season.

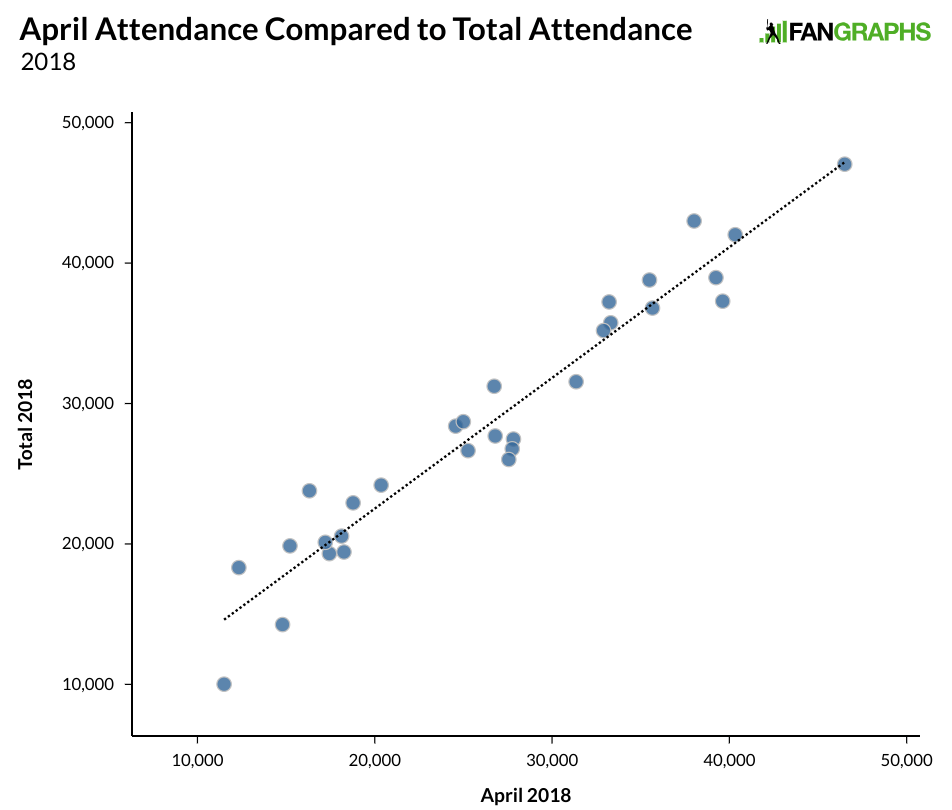
There are some minor outliers, but April numbers tend to do a pretty good job lining up with the rest of the year if you include a small increase from the April numbers. Last season’s poor April attendance numbers were bailed out a little by good numbers the rest of the way, but that is a bit of an outlier compared to the last few seasons, as the table below shows.

Attendance Gains After April
April Per Game End of Season Per Game Change
2014 28,900 30,346 1,446
2015 29,287 30,366 1,079
2016 28,,671 30,132 1,461
2017 29,430 29,909 479
2018 26,617 28,660 2,043
2019 26,361

If we only see an increase of 1,000 fans per game at the end of the season compared to April, baseball is going to lose more than three million fans in attendance. It’s possible slow winters have dulled early-season excitement for some fans, though some of the most active teams have seen pretty big rises this April. Some teams’ fans might be taking a wait-and-see attitude while others are simply staying away. Another factor in baseball’s overall attendance lag could be the lack of new stadiums, which tend to send attendance upward for a few years. The graph below shows attendance per game, and the number of new stadiums over the past 30 years. As new stadiums have stagnated, so has attendance.

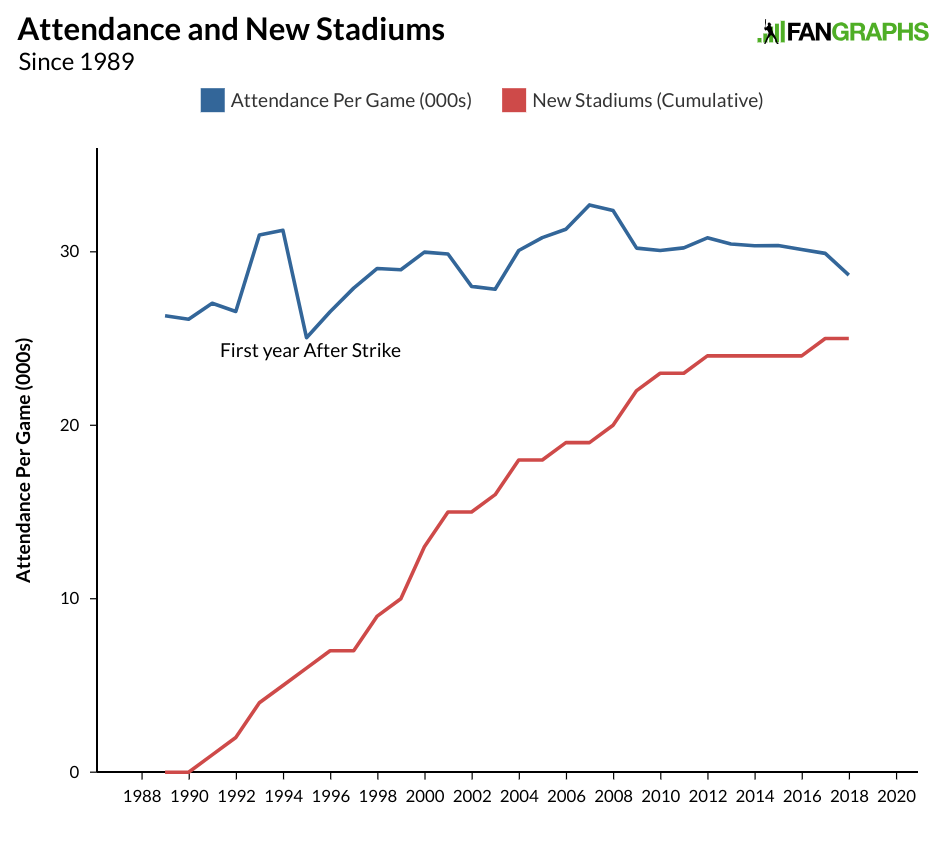
Attendance is still well above where it was in the 1980s, and it grew by 20% in the 15 years following the strike as a new stadium was built basically every year. But those gains have stopped, and are showing some signs of decline that very well could continue this season. Whatever teams are doing, whether it is the slow winters or the lack of expected competitiveness or the price of tickets, it isn’t attracting more fans at the ballpark. The teams that are doing well this season compared to last had active winters or just won a bunch of games. The sport needs to do whatever it can to cultivate new fans and to get them out to the ballpark because without them, the television money that has made baseball less dependent on attendance will eventually dry up as well. Generating excitement about a team, through wins and activity in the offseason, is the best way to get more people to buy tickets.


Losing Corey Kluber Isn’t What the Indians Needed

The 2019 season, already something less than a banner one for Corey Kluber, went from bad to worse on Wednesday night in Miami. A 102-mph comebacker off the bat of the Marlins’ Brian Anderson struck the 33-year-old righty on his right forearm — OUCH! — reportedly causing a non-displaced fracture of his right ulna. It’s the second major injury to hit Cleveland’s rotation, at a moment when the team already finds itself looking up at the Twins in the AL Central standings.

Trailing 3-1 with two outs and nobody on in the fifth inning, Kluber couldn’t get out of the way fast enough on Anderson’s line drive. He had the presence of mind to attempt glove-shoveling the ball to first base after being struck, and while he didn’t show signs of being in significant pain when the Indians’ training staff examined him after the play, he departed immediately nonetheless:

X-rays taken at Marlins Park revealed the fracture. Kluber will be reexamined in Cleveland on Thursday, at which point a timetable for his return will be determined. Since he’ll be shut down from throwing while the fracture heals, he figures to miss at least a month. His streak of five straight 200-inning seasons, the majors’ second-longest behind Max Scherzer, is probably over. Read the rest of this entry »


CC Sabathia Joins the 3,000 Strikeout Club

On Tuesday night in Arizona, CC Sabathia claimed a little slice of baseball history. With his strikeout of the Diamondbacks’ John Ryan Murphy, the 38-year-old Yankee became just the 17th pitcher to reach 3,000 for his career, the first since John Smoltz on April 22, 2008, and just the third southpaw ever, after Steve Carlton and Randy Johnson. It’s a milestone worthy of celebration, a testament to longevity, dominance, and tenacity. It’s also inextricably a product of this high-strikeout era, a point worth considering when placing Sabathia’s accomplishment in context.

But first, to savor the moment. Sabathia, who entered the night three strikeouts short of 3,000, collected all three in the second inning, first freezing David Peralta looking at a sinker, then whiffing Christian Walker on a high cutter. After yielding a solo homer to Wilmer Flores and an infield single to Nick Ahmed — the latter on an 0-2 changeup well outside the strike zone — he induced Murphy (who caught Sabathia’s 2,500th strikeout in 2015) to chase an 84.2 mph changeup:

Alas, while Diamondbacks starter Zack Greinke — himself a potential 3,000 strikeout club member, more on which below — held the banged-up Yankee lineup to a single run over 7.2 innings, Flores also added a fourth-inning RBI double off Sabathia. The big lefty departed on the short end of a 2-1 score, and the Yankees ultimately lost, 3-1, putting a mild damper on the celebration.

Of the major traditional milestones among pitchers and hitters, 3,000 strikeouts is the least common. Thirty-two players have notched at least 3,000 hits, and 27 have swatted 500 home runs. On the pitching side, 24 pitchers have collected 300 wins. Nearly all of the players who have reached any of those round numbers have been elected to the Hall of Fame, with the exceptions generally related to performance-enhancing drugs and other bad behavior. Among the members of the 3,000 strikeout club who have preceded Sabathia, only Roger Clemens and Curt Schilling remain outside, for reasons besides on-field performance. This could very well be the big man’s ticket to Cooperstown. Read the rest of this entry »