One of the things I try to emphasize when I talk about projections is that they’re not numbers written in stone, but an array of estimates that’s always moving. Each individual plate appearance or inning pitched, while not a needle-mover on its own, adds to our knowledge of a player and very gently changes his career trajectory. Forecasting a player isn’t all that different from forecasting a hurricane, but thankfully, players cause a lot less mayhem. Except maybe Len Koenecke.
It’s been three months since the start of the season, and we have a lot of new information about players. Since we’re approaching the halfway point of the season, and the fact that I’m getting a few dozen chat questions a week about which players have seen their projections change the most, I thought this would be an appropriate time to do an in-season ZiPS run with the full-fat model that is too compute-intensive to run every day. To keep the list relevant to 2026 MLB goings-on, I narrowed it to players who either have played in the majors this year or are one of the 1,232 prospects on The Board. So my apologies to players such as Tre Richardson III, whose projected 2027 OPS+ has improved from 54 to 74. I’ve ranked the players by the largest changes in projected 2027 OPS+ compared to what it was in the preseason. Read the rest of this entry »
Glen Perkins had a successful four-season stint at the back end of the Minnesota Twins bullpen. From 2012-2015, the St. Paul-born southpaw was credited with 12 wins and 118 saves while posting a 2.93 ERA over 254 appearances comprising 251 2/3 innings. Moreover, he was an All-Star in three of those campaigns. A mixed-results starter earlier in his career, Perkins ultimately finished with a 35-25 won-lost record, 120 saves, and a 3.88 ERA over 624 1/3 frames while pitching exclusively with the Twins from 2006-2017.
He now serves as one of the team’s broadcast analysts, providing insight befitting a reputation he had during his playing days. Perkins was rightly regarded as one of the game’s most analytically inclined pitchers.
How well does the left-hander remember his matchups against big league hitters? Let’s just say that Perkins’ power of recollection is every bit as impressive. He proved as much when he sat down recently for the eighth installment of our Challenging Career Quiz, a series that had thus far comprised Geoff Blum, David Cone, Mark Grant, Mark Gubicza, Jeff Montgomery, Dan Petry, and Steve Sparks. (Links to those pieces can be found on their player pages.)
I began by asking Perkins to whom he surrendered the most hits. His first two guesses, Miguel Cabrera (seven hits) and Carlos Santana (eight) were both wrong. He then correctly named Paul Konerko, who had 11. What does the southpaw remember about the erstwhile Chicago White Sox slugger?
“I had two different careers,” Perkins replied. “I was a starter and gave up a bunch of hits, then I was reliever and didn’t give up nearly as many. Pauly probably got me a bunch when I was a starter, although I do think I did well against him when he was still closer to his prime. I remember that the last year he played [2014] he mostly just hit singles. He had a little short swing and just punched the ball. He didn’t do any damage, but he did have some hits against me.”
Perkins was spot-on with his recollections. Konerko had five singles in six trips to the plate against him that year. He had previously gone 6-for-24 with a pair of doubles and a home run.
A batter who did do damage against Perkins was Santana. The still-active, 40-year-old switch-hitter went 8-for-13 with two doubles and four home runs. Perkins promptly named him when asked who took him deep most often. Read the rest of this entry »
Hello! This year marks 21 seasons of FanGraphs, and as we look ahead to the August 5 anniversary of our launch, I wanted to thank you for reading and visiting the site. And, as has become an annualtradition, I also wanted to provide you with an update on the state of FanGraphs.
I started last year’s version of this piece by listing all of our new features and site improvements. As this year’s list is even longer, instead of detailing everything up front, I’ve included a Feature Appendix at the bottom of this post. Take a look – it’s quite a scroll. What I was struck by as I was compiling that list is just how much we’ve been able to accomplish with our Members’ support, support that has translated into new features, voices, data, and other random fun stuff you didn’t even know you wanted. From the written work of our dedicated team of baseball experts to all the stats and leaderboards, the data and fantasy tools to the prospect analysis, the projections, RosterResource, the mobile app, the podcasts, the chats — the depth and breadth of the site is very special. Plus, we do it all without private equity funding or sports betting partnerships, allowing us to produce the independent analysis and high-quality tools you’ve come to rely on.
And while I think the future of FanGraphs is bright, I also think it’s worth talking about the realities of running a sports media site in 2026, the challenges we see looming, and why your support matters more now than it ever has before.
First, if you are a FanGraphs Member, thank you so much for your continued support. Membership is set to account for about 80% of our revenue this year. Six years ago, that number was about 25%. Still, our Members only make up about 2% of what we believe to be the real-life human visitors to the site. We want our work and data to be accessible, but we’re up against a number of challenges.
Data Is More Expensive
FanGraphs isn’t free to operate. We don’t scrape data, opting instead to maintain agreements with all our data providers. This has been our model from day one, both because I wanted FanGraphs to be sustainable and for our data to be reliable, and because people deserve to be paid for their work. This strategy seems to have worked out, but it comes at a cost. Our data costs have nearly doubled over the past five years. At the same time…
Advertising Revenue Is Down, While Bots and Scraping Cost Us More
Our advertising revenue has decreased 50% since 2024. There are multiple factors at work here, some of which are good. We’ve decreased the number of ads on some pages, and our Members enjoy a fully ad-free experience as one of their Member benefits. But as I mentioned, even with the growth we’ve seen, Members only account for about 2% of our total users, and there is a massive discrepancy between the ads served to non-Members and the number of pageviews we’ve served. This May, multiple site analytics tools we use claim we served about 12 million pageviews to non-Members; ads were served on just 2.1 million of those pageviews. That’s only about 18% of pageviews, compared to 51% two years ago. That’s a staggering amount of missing ad revenue.
Non-Member Pageviews/Pageviews With Ads
Time Frame
Total Pages
Pages with Ads
% With Ads
May 2024
6.9M
3.5M
51%
May 2025
7.5M
2.5M
33%
May 2026
12M
2.1M
18%
Two things are likely happening here. First, we’re seeing a lot more bot traffic, which often doesn’t register as the sort of browser session that advertisers care about. We estimate that at least 60% of all traffic coming to FanGraphs is from non-human sources, including web crawlers, AI bots, and scrapers. In addition to the decline in ad revenue, this has led to increased server costs and us spending valuable time figuring out where the offending traffic is coming from in order to keep the site operational.
Second, folks are much more apt to use ad blockers these days, so while our overall site traffic hasn’t declined, our non-Member users are seeing ads at much lower rates. This creates the untenable situation where we’re serving up more content, but also serving up fewer ads because those ads are either being blocked, or the thing using our resources isn’t even a person.
Those are some of the challenges we face right now, but the landscape we operate in also has some big potential shocks on the horizon, one likely to affect digital publishing more generally, the other specific to baseball.
The Impact of AI
First, I’ll take this opportunity to share our editorial policy around the use of AI. All of the editorial content at FanGraphs is written entirely by the members of our staff, without any assistance from generative AI models, and that will remain our policy going forward. You don’t come to FanGraphs to read ChatGPT’s analysis, and there’s no way it could come up with the headlines Michael Baumann does.
And while the development team has found AI to be a useful coding tool, we don’t use it to create stats or metrics, or ask it to source the data displayed on the site. I have no interest in Claude hallucinating Jacob Misiorowski’s strikeout rate or average fastball velocity (though you’d be forgiven for wondering if either is real).
Of course, AI’s impact goes beyond the need for code checks or an editorial policy. Put simply, AI is taking our content and repurposing it in a way that could make it so that there’s no need to actually visit the site. Indeed, changes to many popular search engines mean many people unfamiliar with FanGraphs might not even discover the site in the first place. Just think about the AI results you see on Google. How many people are going to click through to our Brewers Top Prospect list, a piece that took days to write and edit, when Gemini will serve up much of Jesús Made’s scouting report, tool grades and all? If there’s ever been an existential crisis for online publishers, it’s this. Whether it’s Membership or advertising revenue, our business model depends on visiting the site, and AI seems poised to keep people away, eroding the link between writers and readers.
Baseball’s Looming Lockout
The precise impact of this winter’s seemingly inevitable lockout is tough to gauge, as it will greatly depend on how long it takes MLB and the Players Association to reach an agreement. But if the pandemic and the last lockout taught us anything, it’s that not having major league baseball isn’t great for a baseball media site. We saw our traffic dip 50% during the 2021-22 lockout. The support of our Members helped us weather it, but it was a challenge, and if we were to lose an entire season, I’m not sure what it would mean for FanGraphs without significant Membership growth.
So what should you take from all of this? Well first, become a FanGraphs Member! Membership allows us to continue to grow and improve the site, providing a source of revenue that’s immune from macro forces like AI or baseball’s labor dispute, and that’s more stable than advertising. We’re in a moment where it’s incumbent upon all of us to support the writers, artists and publications we love, or risk losing them. Obviously I hope FanGraphs is on that list for you, but this isn’t just a FanGraphs thing. Unfortunately, the era of good free content is over. Ultimately, the advertising model syphoned a shocking amount of money away from publishers to middlemen and tech giants, and AI is threatening to destroy one of the most reliable ways for us to surface our work to new readers. But your direct support puts you in the driver’s seat. It’s not what SEO wants, or AI wants, or what the advertisers want. It’s what you want.
Our pledge to you is that if you support us, we’ll keep producing all the great baseball analysis you’ve come to rely on, and continue to grow the site in new and interesting ways, just like we have for the past 21 years.
Late last week, Major League Baseball proposed to drastically change the game’s player developmental system. Beginning in 2028, the domestic draft would be cut from 20 rounds to 12, and eliminate eligibility for high schoolers — players would need to be at least 20 years old and two years removed from high school to be drafted. Players who choose to play for a JUCO school would need to do so for both seasons, rather than the one-year requirement currently in place. Most players at a four-year college would become draft eligible a year earlier under MLB’s new proposal; right now, they are not eligible for the draft unless they turn 21 by August 1 of their draft year or until after their third year a four-year college. MLB’s proposal would move the age cutoff date back to September 1. More than 40% of the dollars would be pared from the draft pool, with the most recent $358.7 million available slashed to $200 million.
On the international side, MLB proposed instituting a new draft, an idea originally discussed during the last set of CBA negotiations. The draft, which would begin in 2027, would require players to be at least 18 years old by September 1 of their draft year. The draft pool would stay mainly intact otherwise, with the same $200 million available for international draftees as domestic ones, pretty close to the nearly $199 million that was in the final draft bonus pool in 2025.
We don’t need to do any detective work to figure out where the savings go. As was the case with the league’s parallel salary cap proposal, which management disingenuously promoted as a way to improve competitive balance, this proposal is part of the ever-continuing quest of owners to transfer money from the players’ pockets to their own. Based on pretty much every example ever, the money saved will not offset consumer costs, and I’d be shocked if it was redirected to improve the pay of team staffers, who tend to take in reduced salaries for the privilege of working in baseball, or minor leaguers.
J.J. Cooper covered the proposal in greater detail over at Baseball America, so I won’t go too in the weeds on it here today. Instead, I want to spotlight how much money the proposal would cost the game’s top players. Read the rest of this entry »
If you clicked through to read this post, you’ve probably visited the ABS Challenge Leaderboard on Baseball Savant at some point this season. While you were there, you may have sorted by Won% to see which players have been the most successful with their challenges. And if you, like me, are a bit of hater, you also reverse sorted to see which players are now considered a fire hazard because of how rapidly they burn through challenges. In that case, you know that James Wood has won just 20% of his 15 challenges, that Josh Naylor owns a 25% success rate on 12 challenges, and that Jazz Chisholm Jr. has a 27% hit rate on his 15 challenges. Players this bad at picking their spots probably shouldn’t be allowed to challenge at all, right? Well the truth is, those samples probably aren’t large enough to definitively signal an inability to consistently win ABS challenges. Or maybe they are large enough, but it’s tough to say for sure because the ABS challenge system hasn’t been in place long enough to generate the volume of data needed to determine an appropriate sample size.
But even if there were absolute certainty about which players lack the eye for challenging ball/strike calls, sitting a player down and telling him he’s not allowed to challenge anymore because he sucks at it isn’t exactly the best strategy. It runs the risk of damaging the relationship between the player and the team and it shuts down the opportunity to improve with additional reps. And let’s say that player is in the box for a pitch that absolutely should be challenged — given the short window to challenge following a call, a batter paralyzed by self-doubt or concern over potential reprimand is set up to fail. It’s also much easier to communicate and get buy-in on a single, team-wide philosophy than it is to devise a bunch of player-specific exceptions to the rule.
The good news is that there’s a straightforward method for eliminating many of the most infuriating failed challenges, a method independent of any given player’s ability to judge whether a pitch was in the zone. Because there’s more to challenging than assessing whether a ball/strike call is correct and then assigning a level of certainty to that assessment. If you’ve ever watched a batter on your favorite team spend a challenge on an 0-0 count in the first inning, you know that it’s vexing on multiple levels. Even a successful challenge in that scenario doesn’t offer a significant swing in advantage, since it’s just flipping an 0-1 count to a 1-0 count (a swing in run expectancy of about a tenth of a run, depending on the base-out state). And to make things even more maddening, it also tightens the calculus around future challenges, since an additional failed challenge risks leaving the team unable to act on a potential missed call in a late-and-close situation. Read the rest of this entry »
George Lombard Jr. is bound for The Bronx — or maybe Motown? According to the New York Post’s Jon Heyman, the Yankees’ top-rated prospect is being targeted by the Tigers in a potential trade for Tarik Skubal. Swap or not, the 21-year-old shortstop has a bright future. A first-round pick in 2023, Lombard Jr. has come to the plate 287 times this season between Double-A Somerset and Triple-A Scranton Wilkes-Barre and is slashing .258/.387/.446 with eight home runs and a 124 wRC+. Moreover, he was scorching the ball prior to being placed on the IL with sprained fingers on his glove hand this past Thursday. Over his previous eight games he had gone 11-for-30 with seven doubles and a pair of round-trippers.
How has the son of former MLB outfielder, and current Detroit Tigers bench coach, George Lombard changed since I interviewed him late in the 2024 season?
“From a physical standpoint, the stance and setup are a little different,” Lombard Jr. told me last month. “But it’s more the mental side. Compared to then, I have a more complete understanding of my swing, how my body moves, my tendencies, and what I need to do to stay in a good place. Most of the change has been mental maturity.”
Asked to elaborate on the physical, he replied that he has changed his hand positioning in an effort to get to ”the firing spot” more efficiently. That adjustment came over the offseason. Read the rest of this entry »
Last season, despite his team’s struggles, Byron Buxton set career highs in plate appearances (542), home runs (35), runs (97), RBI (83), hits (129), and WAR (5.0). He only played in 126 games, his second-highest single-season total, because he made two separate trips to the injured list. We saw enough of him in 2025 to appreciate his astonishing abilities, yet at the same time, his presence was a reminder of the career that might’ve been if only he hadn’t gotten hurt so much.
Fortunately, Buxton is healthy again this season. As of Friday morning, he has played in 64 of the Twins’ 76 games this year. That might not seem like a lot, but that works out to a pace of 136 games. Crucially, despite dealing with a few minor injuries, he has avoided the IL so far in 2026. He’s on track to hit 49 home runs and accumulate just shy of 6 WAR. ZiPS and our Depth Charts both project him to slow down a little bit, but they still peg him for at least 45 homers and right around 5 WAR. That would be an impressive season for anybody, but especially for an injury-prone 32-year-old center fielder.
That bit on Buxton is all you’ll hear from me this weekend. I’m on vacation as you’re reading this, and Meg Rowley is handling mailbag editing duties while I’m gone. This week, we’re answering your questions on Juan Soto’s slower swing speed, the teams that have the greatest all-time differences between player WAR and franchise wins, and whether an American League team will make the playoffs with a losing record. But first, I’d like to remind you that this mailbag is exclusive to FanGraphs Members. If you aren’t yet a Member and would like to keep reading, you can sign up for a Membership here. It’s the best way to both experience the site and support our staff, and it comes with a bunch of other great benefits. Also, if you’d like to ask a question for an upcoming mailbag, send me an email at mailbag@fangraphs.com. Read the rest of this entry »
On April 15, Zach Neto was at the plate with one out and nobody on in the top of the fifth inning of the Angels’ game in the Bronx, where his team trailed the Yankees, 3-2. The first two pitches, a low changeup and a high slider, were nowhere near the zone, and Neto laid off easily. The 2-0 pitch from Luis Gil was another slider, this one about belt high and bending away from the right-handed Neto, who kept the bat on his shoulder and watched as the pitch appeared to clip the outside edge of the zone. Home plate umpire Lance Barksdale held up his hand. Strike one. Neto tapped his helmet immediately to challenge the call.
The graphic on the gigantic video board in center field showed that the pitch had missed by 0.4 inches. The call was overturned; the count was now 3-0. Neto walked on the next pitch. Mike Trout stepped in, took a fifth straight ball from Gil, then let a four-seam fastball over the heart of the plate get deep on him. He unloaded, clobbering the cookie 383 feet into the right field seats for a go-ahead two-run blast.
The no-doubt Trout clout would have been the decisive blow in an Angels win if not for a misplayed popup and a Jordan Romano meltdown. The Yankees walked it off on a José Caballero single, relegating Neto’s challenge to a footnote in that night’s game story, if it was mentioned at all. Even so, the gamble was an early example of how the new automated ball-strike challenge system can make the difference between winning and losing a game. Read the rest of this entry »
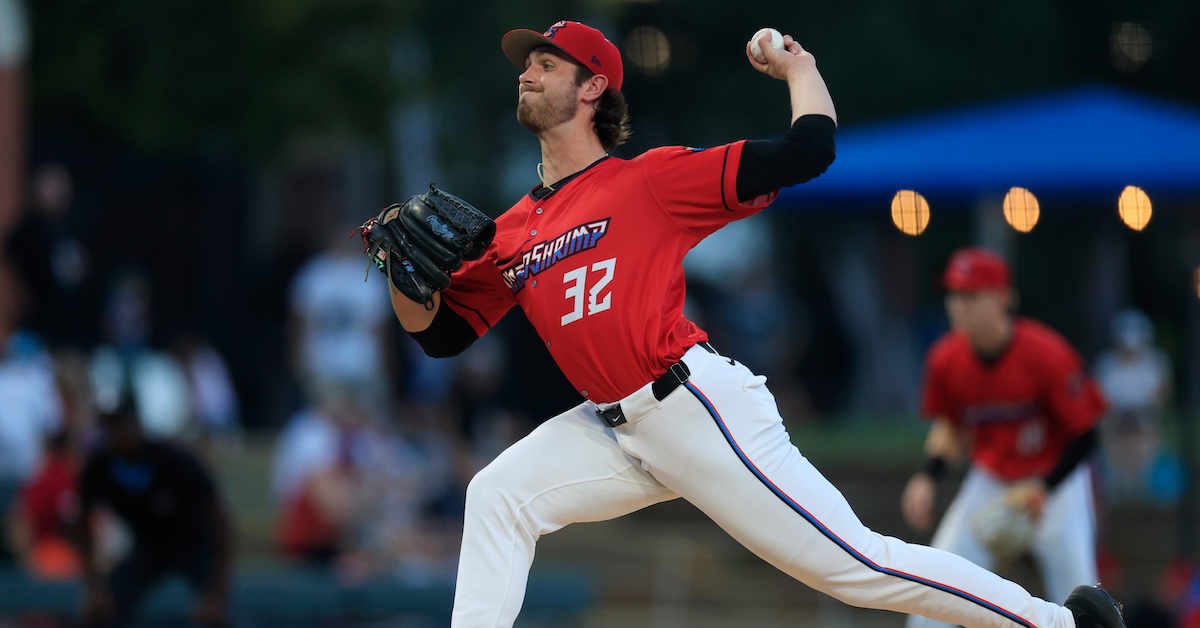
Thomas White Photo: Corey Perrine/Florida Times-Union/USA Today Network via Imagn Images
Below is an analysis of the prospects in the farm system of the Miami Marlins. Scouting reports were compiled with information provided by industry sources as well as my own observations. This is the sixth year we’re delineating between two anticipated relief roles, the abbreviations for which you’ll see in the “position” column below: MIRP for multi-inning relief pitchers, and SIRP for single-inning relief pitchers. The ETAs listed generally correspond to the year a player has to be added to the 40-man roster to avoid being made eligible for the Rule 5 draft. Manual adjustments are made where they seem appropriate, but we use that as a rule of thumb.
A quick overview of what FV (Future Value) means can be found here. A much deeper overview can be found here.
All of the ranked prospects below also appear on The Board, a resource the site offers featuring sortable scouting information for every organization. It has more details (and updated TrackMan data from various sources) than this article and integrates every team’s list so readers can compare prospects across farm systems. It can be found here. Read the rest of this entry »
On April 21, Grant Anderson inherited a hot mess. With the Brewers ahead 3-0 in the fourth inning, starter Kyle Harrison lost his feel. He walked Riley Greene and Spencer Torkelson in two uncompetitive plate appearances, then gave up a rifled line drive on one of his slowest fastballs of the day, a center-cut cookie to Hao-Yu Lee. Pat Murphy called Anderson in from the bullpen to face the bases loaded with no one out.
Anderson delivered nearly flawlessly. He got Javier Báez to ground into a first-pitch double play, then struck out pinch-hitter Kerry Carpenter to escape the inning with only a single run allowed. That run, of course, went on Harrison’s ledger. Anderson got credit for a scoreless inning, no more or less.
On May 16, Chase Silseth tried to pull off the same trick. José Soriano fought through five strong innings against the Dodgers, but he didn’t have it in the sixth. After an inning-opening groundout, he walked four of the next five batters and hit the fifth, driving in two runs and leaving the bases loaded. Silseth came in to put out the fire – but he might as well have poured kerosene on it. He hit the first batter he faced, then gave up a two-run single immediately after, pushing the score to 6-0. He finally got the last two batters of the inning – which meant that in the game’s official log, he pitched two-thirds of an inning and didn’t allow a run.
These two pitching performances went quite differently. Anderson had a tougher task and performed better. But the two of them each got credit for a clean sheet. This is far from the only problem with the way we calculate ERA, but it’s one that stands out to anyone following. Anderson and Silseth didn’t deserve the same counting statistics there. Likewise, Soriano got tagged for three runs, while Harrison got tagged with only one. But that didn’t reflect what happened to them – both of them lost it and had to be removed from the game because of all the runners they’d allowed. Read the rest of this entry »