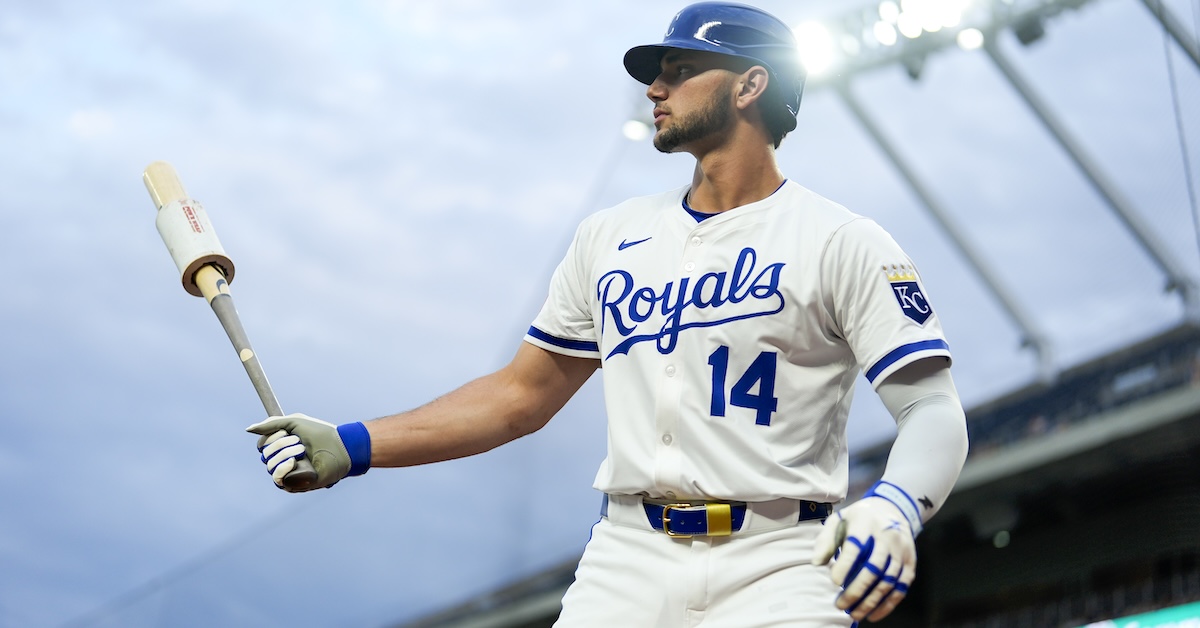
The Kansas City Royals are my dark horse team for 2026. They managed not only to make the playoffs in 2024 but also to win a round despite not having anything resembling a playoff-quality offense, and then went a respectable 82-80 in 2025 even after losing ace Cole Ragans to a rotator cuff strain and watching no. 2 starter Seth Lugo start to suffer the effects of age.
Heading into 2026, the Royals have a deep pitching staff and more good position players than they’ve had at one time in at least 10 years. Maikel Garcia and Bobby Witt Jr. are baseball’s best left-side-of-the-infield duo, and Vinnie Pasquantino is pretty good too. If not for the giant sucking maw at second base, the Royals infield would be among the best in the majors.
Still, they could, as ever, use another thumper. Witt is the team’s only truly transformative offensive player, and while Kansas City has bolstered the lineup with the addition of Isaac Collins, it had only four players last season with double-digit home runs. That’s the lowest total in baseball; 27 teams had at least six such players, 16 had eight, and four had 10.
One of my favorite sports movie tropes is the Scrappy Underdogs Who Discover the Power of Friendship. While there are myriad variations on the theme, the basic template involves a group of lovable losers facing off against some big baddie and initially being humiliated. As the movie goes on, the various underdogs unite against their common foe, and through determination, grit, moxie, and typically some shenanigans, they meet their antagonists again, only on more even footing. Ideally, our ragtag band emerges victorious, but even if they don’t, they’ve at least learned something about themselves and friendship, often earning the grudging respect of their rivals along the way.
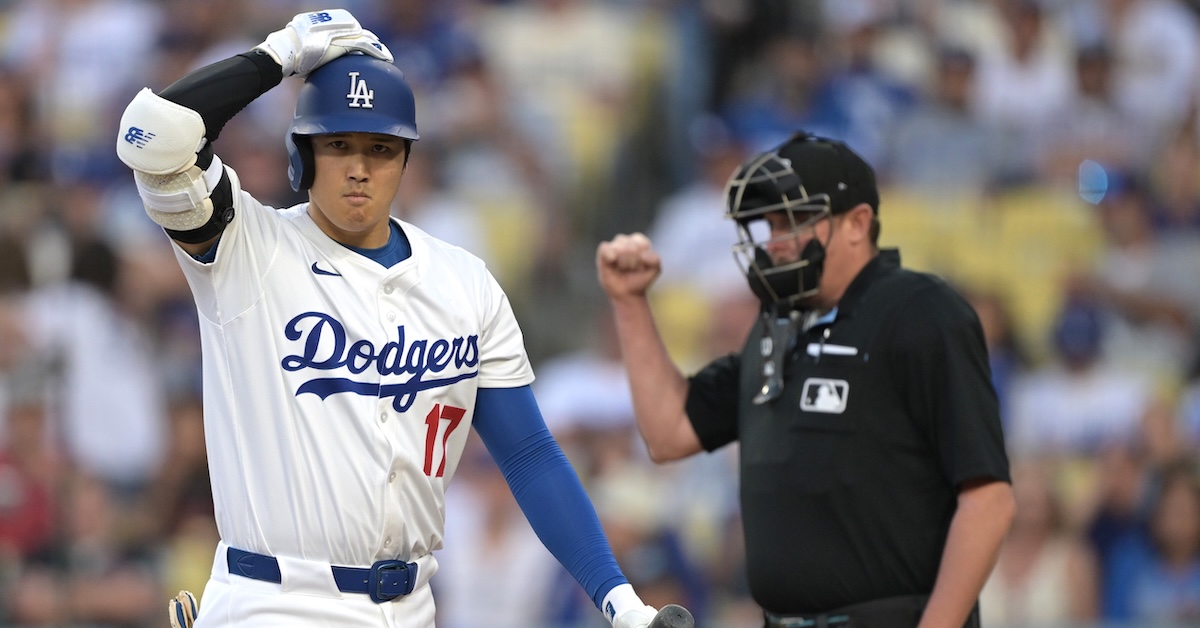
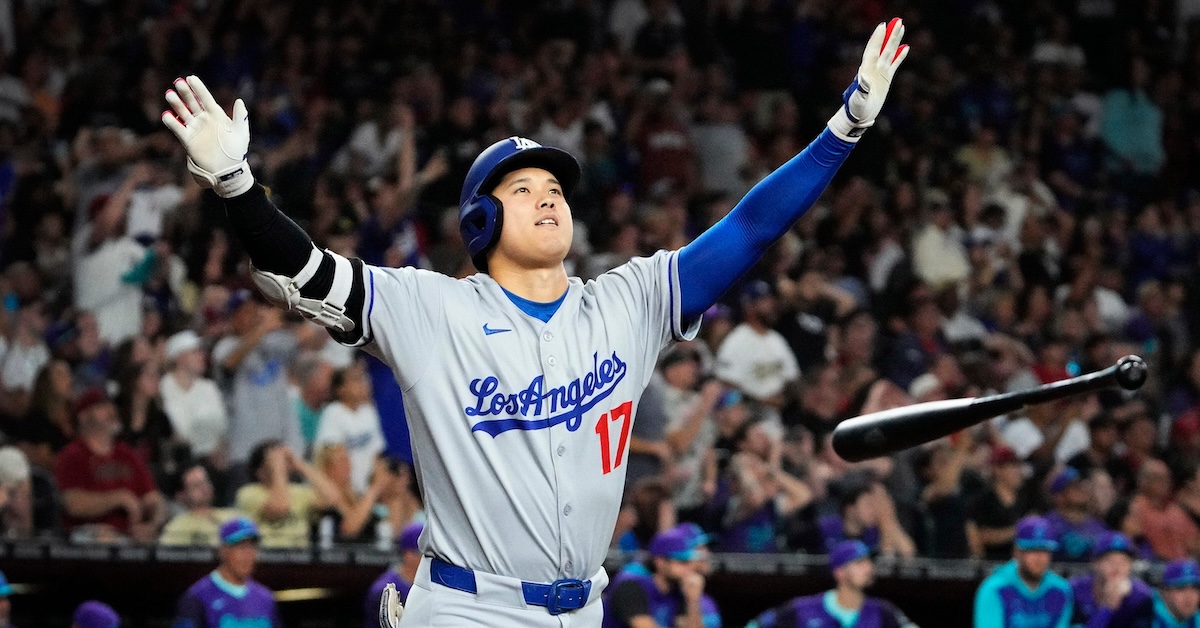
The Yankees were once baseball’s Evil Empire, but these days, the Dodgers reign supreme. They’re rich, they’re smart, they play in a ritzy city, and they would definitely look down on the kids at the ramshackle summer camp across the lake. As it has in most recent seasons, ZiPS projects the Dodgers to be the best team in baseball, and the newly-released FanGraphs Playoff Odds agree. But baseball needn’t accept its projected fate. It’s time to fight back! It’s time to unite some scrappy underdogs — at least on a spreadsheet. And so, with a tip of the hat to Tom Tango, whose theoretical inspired me to put together this piece, to the computer!
To construct our ragtag squad, we’ll start with the worst projected team in baseball, the Rockies, and ask ZiPS to build the best 26-man roster it can to square off against the Dodgers in a fictional seven-game World Series. I’m looking for two probability thresholds here: A Fighting Chance (a one-in-three shot of winning the series) and the Hunter Becomes the Hunted (the underdogs pass the 50% mark). If a roster made entirely of Rockies fails to meet these thresholds, then the players from the next-worst projected team will join the pool. We’ll keep repeating the process until our heroes emerge victorious. Read the rest of this entry »
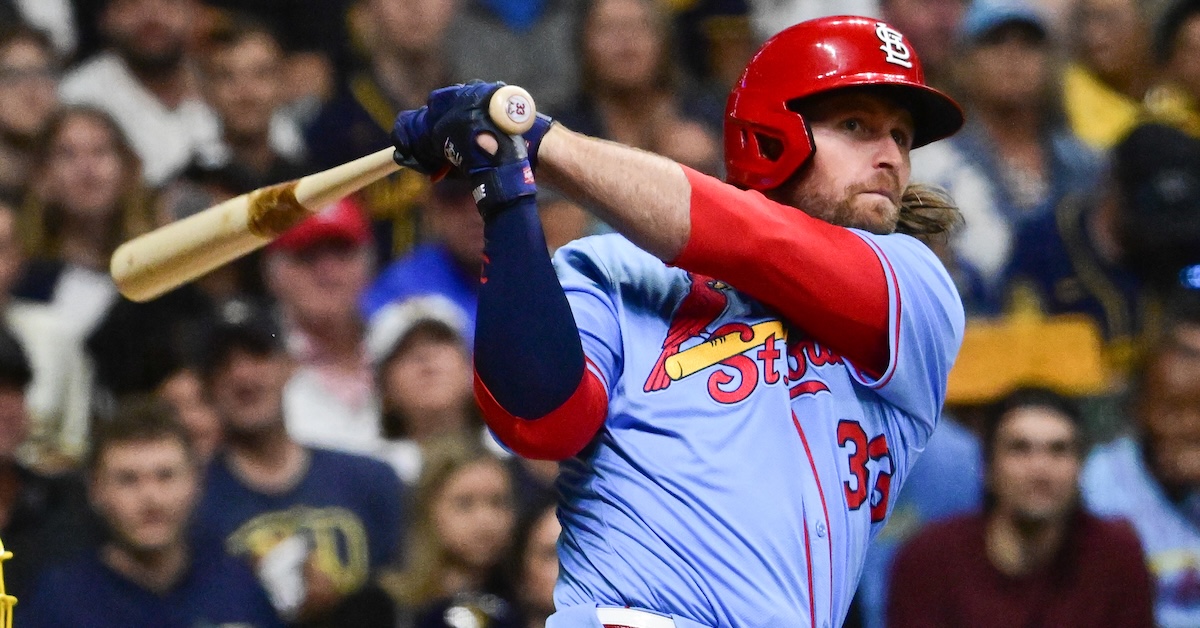
The first thing Chaim Bloom did after taking over baseball operations in St. Louis was trade away everything that wasn’t nailed down. Sonny Gray? Thanks for your contributions, now go try to win a ring in Boston. Willson Contreras? Gone, and to the same team. Nolan Arenado? Thanks for the memories, enjoy the desert. With those trades sorted, he’s moved on to step two: prying up some of those aforementioned nails to make more deals. The most recent shoe to drop in the Cardinals retooling might be the biggest one, though. Brendan Donovan is now a Seattle Mariner, the key piece in a three-team trade that sends Ben Williamson to Tampa Bay and a heaping helping of prospects and draft picks to the Cardinals.
Donovan isn’t a household name like many of the best Cardinals of recent years, but that has far more to do with the team’s middling success of late than any lack of talent. His combination of versatility and offensive firepower calls to mind Ben Zobrist, and unlike almost every other flexible defender who gets compared to Zobrist, this one actually makes sense. Zobrist ran a 121 wRC+ during his seven-year peak. Donovan’s career mark is 119, the same as his 2025 total. He’s under team control for two more years at a reasonable rate, too: $5.8 million this year, with his last trip through arbitration set for 2027.
“A plus bat who can play defense everywhere” generally isn’t a good title to have applied to you. That’s because most of the hitters who receive that label either aren’t plus bats, don’t play good defense, or both. But as I mentioned, that’s not Donovan, and we might as well examine each of those two skills, as he’s the entire reason this trade happened, the best player going to any of the three clubs by a mile. Read the rest of this entry »
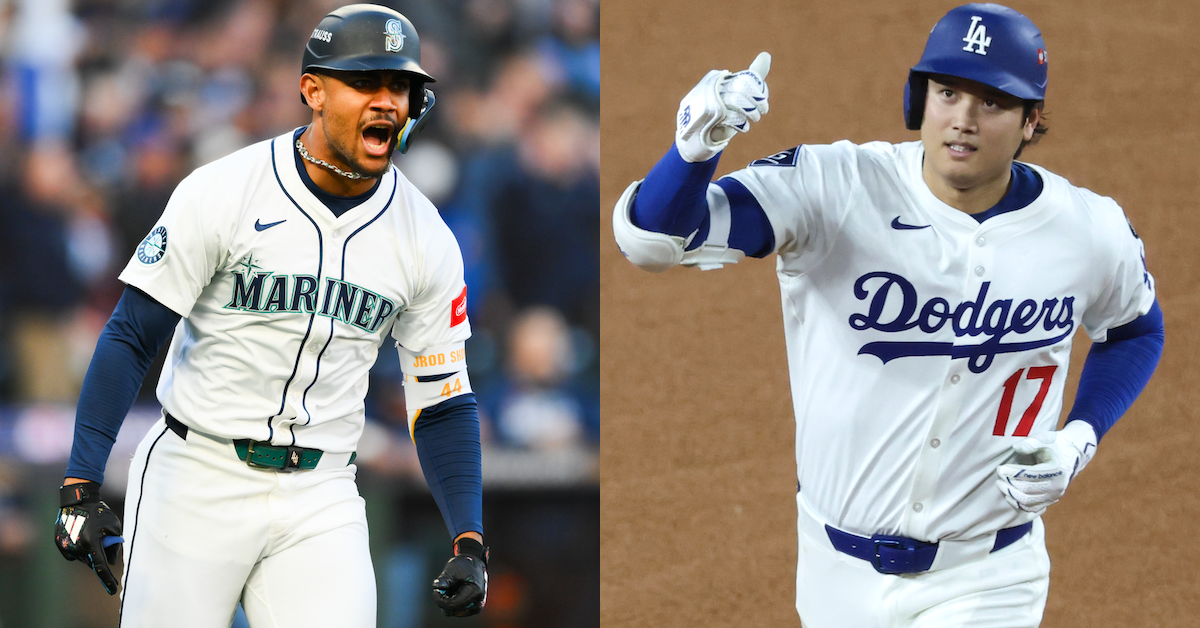
Every February, a series of rituals brings baseball back from its wintry break. Pitchers and catchers report. Spring training starts. My dad calls me to tell me Rogers Hornsby’s quote about the offseason. FanGraphs releases its initial run of its Playoff Odds.
Maybe that last one isn’t as ingrained in baseball culture as pitchers and catchers reporting, but it sure gets me excited. So much offseason analysis is hot air – This new hitter is great! We like him! And have you seen their new pitcher? – that I get the feeling that every team got better. Until we plug them all into a big old spreadsheet – well, a metaphorical spreadsheet; the projection system lives in the cloud – we don’t know how each team’s annual roster overhaul, along with the natural ebb and flow of talent over time, coheres into a new competitive landscape. In the cold light of computer-generated projections, it’s easier to see which offseasons clicked and which fell short, who’s playing for tomorrow and who’s ready to win today.
The winter isn’t over, to be clear. Among the top free agents, Framber Valdez is still unsigned, and there are other difference-makers available as well. The trade market is heating up. Inevitably, there will be injuries throughout the spring, and at least a few rookies will force their way into the playing time picture. Our odds will update to reflect all of that; you can find more about how the odds are generated here. Today, though, we can only speculate based on what we know. Here are six takeaways, one for each division, from our initial odds release. Read the rest of this entry »
In his pitch models piece, Davy outlined in four bullet points what happens when one team gains an edge over the others:
Teams realize the immense value of a skill.
An arms race ensues as they scramble to cultivate it.
The skill becomes widespread across the league.
Since the skill is more evenly distributed, it loses much of its value.
“The second we gained the ability to calculate the value of catcher framing, everybody started working on it,” he wrote. No longer was Ryan Doumit allowed to work behind the plate once it became clear he was capable of leaking 60 runs of value in a single season. Davy produced this helpful plot to demonstrate this convergence of catcher framing value, the Competitive Advantage Life Cycle in action:
All the teams are smart now. Even the Rockies might be smart! Even in areas that ostensibly look like pockets of inefficiency — reliever contracts, for example — there is likely some sort of internal justification for the behavior. Once something can be quantified, the serious outliers disappear. Right?
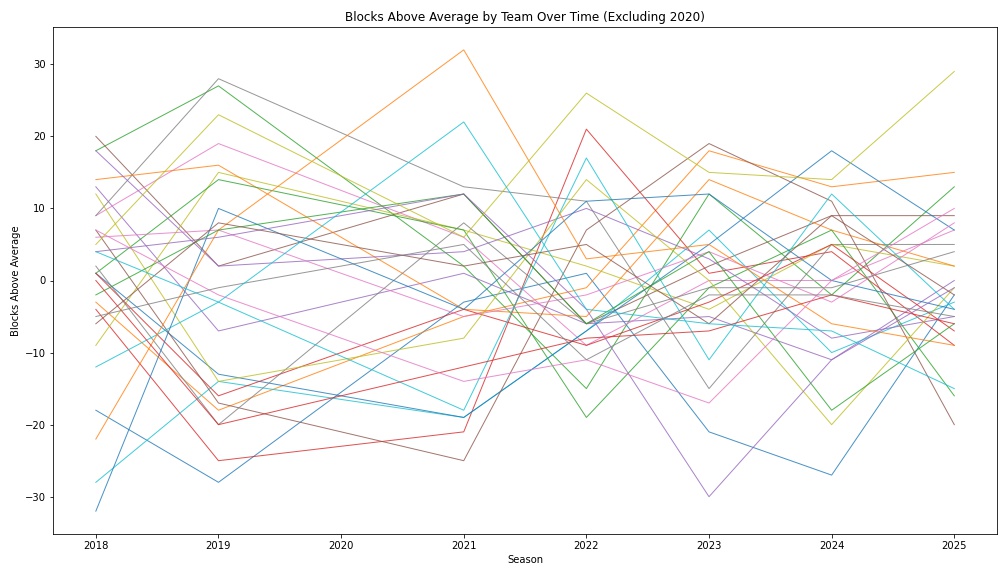
Maybe not quite. Three years ago, catcher blocking statistics surfaced on Baseball Savant, though teams surely were measuring this skill internally for years prior to its public introduction. Has there been a general convergence in the years since? To some degree, yes. Here is the blocking equivalent of Davy’s plot, with Savant’s “blocks above average” metric on the y-axis. There isn’t a clear clustering trend like in the framing case, but the middle of the pack appears a touch tighter.
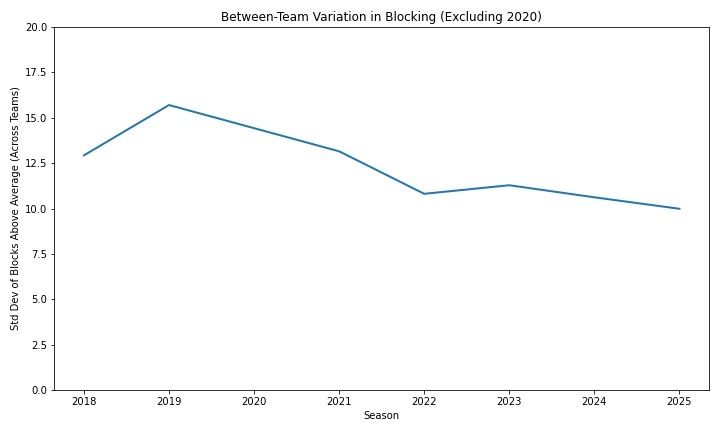
Measured as the standard deviation between teams, the trend is a little clearer. Slowly but surely, teams are beginning to converge.
But the catcher blocking revolution is a tentative one. While it’s moving in the right direction, it’s too soon to say the arms race is fully on. To wit: Last year was the worst catcher blocking season in recorded history.
Though Savant introduced the metric publicly in 2023, they have in the years since provided data going back to 2018. Between 2018 and 2025, there were 538 qualifying catcher seasons. Agustín Ramírez’s -28 blocks below average last year ranked 538th among that cohort. It should noted that blocks above average is not a rate stat; he did all that in just 73 games behind the dish.
The slower convergence on blocking is, I think, understandable. Of all the things a catcher does, it’s among the least sexy. Framing, naturally, has received most of the attention from analysts over the last decade or so; it tends to comprise the plurality of catcher defensive value, even in this phase of the Competitive Advantage Life Cycle. Throwing runners out, meanwhile, gets the most love on broadcasts, and it’s the easiest to spot.
Blocking sort of falls between those two catcher activities. It’s somewhat visible, but the difficult blocks happen relatively infrequently. And the value is muted: Savant estimates each block above (or below) average grades out to a quarter of a run. Even Ramírez’s record-breaking season, then, only resulted in -7 runs of blocking value. By comparison, it isn’t all that remarkable to lose seven or more framing runs; eight catchers bested (worsted?) that mark in 2025 alone.
Additionally, there is not much blocking discourse. What distinguishes a good block from a great block? How much is a block worth? Who is the best at this skill? I don’t think there is a common consensus on these questions.
Defined as it is by Savant, blocking is, in some sense, the fundamental task of catching. Only a subset of all pitches are potentially “framable.” Catching a runner stealing is even less common. But on nearly every single pitch, the catcher must catch the ball. It’s right there in the name! Catcher!
For a full-time catcher, that comes out to tens of thousands of pitches in a single season. Perhaps you are saying, ‘OK, how many of those are actually hard to catch?’ I submit that they all are; professional catchers just make it look easy. Imagine a moderately athletic young person was thrown into a game to catch for nine innings. They’d miss hundreds of pitches. To catch in the major leagues, you cannot miss hundreds of pitches. You need to catch them all.
Compared to the general population, Ramírez is an amazing catcher. He saw thousands of pitches with crazy velocity and mind-bending spin and caught nearly every one. But he did not catch them all. In fact, he made a mess of many catchable pitches in the 2025 season. On Savant, the “blocks above average” statistic is described thusly:
Every pitch is assigned a probability of being a passed ball or wild pitch based upon several inputs, most notably: pitch location, pitch speed, pitch movement, catcher location, and batter/pitcher handedness. Based on that knowledge, each pitch a catcher receives (or fails to) is credited or debited with the appropriate amount of difficulty. For example, if a catcher blocks a pitch that is a PB + WP 10% of the time, he will receive +0.10. If he blocks a pitch that is a PB + WP 90% of the time, he will receive +0.90.
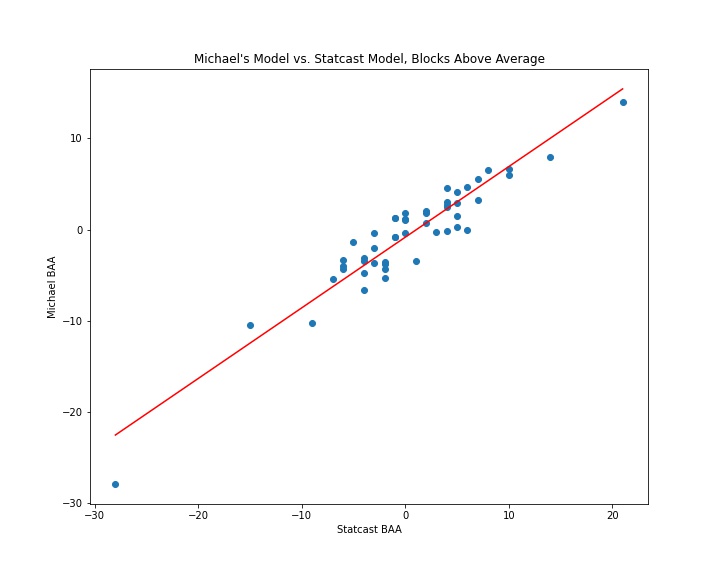
I wanted to better understand what this looked like in practice, so I tried to recreate the Statcast model from scratch and apply it to all the pitches in the 2025 season. I was not privy to some of the inputs of the Statcast model, such as the positioning of the catcher, and my physics knowledge was not robust enough to calculate where a spiked pitch intercepted the ground, as Tom Tango did in this explainer post.
What I do have access to, however, is Python, and a just-good-enough knowledge of machine learning techniques. I started with pitch location, release position, pitch movement, and velocity as my predictor variables. At first, it was terrible. But after some trial and error, I landed on a CatBoost framework, and the resulting model came surprisingly close to reproducing Tango’s model. While it slightly underrated the likelihood of wild pitches, it nonetheless correlated nearly identically with the Savant leaderboard at the individual catcher level (0.9 r-squared).
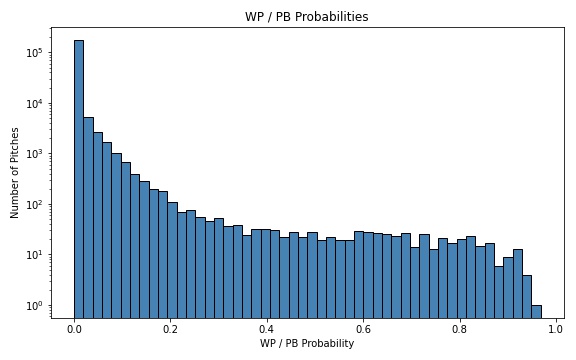
Once I had a good-enough approximation, I set out to better understand the spectrum of wild pitch/passed ball probabilities. Out of nearly 200,000 pitches with runners on base in the sample, just 198 graded out as both a) having a less than 1% chance of being a wild pitch or passed ball, and b) ultimately becoming a wild pitch or passed ball. Here is the general distribution:
Of those 198 extremely unlikely passed balls/wild pitches, 12 can be attributed to Ramírez himself. Funnily enough, he actually graded out as a roughly average framer. But his framing focus, I believe, may have led to some of these inexcusable passed balls. Apologies to the man, but I compiled a reel of his lowlights that can be seen below:
(There is hope yet for Ramírez. Shea Langeliers finished with -26 BAA in 2024; his framing declined in 2025, but his blocking graded out as bang-on average.)
One way to lose lots of blocking value is to whiff on these sorts of catchable offerings, but catchers can make up ground by smothering difficult pitches. Here’s the best block of the year, according to my model, which gave Austin Wells just a 14% chance of corralling this splitter. Leverage isn’t considered here, but it must be noted that this block literally saved the game; the Yankees went on to win in 11 innings:
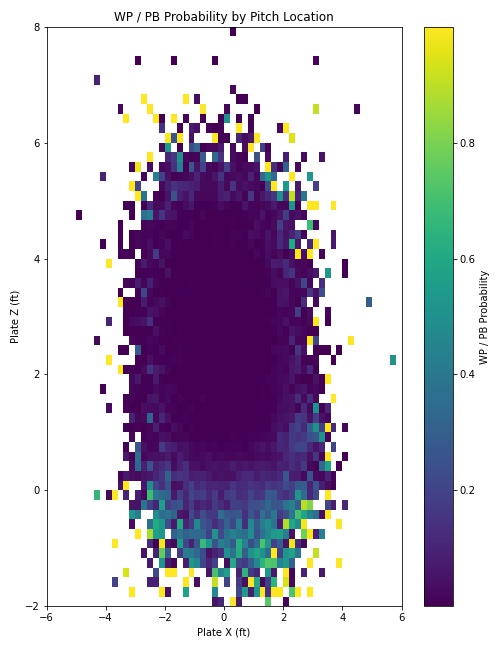
Wells is a decent blocker, but he is far from the best. That honor goes to Alejandro Kirk, who excels not just at limiting mistakes, but also wrangling unruly breaking balls in the dirt. As this plot shows, the highest probability wild pitches/passed balls live down there:
Kirk is able to smother these types of pitches better than anyone in the league. Watch him make easy work of this 89-mph knuckle-curve in the dirt:
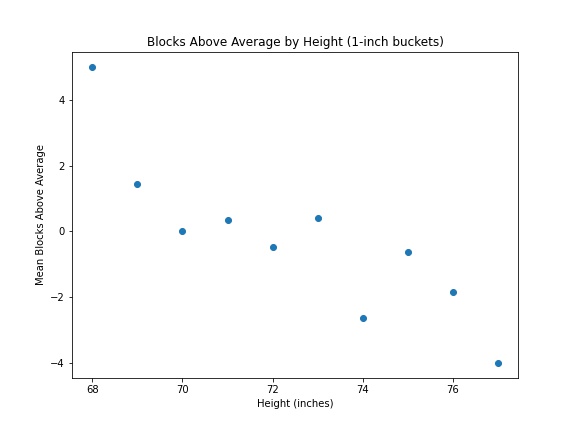
One thing to know about Kirk: He’s short (for a baseball player, anyway.) He’s got a low center of gravity, and he gets down to block those pitches. Does being short help you succeed at blocking? It seems like there’s at least some evidence that’s the case:
For now, Kirk is the reigning king of blocking, and Ramírez its court jester. Give it a few years — say, by 2030 — and blocking will likely find itself in the same place as framing, eliminating itself of Doumit-y characters, anything that reeks of serious lost value. All the mess gets filtered out eventually. As of now, we find ourselves in a purgatorial phase of the Competitive Advantage Life Cycle. Enjoy the imperfections while they last.
Thanks to Stephen Sutton-Brown for technical assistance.
Davy Andrews recently wrote about Steven Kwan’s defense, which, as my colleague chronicled, has been demonstrably stellar. Not only has the 28-year-old Cleveland Guardians left fielder been awarded a Gold Glove in each of his four MLB seasons, the metrics back up the accolades. There hasn’t been a better defender at his position, and that goes for the senior circuit as well as the American League.
And then there is Kwan’s bat. The 2018 fifth-round pick out of Oregon State University isn’t a basher, but he is a solid contributor to the Guardians offense. Since debuting in 2022, the erstwhile Beaver has slashed .281/.351/.390 with a 112 wRC+. Moreover — this is no secret for most FanGraphs readers — he seldom goes down by way of the K. Kwan’s 9.5% strikeout rate over the past four campaigns is the lowest among qualified hitters not named Luis Arraez.
Grant Fink knows his left-handed stroke as well as anyone. Cleveland’s hitting coach tutored Kwan in the minors before moving into his current role, and they work together in the offseason. I asked Fink about two-time All-Star when the Guardians visited Fenway Park last September.
“If you look at his profile as a hitter in the major leagues, it is based on accuracy and ball flight,” Fink told me. “His key is making sure that his body is moving in a way where he can get his barrel to the ball in multiple places in the zone, and that he is making contact in the right windows to produce that consistent ball flight. Read the rest of this entry »
Hello everyone, and welcome to the final mailbag of January! We’re now less than two months from Opening Day. I, for one, can’t wait.
It was mostly a slow week on the transaction front, with the most notable move being Harrison Bader’s two-year, $20.5 million deal with the Giants. As soon as the news broke, I texted Connor Grossman, who writes the Giants Postcards newsletter, saying: “Is Harrison Bader the most Giants player who has never played for the Giants?” In response, Connor called Bader Kevin Pillar 2.0. Anyway, this week we also learned that two core players from small-market clubs have signed seven-year extensions. First, José Ramírez and the Guardians agreed to a $175 million contract that will keep him in Cleveland through his age-39 season; by the time the deal is done, he could very well be the best Cleveland player that any of us have ever seen — unless some FanGraphs reader was alive to watch Tris Speaker. Then, on Friday afternoon, ESPN’s Jeff Passan reported that Jacob Wilson signed a $70 million extension with the A’s. Davy Andrews wrote up the Ramírez deal, and he’ll do the same for Wilson in a piece that will run on Monday.
We won’t be covering Bader, J-Ram, or Wilson for the rest of this mailbag. Instead, we’ll be answering your questions on players hitting the same number of home runs in four different seasons, ties in baseball, park effects, and more. But first, I’d like to remind you that this mailbag is exclusive to FanGraphs Members. If you aren’t yet a Member and would like to keep reading, you can sign up for a Membership here. It’s the best way to both experience the site and support our staff, and it comes with a bunch of other great benefits. Also, if you’d like to ask a question for an upcoming mailbag, send me an email at mailbag@fangraphs.com. Read the rest of this entry »
Below is an analysis of the prospects in the farm system of the Los Angeles Angels. Scouting reports were compiled with information provided by industry sources as well as my own observations. This is the sixth year we’re delineating between two anticipated relief roles, the abbreviations for which you’ll see in the “position” column below: MIRP for multi-inning relief pitchers, and SIRP for single-inning relief pitchers. The ETAs listed generally correspond to the year a player has to be added to the 40-man roster to avoid being made eligible for the Rule 5 draft. Manual adjustments are made where they seem appropriate, but we use that as a rule of thumb.
A quick overview of what FV (Future Value) means can be found here. A much deeper overview can be found here.
All of the ranked prospects below also appear on The Board, a resource the site offers featuring sortable scouting information for every organization. It has more details (and updated TrackMan data from various sources) than this article and integrates every team’s list so readers can compare prospects across farm systems. It can be found here. Read the rest of this entry »
In case you missed them, the 2026 ZiPS projections are now officially in the site’s projection database for your delight (or disdain), and reflect all of the signings and trades that have transpired this offseason. There’s still a week and a half to go before pitchers and catchers report, but with the full set of projections available, and it being so cold and snowy outside that I have little desire to leave my house, this seemed like a good opportunity to run the first set of ZiPS projected standings for the 2026 season. These, of course, aren’t the final projected standings, as there are likely to be significant changes between now and Opening Day. Instead, think of them as the “state of the preseason” projections.
These standings are the result of a million simulations, not results obtained from binomial or even beta-binomial magic. The methodology isn’t identical to the one we use for our Playoff Odds, which will launch soon. So how does ZiPS calculate the season? Stored within ZiPS are the first- through 99th-percentile projections for each player. I start by making a generalized depth chart, using our Depth Charts as a jumping off point. Since these are my curated projections, I make changes based on my personal feelings about who will receive playing time as filtered through arbitrary whimsy my reasoned understanding of each team. ZiPS then generates a million versions of each team in Monte Carlo fashion.
After that is done, ZiPS applies another set of algorithms with a generalized distribution of injury risk that changes the baseline plate appearances or innings pitched for each player. ZiPS then automatically and proportionally “fills in” playing time from the next players on the list to get to a full slate of plate appearances and innings. Read the rest of this entry »
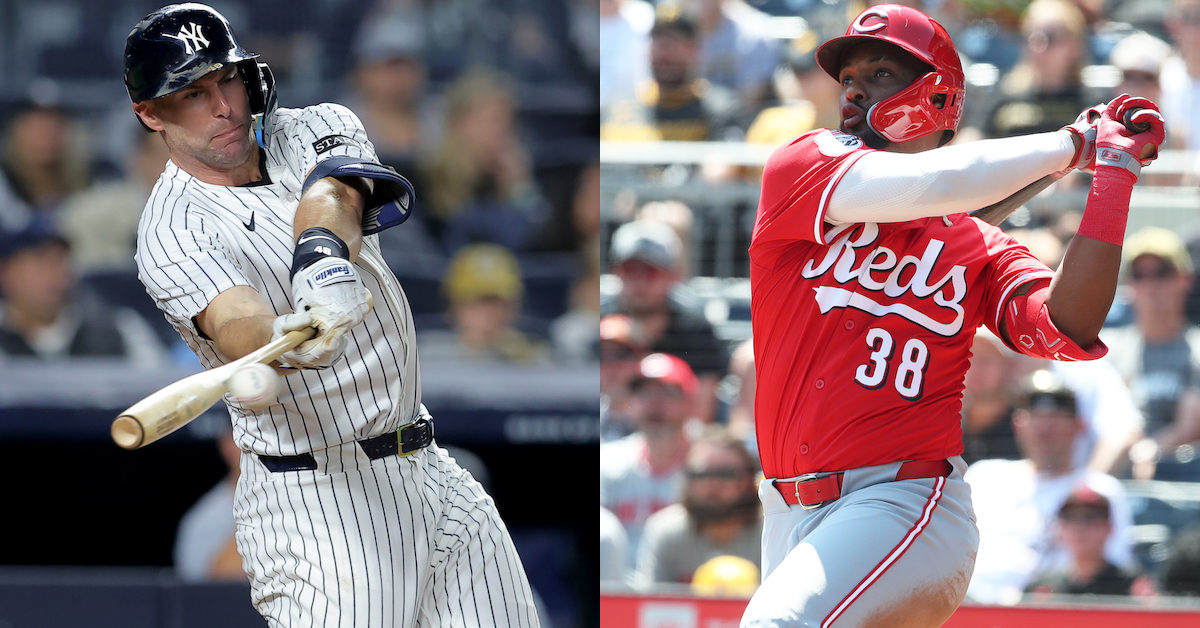
I was thinking about Rob Refsnyder recently for two reasons. First, I think about Rob Refsnyder a lot. I try to be professional in this forum, but everyone has their own sports fan nemeses, and Refsnyder is one of mine.
Back in 2012, Refsnyder — then a University of Arizona Wildcat — was the Most Outstanding Player of the College World Series, in part because he went berserk in the two-game final against South Carolina: 4-for-6 with two walks and a home run. He drove in the winning run in Game 1 and scored the winning run in Game 2. My beloved Gamecocks were denied a third straight national championship and haven’t been back to Omaha since. I’ll die mad about this series, and I’ll never forgive Refsnyder in particular.
I did not, however, expect to still be writing about Refsnyder — then a punchy, athletically unremarkable second baseman — in 2026. The previous year’s College World Series MOP, Scott Wingo, was an 11th-round pick; he never came close to making the majors and has spent the past decade as a college assistant coach. (He was most recently in the news in 2024 as the Home Run Derby pitcher for Alec Bohm.) Read the rest of this entry »