Archive for Featured

The Dodgers Get Shifty

Eric Hosmer is a hard man to shift against. Though he fits the two main criteria for an overshift (namely: he’s left-handed and plays baseball), that’s where his list as an ideal candidate ends. If ever anyone was going to poke a groundball the opposite way, it would be Hosmer — his groundball rate is perennially among the league’s highest, and he hits a fair number of them to the opposite field. Teams generally agree — he’s faced a shift in fewer than half of his bases-empty plate appearances this year, and only 40.7% overall. Both place him in the bottom third of left-handed batters when it comes to the defensive alignment.

You don’t have to dig into his groundball numbers for long to work out why. The reasoning behind a shift is simple; hitters pull groundballs. League-wide, a whopping 55.5% of groundballs have been pulled, against only 12.1% hit the opposite way. The split is the same regardless of handedness, but first base is conveniently located on the lefty pull side of the field, which makes shifting a left-handed batter a high-percentage move.

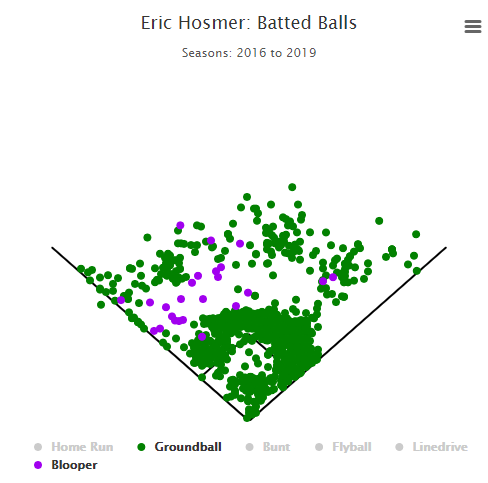
For some reason, though, Hosmer doesn’t fit that mold. In 2019, he’s pulled only 46.4% of his groundballs, almost exactly equivalent to his career average of 46.3%. He’s at 16.3% opposite-field groundballs for his career over a whopping 2,263 grounders. His pull rate is in the bottom 20% of batters this year, and was in the bottom 3% last year, the bottom 10% two years ago, the bottom 15% for his career — you get the idea.

This isn’t to say there’s no merit to shifting against Hosmer — you’d need a more detailed mapping of infielder speeds and groundball exit velocity to work the math out perfectly. But look at his groundball (and blooper) distribution from 2016 to 2019 and tell me you want to shift against this:
Read the rest of this entry »


Vladimir Guerrero Jr. Accelerates to the Finish

Guillermo Martínez is 34 years old, last played pro ball eight years ago for the independent Grand Prairie (now Texas) AirHogs, and never made it above High-A in affiliated ball. He is also the rookie major league hitting coach for the Toronto Blue Jays. There’s a long history of men who never achieved much in their playing careers becoming outstanding in second acts as coaches, and in his responsibility for the offensive success of Toronto’s much-vaunted youth movement (the average age of their hitters, 26.2, is the youngest in the American League), Martínez has more than enough raw material to make his mark in his first season in the role.

Last week when the Blue Jays came to Seattle to take on the Mariners (dropping two out of three), I sat down with Martínez to talk about his first year of coaching in the majors, and in particular his first year of coaching another, much more famous, rookie: Vladimir Guerrero Jr.

After making his debut for Toronto late in April at the precocious age of 20, Guerrero has had an up-and-down — or, more accurately, a down-and-then-up — season for a middling Toronto club that is nonetheless understandably optimistic about the cohort of young hitters of which Guerrero is a part. First, the down: Through the end of June, across 226 big-league plate appearances, Guerrero had posted a wOBA of just .317, and — even more worryingly — was striking out far more (19% of the time) and walking less often (9% of the time) than at any previous level.

Some regression was to be expected, of course, upon facing big-league pitching for the first time. But it wasn’t just that the results that were underwhelming. It was that they matched up with the story told by the eyes. Read the rest of this entry »


The Cubs’ Road Woes Threaten Their Playoff Perch

With three losses in a row against the Nationals at Wrigley Field this past weekend, the Cubs (69-61) slipped out of first place in the NL Central. They’re now three games behind the Cardinals (72-58), the furthest they’ve been from first since May 1, and just one game ahead of the Phillies (68-62) and two games ahead of the Mets (67-63) in the race for the second NL Wild Card spot. They’ll face the latter in an important three-game series starting today, but the bad news for them is that they’ve had to pack their suitcases to head to Citi Field. At 25-39, the Cubs own the major’s eighth-lowest winning percentage on the road (.391), and the lowest of any contender by 44 points (the Mets are 30-39 at .435 on the road).

In a race for a playoff spot, that’s quite a handicap, of course. In fact, in the Wild Card era, no team has ever won less than 40% of its games away from home and still reached the playoffs. Just a small handful of teams has won less than 45% and done so. Here’s the bottom 10:

Lowest Road Winning Percentages of Playoff Teams Since 1995
Rk Team Year W L W% Postseason
1 Astros 2015 33 48 .407 Won AL WC, Lost ALDS
2 Cardinals 2006 34 47 .420 Won NL Central, Won WS
3T White Sox 2008 35 46 .432 Won AL Central, Lost ALDS
3T Braves 2010 35 46 .432 NL WC, Lost NLDS
5T Dodgers 2008 36 45 .444 Won NL West, Lost NLCS
5T Astros 2005 36 45 .444 WC, Lost WS
5T Padres 2005 36 45 .444 Won NL West, Lost NLDS
8T Braves 2005 37 44 .457 Won NL East, Lost NLDS
8T Pirates 2014 37 44 .457 Lost NL WC
8T Dodgers 2015 37 44 .457 Won NL West, Lost NLDS
SOURCE: Baseball-Reference

Of the 10 teams above, the 2006 Cardinals, who won the World Series despite finishing with just an 83-78 record — the low-water mark for any World Series champ — and the 2005 Astros at least made it to the big dance, but aside from the 2015 Astros winning the AL Wild Card game, the 2008 Dodgers were the only other team from the above group to advance in the postseason.

I limited that list to 10 because beyond that, the rankings get pretty bunched up, with three teams at .458 (from the strike-shortened 1995 season), six at .469, 11 at .481, and so on. In all, 43 of the period’s 206 postseason teams (20.9%) had sub-.500 records on the road; if you’re a stickler for a full 162-game schedule, it’s 40 out of 198 (20.2%). Just 10 of those teams won a pennant, and only three — the aforementioned 2006 Cardinals, and the 1997 and 2003 Marlins, because of course — won the World Series. It’s not a particularly viable route to dog-piles and champagne showers. Read the rest of this entry »


JT Chargois, Brad Keller, and Adam Ottavino on Developing Their Sliders

Pitchers learn and develop different pitches, and they do so at varying stages of their lives. It might be a curveball in high school, a cutter in college, or a changeup in A-ball. Sometimes the addition or refinement is a natural progression — graduating from Pitching 101 to advanced course work — and often it’s a matter of necessity. In order to get hitters out as the quality of competition improves, a pitcher needs to optimize his repertoire.

In this installment of the series, we’ll hear from three pitchers — JT Chargois, Brad Keller, and Adam Ottavino — on how they learned and developed their sliders.

———

JT Chargois, Los Angeles Dodgers

“I was having trouble getting one to spin — to turn over — so my high school coach showed me a spike. Over the years I’ve manipulated where I hold my [pointer finger] on the ball, but it’s still a spiked-curveball grip. I just throw it like a heater. Instead of getting out front and pulling it like a curveball, I stay true on it as though it was a heater.

“When I get in trouble — maybe it’s backing up on me — and I need to make an adjustment, I tend to change my mindset to more of a curveball, to more of a downer-pitch. I want it to have two planes, as opposed to just moving horizontally.

“It was actually taught to me as a curveball. Then I started throwing harder as I got older. I got stronger and was literally trying to throw the crap out of it. That’s kind of how it migrated into a slider. As opposed to having more of a wrist-turn to get a bigger break, [a slider] is more about the manipulation of your hand position at release point. Read the rest of this entry »


Losing Seasons Don’t Have to Be Lost Seasons

For a losing team, the Cincinnati Reds have been busy. It’s not just trading players either, as Cincinnati made one of the biggest deadline moves while many contenders slumbered in near-stasis, picking up Trevor Bauer with an eye towards retooling for the 2020 season. Only three of the eight players in Wednesday’s lineup were also in the lineup on Opening Day: Tucker Barnhart, Eugenio Suárez, and José Iglesias. Chief among the new additions is the recently called-up Aristides Aquino, a big slugger lurking far back from the head of the team prospect lists coming into the season. After a fairly unimpressive minor league career, Aquino has feasted on the major league bouncy ball in 2019, slugging 28 homers in 294 AB in the formerly pitcher-friendly International League and then a shocking 11 homers in just 20 major league games.

Aquino was not some elite prospect finally being called up. The Reds have only received the benefit of getting a look at Aquino because they decided to use their ABs in a now-lost season in a productive way. If the team hadn’t dropped Matt Kemp or traded Yasiel Puig, choosing to go with the known quantity in a mistaken attempt to goose attendance (there’s no evidence this actually works), there wouldn’t have been as many opportunities to assess Aquino or Josh VanMeter or Phil Ervin in the majors. They now have more information on these players — how they’ve played at the big league level — and that information can have a positive effect on the decisions they make on how to win the NL Central or a wild card spot in 2020. Even picking up veteran Freddy Galvis, a 2.0 WAR player, for free has a value to a team like the Reds given his one-year, $5-million option for 2020. Scooter Gennett was always likely to be gone, but Galvis may not be, and now the Reds have another player who they can choose to start in 2020 or trade over the winter.

The Reds have been fortunate in these decisions, but I would have been in favor of this calculus even if Aquino/VanMeter/Ervin had been terrible. My fundamental belief is that among hitters and pitchers, teams have roughly a combined 12,000 plate appearances/batters faced to work with every year, and as many of them should be devoted to trying to win games as possible. Maybe they’re not 2019 wins — maybe they’re wins in 2020 or 2023 or 2026. But even players not working out gives you information; if Aquino came to the majors and hit like Lewis Brinson, it would still give the Reds data they didn’t have before. You don’t acquire that kind of knowledge when you’re a 90-loss team still penciling Billy Hamilton or Chris Davis into the lineup on a daily basis. Read the rest of this entry »


Sunday Notes: Logan Morrison is Cherishing the Present While Looking Beyond MLB

It’s Logan Morrison’s birthday today. Now 32 years young, “LoMo” is in his tenth big-league season… albeit just barely. He’s seen action in just seven games this summer, having toiled exclusively in Triple-A prior to being called up by the Phillies on August 14. Two years removed from a 38-home-run campaign with the Tampa Bay Rays, Morrison has essentially morphed from a bona fide slugger into a player barely hanging on.

His winter had been a waiting game. A free agent as of Halloween, Morrison received a few non-roster invites, but coming off of hip surgery he didn’t want to risk “showing up and then getting cut from camp.” In search of more security, he bided his time.

Morrison eventually signed with the Yankees in mid-April, joined Triple-A Scranton Wilkes-Barre in early May, and played there until July 1. At that point, with his chances of a promotion seemingly scant — this despite a healthy .999 OPS — he executed the opt-out clause in his contract. He then hooked on with the Phillies following the All-Star break.

Never a shrinking violet when it comes to expressing an opinion, LoMo was candid when addressing the limited interest he received over the offseason. Read the rest of this entry »


Bellinger, Devers, and MLB’s Most Improved Position Players

FanGraphs contains multitudes. Multiple flavors of Wins Above Replacement — one in which the pitching component is driven by FIP, the other by actual runs allowed (RA9-WAR) — for one thing. Multiple projection systems (Steamer and ZiPS) and ERA estimators (FIP, xFIP, SIERA). Multiple measures for defense, pitch selection, and plate discipline, borne of different data feeds. Multiple ways of measuring playoff odds and projected won-loss records. Multiple depth charts, now that we’ve brought Roster Resource on board. There’s a lot of cool stuff… if you know where to look.

One of the cool but relatively new and lesser-known features is our Season Stat Grid, introduced just over a year ago, and in the planning stages for longer (I know that I’m one of the people who lobbied for the tool). The grid allows the user to view 11 year worth of data in a single category, and to track and rank year-to-year totals and changes based on thresholds of plate appearances and innings. It’s hours of fun, and occasionally fuel for an article. So after highlighting the exceptional, breakout season of Rafael Devers and noting that — at the time it was written, at least — he had the majors’ largest year-over-year improvements in batting average, on-base percentage, and WAR, while ranking second in his gains in wRC+ and fourth in slugging percentage, I figured the topic was worth a league-wide look.

Towards that end, I chose 10 statistical categories where we might look for significant changes, namely the aforementioned five plus walk and strikeout rates, out-of-zone swing rate, fielding (UZR plus positional adjustment, if any) and, for a nod towards win expectancy, Clutch. To qualify, players had to reach 400 plate appearances last year and 300 thus far this year. I then took the top 30 players whose changes went in the right direction (higher in all cases except for strikeout and chase rates), awarding 30 points for first place, 29 for second, and so on. When two or more players were tied — even if it was just a virtual tie, where we can’t see what’s to the right of the displayed decimals — I split the points evenly among the tied; for example, James McCann and Yoán Moncada, who have increased their batting average by 66 points apiece, occupy the third and fourth spots and thus each get 27.5 points. I doubled the impact of WAR and wRC+ (60 points maximum), even though components of those are included elsewhere within the survey, on the belief that those two stats drive the lion’s share of our understanding as to who has improved.

Read the rest of this entry »


Did the Cardinals Get Robbed of a Chance at a Win?

On Wednesday night, the Cardinals trailed the Brewers 5-3 entering the eighth inning. As the home team, St. Louis went back out on defense to start the frame. Lefty Tyler Webb retired the Brewers on eight pitches. Before the Cardinals could take their turn at the plate in the bottom of the eighth, however, it started raining. Confusion and more rain ensued.

Now, the Brewers had come up to bat in the top of the eighth, so the Cardinals were supposed to get a chance to at least finish the inning, right? That’s what the press box in St. Louis was originally told, but that statement was clarified.

As for the rule, MLB’s website states:

If a regulation game is terminated early due to weather, the results are considered final if the home team is leading. If the home team is trailing, the results are considered final if the game is not in the midst of an inning when the visiting team has taken the lead.

The rule is fairly clear that since the Brewers began the eighth inning with the lead, once the game is terminated, the Brewers get the win. A suspension to pick up the game at a later date wasn’t an option for this game. As Derrick Goold indicated above, general practice is to let the home team get as many cracks at scoring as the visiting team. If the game were to continue, the teams would have had to wait until at least 11:30 or 12, when the rain got lighter and died down. The Cardinals remained at home for their next game while the Brewers made the trip back to Milwaukee with an offday before their game on Friday. While I can’t say whether or not the result was fair, or look up all the instances in which games were delayed and then continued and to which this rule might have been applied, we can go back and look at all the instances when a game was terminated. Read the rest of this entry »


The Best Bullpens in Baseball

After finishing up some research noting the wide gap between the quality of relief innings depending on the importance of the situation this season, it felt necessary to take a similar look at team performance. If teams were deploying less-good relievers in low leverage situations and good ones in high leverage situations, it could distort our sense of the quality of a bullpen when looking at overall numbers.

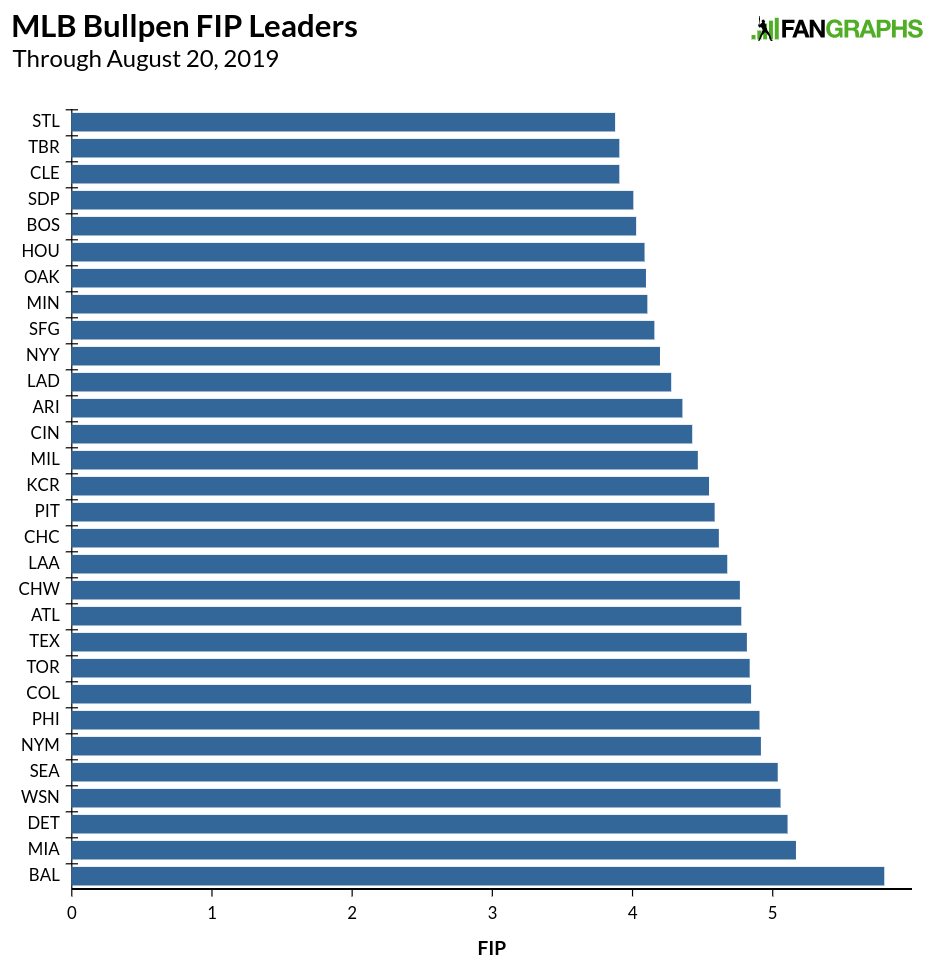
We’ll start with a pretty generic view of bullpens this year, with FIP by team:

The Cardinals have the lowest FIP of any bullpen this season, as the group as a whole has pitched very well. The Rays coming in second and first in the American League is somewhat of a surprise given their use of an opener in half their games; they are losing about 60 good relief innings and replacing them with around 180 good-but-not-as-good starting pitching-type innings. The teams fall down in a nice cascade the rest of the way, with the Baltimore Orioles providing a a very heavy base at the bottom of baseball.

But not all innings are created equal, and some of the innings pitched by bullpens are more important than others. If we separate meaningful innings (medium leverage and high leverage) from less important innings (low leverage), we can get a sense of how good a team’s bullpen is when it matters. This also could provide a better sense of which teams might be better prepared for the playoffs, given the consolidation of relief innings in October:

Read the rest of this entry »


The Real Reliever Problem

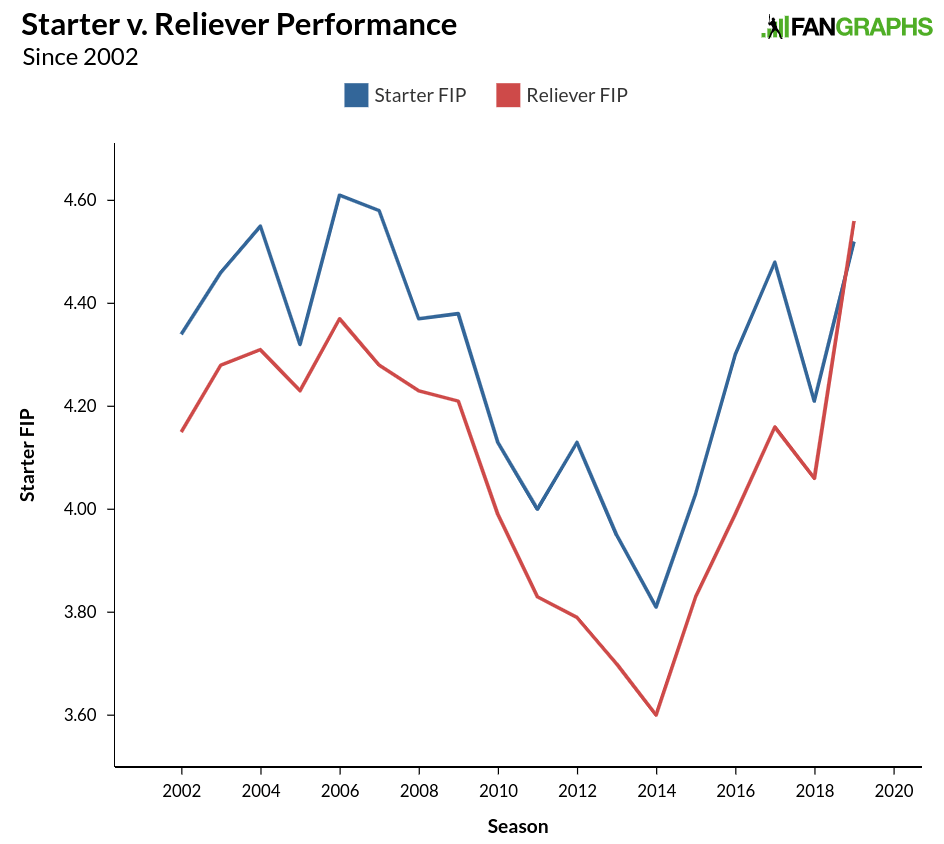
With so many variables, isolating specific trends in baseball can be tricky. Relievers have been pitching more and more innings. Strikeouts keep going up. The ball has been juiced, de-juiced, and re-juiced, making home run totals hard to fathom and difficult to place in context, both for this year and for years past. One noticeable aspect of this season’s play, influenced by some or all of the factors just listed, is that relievers are actually performing worse than starters. Our starter/reliever splits go back to 1974, and that has never happened before. Here is how starter and relievers have performed since 2002:

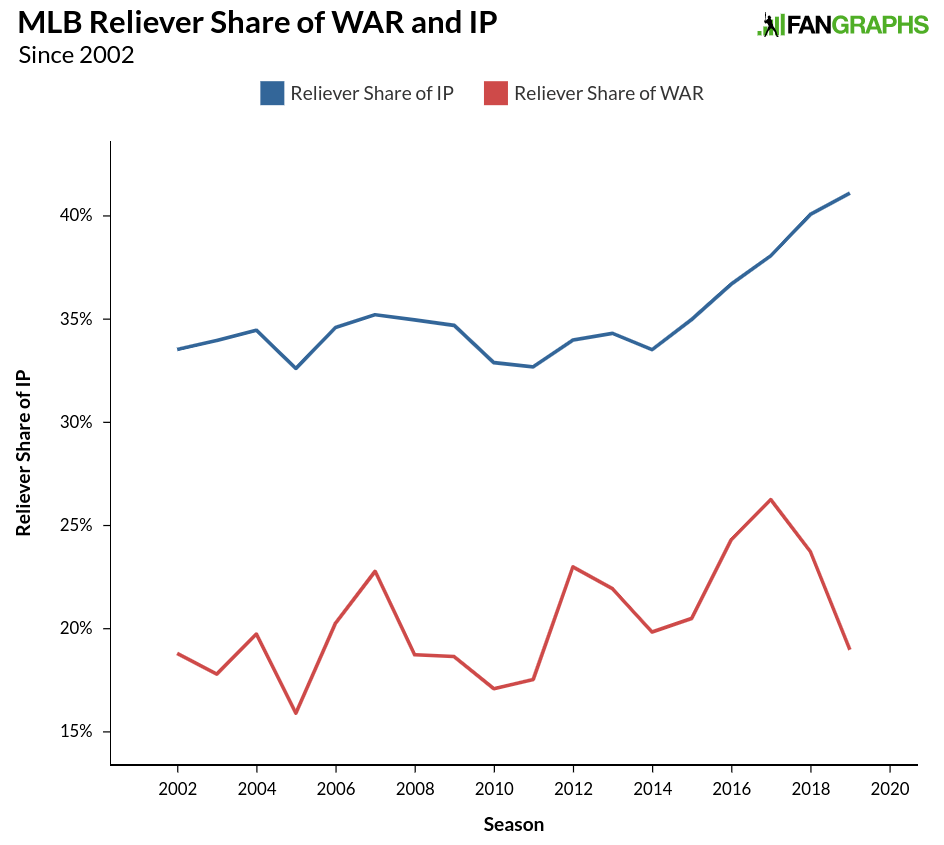
A healthy gap between the two roles has existed for some time, but seems to have taken an abrupt turn this year. Ben Clemens looked at the talent level between starters and relievers earlier this season in a pair of posts that discussed how starters are preparing more like relievers, as well as the potential dilution of talent among relievers. The evidence seemed to point toward the latter theory, though exactly how that dilution has affected performance comes in a rather interesting package. Providing some evidence for the dilution effect is the number of innings handled by relievers in recent seasons. While the idea of starters pitching better than relievers is a new one statistically, the trend of increasing reliever innings likely made this year’s change possible. Below, see the share of reliever innings and reliever WAR since 2002:

Read the rest of this entry »