Archive for Featured

The Mariners Are Trying to Be the Clutchiest Team on Record

The Rays lost a one-run decision in Miami Monday night, and it didn’t matter. I’m sure it mattered to the Marlins, and I’m sure it mattered to the Rays, but it didn’t really matter in the standings. Not as far as the playoff race is concerned. In the hunt for the AL’s second wild card, the Rays are in fourth place, but they’re separated from the first-place Mariners by 11.5 games. The Angels are 11 games back, and the A’s are the nearest competition, at eight behind. Nothing is actually yet set in stone, but it feels like we know the AL’s five playoff teams before we even reach the Fourth of July.

In some other universe, not much is different, except for everything. In this other universe, teams have win-loss records that match their run differentials. If you arrange by Pythagorean records, the Mariners still hold the second wild card, but they’re only one up on the Angels. They’re two up on the A’s, and they’re two and a half up on the Rays.

And then there’s the universe where everything goes according to BaseRuns. The inputs are the same as they are here, but the outputs simply make more sense. If you arrange by BaseRuns records, the Rays take over the lead for the second wild card. They’re a half-game up on the Mariners, and then there’s a little more room before the A’s and the Angels. According to the only standings that matter to us, the Rays are out of it. Basically everyone behind the Mariners is out of it. According to what you’d expect would have happened, there would be a tight race. In those other universes, there’s stress. There’s a far greater degree of uncertainty.

Not so. The Mariners have found a separator. They’ve pulled well away from all of their wild-card competition, and they’ve done so by being the clutchiest bunch of clutches that ever clutched.

Read the rest of this entry »


Did Jon Gray Deserve His Demotion to the Minors?

In one sense, Jon Gray’s 2018 season has been pretty successful. He’s struck out 29% of the batters he’s faced this year, for example, which ranks 12th among 90 qualified starters. His walk rate, at 7%, sits in the top third for starters. His home-run rate of 1.1 per nine innings is right in the middle of the pack among that sample, too, as are his 92 innings.

That’s he’s done of his work at elevation in Colorado makes those numbers even more impressive. His 3.07 FIP has produced a 2.5 WAR, one of the top 15 figures in baseball. Unfortunately, the Rockies haven’t received the benefit of that good pitching. In fact, Gray’s 5.77 ERA ranks 88th out 90 starters. The massive difference between his ERA and FIP would represent the largest such disparity in baseball history, and it was of sufficient concern to the Rockies to send Gray to Triple-A.

Not too long ago, Jay Jaffe wrote a piece on Jon Lester, whose season was also busting historical norms. Lester’s ERA was significantly lower than his FIP. So far this season, Gray is Lester’s opposite. The graph below shows every pitcher’s FIP and ERA this season.

You can see Jon Lester over there on the left on his own. If you go to the right, you can see Jon Gray with nobody even close to him. It should be evident that, in the middle, most players are reasonably close when it comes to ERA and FIP. The average differential per player 0.53. Of the 88 ERA and FIP pairs in this sample, 77 are within one run. So far this season, Gray’s 2.69 ERA-FIP is roughly double the player closest to him, as the table below shows.

Biggest ERA-FIP Gaps, 2018
Name Team ERA FIP E-F
Jon Gray Rockies 5.77 3.08 2.69
Jason Hammel Royals 5.56 4.20 1.37
Lance Lynn Twins 5.49 4.37 1.12
Sonny Gray Yankees 5.44 4.39 1.05
Nick Pivetta Phillies 4.71 3.68 1.03
Luke Weaver Cardinals 5.16 4.22 0.93
Vince Velasquez Phillies 4.69 3.81 0.87
Luis Castillo Reds 5.85 5.03 0.82
Carlos Carrasco Indians 4.24 3.42 0.82
Zack Wheeler Mets 4.47 3.66 0.80
Qualified starting pitchers.

That isn’t just remarkable for this season. Since 1901, here are the biggest differences among qualified pitchers.

Largest ERA-FIP Since 1901
Name Team Season ERA FIP E-F
Jon Gray Rockies 2018 5.77 3.08 2.69
Jack Knott Browns 1936 7.29 5.16 2.12
George Caster Athletics 1940 6.56 4.52 2.04
Hub Pruett Phillies 1927 6.05 4.11 1.94
Chris Bosio Brewers 1987 5.24 3.38 1.86
John Burkett Rangers 1998 5.68 3.89 1.78
Bert Blyleven Twins 1988 5.43 3.66 1.77
Joe Oeschger Braves 1923 5.68 3.91 1.77
Ernie Wingard Browns 1927 6.56 4.80 1.76
Bobo Newsom – – – 1942 4.73 2.99 1.74
Ricky Nolasco Marlins 2009 5.06 3.35 1.71
Early Wynn Senators 1942 5.12 3.42 1.70
Jack Lamabe Red Sox 1964 5.89 4.21 1.68
Rick Wise Phillies 1968 4.55 2.89 1.66
Pol Perritt Cardinals 1913 5.25 3.59 1.66
Qualified starting pitchers.

There are a few Hall of Famers on that list in Blyleven and Wynn, but nobody comes close to what Gray has done thus far. Just to get a few more familiar names, here’s the same list since 1995.

Largest ERA-FIP Since 1995
Name Team Season ERA FIP E-F
Jon Gray Rockies 2018 5.77 3.08 2.69
John Burkett Rangers 1998 5.68 3.89 1.78
Ricky Nolasco Marlins 2009 5.06 3.35 1.71
Jaime Navarro White Sox 1997 5.79 4.21 1.59
Jose Mercedes Orioles 2001 5.82 4.32 1.51
LaTroy Hawkins Twins 1999 6.66 5.16 1.50
Edinson Volquez – – – 2013 5.71 4.24 1.47
Nate Robertson Tigers 2008 6.35 4.99 1.36
Derek Lowe Braves 2011 5.05 3.70 1.35
Clay Buchholz Red Sox 2014 5.34 4.01 1.33
Jose Jimenez Cardinals 1999 5.85 4.53 1.32
Zack Greinke Royals 2005 5.80 4.49 1.31
Mike Oquist Athletics 1998 6.22 4.93 1.30
Qualified starting pitchers.

There are some good pitchers on this list, too, including Zack Greinke. The odds are against Gray maintaining such a high difference. With half a season to go, Gray’s ERA is likely to be considerably closer to his FIP moving forward. If, the rest of the way, Gray’s FIP is one run lower than his ERA like it was in 2016, his ERA will end up right around Chris Bosio’s 1.86 number from 1988. If Gray’s ERA is half a run higher than his FIP like it was last year, he’ll end up with something close to Jaime Navarro’s 1.59 from 1997 and not even crack the top-15 all-time.

As we are getting close to the All-Star Break, it might be useful to take a look at the biggest half-season differences from our splits leaderboards, which go back to 2002. Here are the biggest first-half differences for pitchers with at least 70 first-half innings.

Largest ERA-FIP by Half Since 2002
Name Team Season 1st Half IP 1st Half ERA 1st Half FIP 1st Half ERA-FIP
Glendon Rusch MIL 2003 82.1 8.09 4.38 3.71
Jon Gray COL 2018 92.0 5.77 3.08 2.69
Tim Lincecum SFG 2012 96.2 6.42 4.01 2.42
Ubaldo Jimenez BAL 2016 79.1 7.03 4.63 2.40
Zack Greinke MIL 2011 74.1 5.45 3.05 2.40
Colby Lewis TEX 2014 84.0 6.54 4.17 2.37
Ricky Nolasco FLA 2009 90.2 5.76 3.56 2.20
Jake Arrieta BAL 2012 101.1 6.13 4.04 2.09
Edwin Jackson TBD 2007 74.1 7.26 5.19 2.07
John Lackey BOS 2011 79.0 6.84 4.84 2.00
Manny Parra MIL 2009 71.2 6.78 4.80 1.98
Ryan Dempster CIN 2003 96.0 6.75 4.78 1.97
Sidney Ponson BAL 2004 113.0 6.29 4.35 1.94
Edinson Volquez SDP 2013 109.2 5.74 3.85 1.89
AVERAGE — — 89.0 6.54 4.28 2.26
Min. 70 IP

That was quite a performance from Glendon Rusch. He would actually go on to have a couple productive seasons as a Cubs swingman, but 2003 might have soured the Brewers on his future. Scanning the list for similar performances to Gray, another Brewer, Zach Greinke, sticks out with a near-identical FIP to Gray this season. As the average indicates, we have roughly average to maybe below-average pitchers by FIP accompanied by horrendous ERAs. The next table shows how those players performed in the second half.

Second-Half Performance for Largest ERA-FIP
Name Team Season 1st Half FIP 1st Half ERA-FIP 2nd Half IP 2nd Half ERA 2nd Half FIP 2nd Half ERA-FIP
Glendon Rusch MIL 2003 4.38 3.71 18.0 4.00 2.14 1.86
Tim Lincecum SFG 2012 4.01 2.42 89.1 3.83 4.36 -0.53
Ubaldo Jimenez BAL 2016 4.63 2.40 52.2 2.39 3.60 -1.21
Zack Greinke MIL 2011 3.05 2.40 97.1 2.59 2.92 -0.33
Colby Lewis TEX 2014 4.17 2.37 86.1 3.86 4.75 -0.89
Ricky Nolasco FLA 2009 3.56 2.20 94.1 4.39 3.15 1.24
Jake Arrieta BAL 2012 4.04 2.09 0.0 — — 0.00
Edwin Jackson TBD 2007 5.19 2.07 86.1 4.48 4.62 -0.14
John Lackey BOS 2011 4.84 2.00 81.0 6.00 4.58 1.42
Manny Parra MIL 2009 4.80 1.98 68.1 5.93 4.96 0.97
Ryan Dempster CIN 2003 4.78 1.97 16.2 6.48 6.63 -0.15
Sidney Ponson BAL 2004 4.35 1.94 102.2 4.21 4.54 -0.33
Edinson Volquez SDP 2013 3.85 1.89 59.2 5.73 4.98 0.75
AVERAGE — — 4.28 2.26 66.0 4.49 4.27 0.20
Min. 70 IP.

As we might expect, the players’ first-half FIPs line up pretty well with their second-half FIPs. What’s interesting is that the second-half ERAs also line up pretty well with the FIPs from both the first and second halves. While this is what we would expect to see, it’s nice to have it show up so neatly.

One problem the above doesn’t solve is why Gray’s FIP, specfically, is so much lower than his ERA. A portion of the responsibility goes to his home park. Pitchers routinely post higher ERAs than FIPs in Coors Field because BABIP is a lot higher in Coors Field. Balls in play are not incorporated into FIP, so larger swings, like the one we see at Coors Field, are going to drive up ERA a bit. That only explains a very small portion of Gray’s differential, though. For the rest, please see the graph below depicting BABIP and left-on-base percentages for all qualified starting pitchers.

Previous research indicates that a vast majority of the difference between FIP and ERA is due to two factors, the two stats seen in the table above: BABIP and LOB%. Gray is the worst in both, about 50 points clear in BABIP and with few peers in LOB% this season.

A really poor BABIP might be an indicator that Gray is no longer an MLB-caliber pitcher. The rest of his stats say otherwise, however. Per Baseball Savant, his expected BABIP is about 50 points lower than his actual figure. As league-wide expected BABIP is about 20 points higher than actual BABIP, even once you factor in Coors Field, Gray’s BABIP is about 50 points too high based on the quality of contact, leaving the rest to luck and defense.

As for left-on-base percentage, if it were really high, we might think that perhaps Gray has trouble pitching with runners on base and that Gray’s 1.91 FIP with bases empty compared to 4.67 with runners on — and his .274 xwOBA with bases empty compared to .334 with runners on — speaks to the same issue. However, the latter number is roughly average for the league regarding xwOBA and pretty close to average for FIP once Coors Field is factored in. Jeff Zimmerman theorized that the issue might be pitching meatballs behind in the count, but even Gray’s numbers behind in the count are similar to an average pitcher in those situations. His velocity has been down in his last few starts. Ben Lindbergh noted the absence of competitive pitches from Gray this season. However, none of those theories explains a league-worst left-on-base rate or the massively high BABIP. The Rockies would have to keep Gray in Triple-A the rest of the season to game his service time, so that is an unlikely motivation, although if he hits the disabled list in the minors he would not accrue MLB service time like he would if he were DL’d now and something more serious was discovered.

Jon Gray is performing historically so far, but not in the way he would like. Now he’s pitching in a city he’d probably prefer not to. Based on the past history of others, as well as himself, there seems to be a pretty good chance — absent injury — that his ERA is going to be headed downward soon even if the big-league Rockies won’t be seeing the benefit of that downturn at the moment.


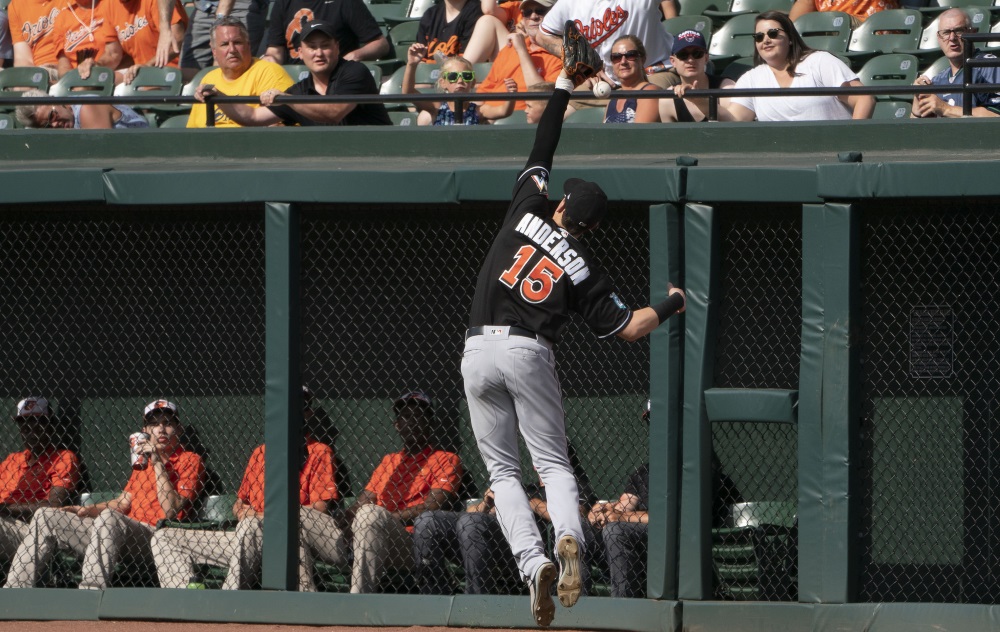
Brian Anderson and Hope for the Marlins

This image represents an exception to the rule of Anderson’s outfield defense.
(Photo: Keith Allison)

Not every franchise is in a position to enjoy the present. Each year, 10 clubs qualify for the postseason, meaning 10 fanbases experience some form of pleasure. The supporters of the other 20 teams, however, are necessarily forced to contend with various levels of discontent. Some are able to recall recent success, if not much hope for the near future. Those who follow the Giants and Royals belong to this category. Others, like those in San Diego or the south side of Chicago, endure the present while waiting for an Astros- or Cubs-style turnaround. For these fanbases, “[The] Past and to come seem best; things present [the] worst.”

One club that is forced to dwell only on the past and future is the Miami Marlins. They certainly have past glories: they’ve won the World Series in their only two playoff appearances. Their present, however, is just as certainly is bleak. Since 2011, the club has endured a spending spree that went nowhere; the resulting sell-off; the death of a bright, young talent; another firesale; a deteriorating relationship between management and their best player; and… yeah… it’s rough for the Marlins.

That said, there are some reasons for hope in Miami. All those sell-offs and losing seasons have allowed the club to acquire some promising prospects. In the low minors, the upper minors, and even at the major-league level, there are players in the Marlins’ system about whom analysts and fans can get excited. Going into the season, the two players expected to have spend the most time with the Marlins were Lewis Brinson and Brian Anderson. Brinson has struggled thus far, to the tune of a .188/.231/.347 slash line, a 54 wRC+, and -0.4 WAR (All-Star campaign notwithstanding). Brian Anderson has had a more successful debut, however, giving Marlins fans their first taste of hope for a brighter future.

Read the rest of this entry »


Sunday Notes: Ian Kinsler Has Deserved More Gold Gloves

Ian Kinsler was awarded his only Gold Glove in 2016. He’s been deserving of several more. Presenting at SABR’s national convention last weekend, Chris Dial shared that Kinsler has topped SABR’s Defensive Index at second base in five separate seasons, and on three other occasions he ranked as the runner up. Another metric is equally bullish on his glove work. Since breaking into the big leagues in 2006, Kinsler has 115 Defensive Runs Saved, the most of anyone at his position.

I asked the 36-year-old Angel if he was aware of how well he stacks up by the numbers.

“I secretly knew that,” smiled Kinsler, who then proceeded to balance appreciation with a touch of old-school skepticism for defensive metrics.

“It’s always nice to be valued in one way or another,” acknowledged Kinsler, who spent eight seasons in Texas, and four more in Detroit, before coming to Anaheim. “I don’t know if analytics are always correct. They don’t take into account everything this game offers, and I don’t know if they ever will, but to be thought of in that regard is flattering.”

Kinsler credits hard work, as well as the tutelage of coaches and teammates, for his having developed into a plus defender. Read the rest of this entry »


The Weirdest Player in the Minors Is Now in the Majors

When you do this as a full-time job, you spend a lot of time looking at the numbers. And when you spend a lot of time looking at the numbers, you start to notice certain outliers. Then you start to root for certain outliers. It’s hard to be a fan of a team, when you’re supposed to write about everyone objectively. So you settle on other interests. The Twins just called up an interest.

The Twins selected the contract of catcher/infielder Willians Astudillo from Triple-A Rochester. Astudillo appeared in 49 games for the Red Wings this season, hitting .290 (51-for-176) with 12 doubles, seven home runs and 25 RBI.

Astudillo is now on the roster at the expense of Felix Jorge. Or, if you want to look at it differently, he’s on the roster at the expense of Taylor Motter. Jorge was designated for assignment, and Motter was placed on the disabled list. And I don’t think the Twins want to be here; they’d rather be higher in the standings. They’d rather have a healthy Jason Castro. They’d rather have a productive Miguel Sano. The Twins would like to have a lot more things going right. But there’s the story of the team, and there are the stories of the team’s individual players. Circumstances have permitted Astudillo to reach the majors for the first-ever time. I’m sure he doesn’t care about the explanation. Astudillo has been a career-long outlier, and now he’ll receive his first major-league paycheck.

Read the rest of this entry »


2018 International Prospect Board

We present the July 2, 2018 Board. It features scouting reports on players we have evaluated as a 40 FV prospect or better at the current moment (and we might add more reports over the weekend) as well as tool grades and some video. Specifics on the players in the class are reserved for the board itself, so head there if that’s all you’re looking for.

This is the second year of international amateur free agency under the current CBA, the rules of which were discussed here after they were first implemented. In short, teams now have a finite amount of money to spend on players. Here is each club’s cap for the period. The total pool space across baseball is about $159,000,000, or roughly $6 million above last year’s total.

Click here to see THE BOARD.

Read the rest of this entry »


The Most Unhittable Arm in the Minors

The most unhittable arm in the minors is a 24-year-old lefty reliever. Two months ago, he was selected as a player to be named later in a major-league trade swung in February. He’s never made a prospect list of any significance, be it league-wide or organizational, and he doesn’t have any video clips on the official Minor League Baseball website. Whenever we write posts here, we’re supposed to include photos to go out to accompany the tweets, and I had to use a photo of the player from his previous club. I didn’t even know how to pronounce the guy’s last name until this morning.

The most unhittable arm in the minors is Colin Poche. Last year, he led the minor leagues in strikeout rate. This year, he again leads the minor leagues in strikeout rate, having increased his own strikeout rate by a dozen points despite going up against much stiffer competition. When Poche pitched in High-A last year, he struck out 37% of the hitters. In Double-A this year, he struck out 60% of the hitters. In Triple-A this year, he’s struck out 50% of the hitters. All year long, over 41.1 innings, he’s allowed just three runs. He’s allowed an OBP of .185, and he’s allowed a slugging percentage of .184. Colin Poche is turning in one of the most unbelievable performances you might ever see. Better still, it’s not entirely clear how he’s doing it.

Read the rest of this entry »


Offseason Spending on Relievers Isn’t Working Out

While this past winter moved slowly for a number of free agents, the offseason’s available relievers actually found work pretty quickly. By the time the calendar turned, 13 relief pitchers had received multi-year contracts worth more than $10 million, totaling more than $250 million overall. Addison Reed and Greg Holland would later ink deals for more than $10 million, as well. Much has been made of the fiscal restraint exercised by teams this past winter, but teams didn’t really apply that same sort of caution to reliever deals. Perhaps they should have.

In total, there were 30 deals in excess of $1 million dollars signed by relief pitchers this past offseason. With half the season having passed, it seems like an opportune moment to review how those deals are working out for the players and their clubs. Because of how relievers are typically utilized, we are necessarily dealing with small sample sizes, but that’s also just how things operate with relievers: the difference between a good and bad season might be a few rough innings.

The graph below shows WAR and the amount of guaranteed money the player signed for in the offseason.

Teams would hope that the trendline here slopes up and to the right. That would suggest a general correlation between the money received by a player and his on-field production. The graph above, however, doesn’t look anything like that. Indeed, if a slope exists at all, it goes down and to the right. And even if we omit the Rockies from it — they were responsible for the winter’s three biggest relief contracts — this graph would still pretty much look like a jumbled mess. Seven of the 11 players with more than 0.5 WAR this season signed contracts for less than $10 million total. Of the 13 relievers at replacement level or below, eight received eight-figure guarantees. There appears to be little rhyme or reason at all when it comes to money and performance.

Perhaps the total money skews things somehow. To see if that’s the case, here’s a similar graph, except with average annual value instead of total money.

Still nothing, right? It appears that way.

Read the rest of this entry »


The Rays Played a Pitcher at First Base

It’s been a strange few months for the Tampa Bay Rays. The front office spent the spring denying accusations they were trying to tank, and even at a half-decent 39-40, the club is nowhere particularly close to the playoff hunt. And yet, if you prefer the BaseRuns standings to the actual ones, the Rays have been a top-ten baseball team, even while playing a difficult schedule. And while injuries and being shorthanded led the Rays toward their “opener” experiment in the middle of May, as a team they’ve allowed the lowest ERA in baseball ever since. They’ve also allowed the lowest wOBA. This is where the Rays have gotten without Brent Honeywell. This is where they’ve gotten without Jose De Leon. Injuries have sidelined Nathan Eovaldi, Chris Archer, Anthony Banda, Jake Faria, and Kevin Kiermaier, among others. A month ago, Denard Span and Alex Colome were traded.

Through one lens, the Rays have been mediocre. They are how they were designed. Through another lens, the Rays have been an inspiring success. One could argue only luck separates them from a wild-card spot. No matter the lens, though, the Rays haven’t been boring. It’s a young club, stocked with talent. The strategy around the starting rotation and the subsequent relievers has been inventive. And on Tuesday, in the ninth inning of a one-run game, manager Kevin Cash played a pitcher at first base. The circumstances weren’t extraordinary. It was done very much on purpose.

Read the rest of this entry »


How Best To Predict the Season’s Second Half

By actual games played, we’re coming up on the halfway point of the season. By now, statisticians might continue to insist that certain data samples remain small, but they generally don’t feel small. We’ve had three months of baseball, everyday baseball, and three more months of everyday baseball remain. This is the middle of the summer routine, the routine where baseball stretches as far as the eye can see in every direction. It’s a comfortable time of year; games are becoming increasingly important, but there’s still ample time to correct mistakes.

We’re always trying to take stabs at the future. We know that baseball will play out however it likes, but we still attempt to guess what’s going to happen. This kind of thinking is what informs a lot of trade-deadline activity. So I’ve been thinking lately about second-half predictions. How can we know what’s going to happen in the standings? First things first: In a sense, we can’t. Baseball has an endless capacity to make the analysts look stupid. But it’s not like we don’t know anything. So I’m returning to a project similar to something I’ve done before.

Read the rest of this entry »

