The delayed start to the 2022 season due to the lockout has had a lot of small consequences for the structure of the season, ranging from expanded rosters to my least favorite thing, the continued use of zombie runners in extra innings. The last (we hope) of these changes is a slight alteration to the playoff schedule, which the league sees as a necessity in order to keep the postseason from straying too far into November. On Monday, MLB announced that the three-game Wild Card Series will be played without any off-days, while an off-day will be trimmed from the Divisional Series (between Games 4 and 5); teams in the ALDS get one additional off-day, without travel, between Games 1 and 2. The Championship Series will lose an off-day between Games 5 and 6). The World Series is business as usual.
While I expected this configuration for the Wild Card round (it was already accounted for in the generalized ZiPS projections for postseason performance), there are some slight tweaks that need to be made to account for the changes to the Division and Championship Series with respect to pitching. When projecting the roster strength of a team for the purposes of postseason probabilities, ZiPS weighs pitchers at the top of the rotation more heavily. That’s because historically they have gotten a larger percentage of starter innings in the playoffs than during the regular season. But losing an extra day of rest could result in teams using the pitchers after their No. 3 starters more heavily, as well as more dilemmas involving bringing back a top starter on three days rest. There are also possible consequences for the bullpens. In other words, teams will need to be slightly deeper than normal this playoff season.
So, how do we account for that? To get a rough estimate — I’m not sure there’s a methodology that will let us do any better than that — of the potential effects of the compressed schedule, I went back into the ZiPS game-by-game postseason simulations and put together a new, quick simulation for starting pitcher usage. I used projections as of Tuesday morning. Read the rest of this entry »
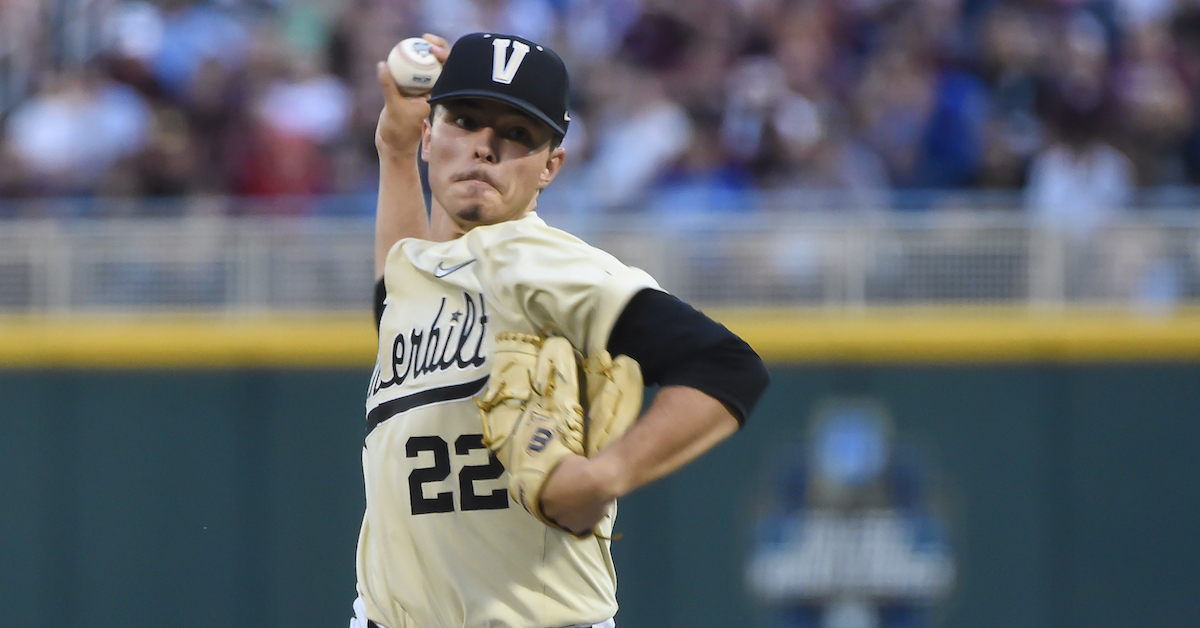
Jack Leiter will always have a special place in my heart. The Rangers’ top pitching prospect was the subject of the very first article I wrote for FanGraphs, which talked about, among other things, the unbelievable carry on his fastball and how it could lead him to big-league success. But we haven’t checked in on Leiter in a while, and well, his Double-A numbers have been ghastly: a 6.24 ERA in 53.1 innings pitched has somewhat muted the hype surrounding the righty. Though it doesn’t really change our outlook on Leiter, it’s still unsettling to see.
Part of that has been his inability to throw strikes, as Leiter is issuing well over five walks per nine innings. But more importantly, Leiter has lost a significant amount of his signature fastball ride in pro ball. Statcast data was available for this year’s Futures Game, during which Leiter’s dozen or so fastballs averaged 16.1 inches of vertical break – a far cry from the 19.9 inches I calculated in that debut article using TrackMan data. It could be a small sample quirk, and yet, the general industry consensus is that Leiter’s fastball is no longer transcendent. That’s a genuine problem.
What might the reason be? Maybe Vanderbilt’s TrackMan device wasn’t properly calibrated (as suggested by Mason McRae), leading to imprecise readings. But if that’s true (and maybe it isn’t), how could we verify it? What I came up with this: Using velocity, spin rate, and spin axis data from the 2021 NCAA Division-I baseball season, I built a model that estimates the vertical break of four-seam fastballs from righty pitchers. Once completed, I grouped the data by the pitcher’s team and looked at which schools over- or under-shot the model. Those with the largest residuals, in theory, are prime suspects for having miscalibrated TrackMan devices. Read the rest of this entry »
There’s a question that gets asked all the time on baseball social media. The variations are endless, but essentially, it boils down to this: Would you rather have an ultra-consistent hitter in Player X, who you can count on for a daily hit, or an uneven hitter in Player Y, who oscillates between prime Barry Bonds and a benchwarmer?
Given specific numbers, you could work out whether Player X or Y is more valuable. But what if we assume they’re players of equal caliber? That’s where it gets tricky. Maybe I’m only seeing certain answers, but in such cases, it seems like people prefer the clockwork Player X. It makes sense: The prospect of guaranteed production is reassuring, as befits our risk-averse tendencies. I have a hunch that we generally overvalue consistency in baseball, but I’m not here to prove that. Instead, I wanted to find out which hitters have been steady at the plate this season, and which hitters have been mercurial.
Over on our Splits Leaderboards, you can break down hitters’ seasons into weekly chunks. They range from Isaac Paredes’ destruction of the league in mid-June (488 wRC+) to Travis Demeritte’s hit-less and walk-less stretch a month prior (-100 wRC+). From there, measuring the variance between those weeks is a fairly simple endeavor. I grouped the weeks by each player, then calculated the standard deviation in wRC+, which represents how spread apart a player’s weeks are from his overall production. The higher the standard deviation, the more variable he is; the lower the standard deviation, the more consistent. Read the rest of this entry »
I like to think that I’ve asked a lot of questions about baseball in my life. It comes with the territory: my job is to write about those exact baseball questions, which gives me plenty of incentive to come up with them. But crowdsourcing is a powerful thing, and on a recent episode of Effectively Wild, I heard a question I’d never pondered before.
The major league record for home runs in a single game by a single team is 10. It was set on September 14, 1987, by the Toronto Blue Jays. That’s not an historically powerful team, nor was it an historically powerful era. Those Jays finished the season with 215 home runs, a mark 10 teams surpassed in 2021. But it stands alone as the most prolific single-game home run outburst, and it’s part of a broad trend that doesn’t make a lot of sense if you think about it.
Home runs have exploded since the ball became livelier in 2015. Despite that, only four teams have set new single-game home run records in that time. It doesn’t add up; home runs are flying out of ballparks like never before, and yet teams are mostly looking up at records set in earlier eras.
On the podcast, Ben Lindbergh and Meg Rowley mentioned a few hard-to-measure ideas. Maybe players are easing off the gas pedal more in blowouts, or managers are taking their best players out for rest more often. Maybe the deeper bullpens on modern teams mean fewer chances to pile on a reliever who just doesn’t have it that day.
Maybe, they also mentioned, it’s just math. After all, there might be a lot of home runs now, but there were a lot of games then. Any individual game might be less likely to result in an offensive outburst, but play enough of them, and the math starts to change. Ten games in a low-homer environment are less likely to produce a home run record than 10 games today, but what about 100 games, or 1,000 games? Read the rest of this entry »
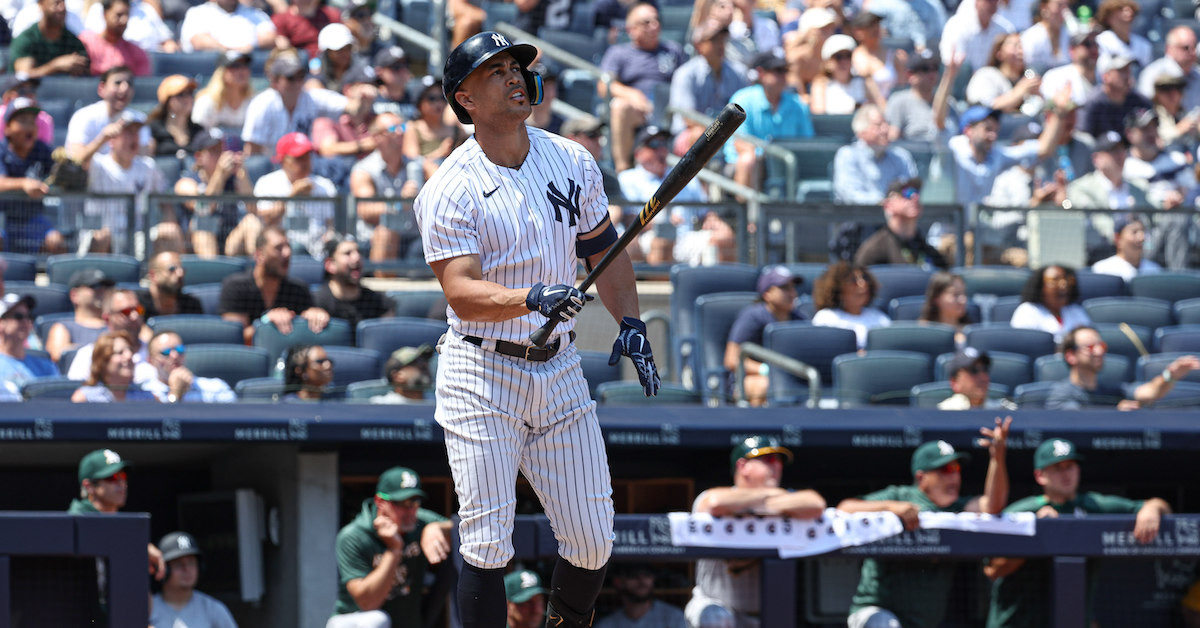
I’ve been thinking a lot about two Yankees hitters recently. That’s less common than you’d think for me; out on the west coast, the TV isn’t overrun with Yankees highlights, and there are just so many baseball teams, so many interesting players to ponder. But I heard an announcer discussing one of my favorite baseball tropes, and it brought Giancarlo Stanton and Anthony Rizzo to mind.
“Hard in, soft away” is a pitching adage, and one that makes plenty of sense. There’s a mechanical aspect to it, for one: to hit an inside pitch on the barrel, a hitter has to rotate more, which naturally takes more time. On the other hand, a slow pitch has the best odds of eluding a batter’s swing, or at least the most dangerous part of the bat, if the hitter swings too quickly; in a regular swing, the barrel gets to the outside part of the plate first (on a plane to hit the ball the other way) before rotating around to the inside of the plate (on a plane to pull).
I’m not a hitting mechanics expert, and that doesn’t describe the whole story. The batter could pull his hands in to try to get the bat head through the zone more quickly, or employ different swings for differently located (or angled) pitches, or any number of counters. But the default assumption – batters want to get the bat around on inside pitches, so pitchers should give them less time to do that, and vice versa – is at least a decent approximation of the physical reality in play. Read the rest of this entry »
As you might imagine, I watch a lot of baseball for work, and one of the things that stands out to me the most this year is just how dang hard pitchers are throwing. I’m not just talking about that new hotshot reliever your team called up who’s dropping triple digits like peak Aroldis Chapman, though that’s part of it. I’m talking about existing starters, guys I’ve watched for years, adding a little oomph.
Max Fried has topped out over 100 mph this year; his teammate Kyle Wright has never thrown harder. Framber Valdez is up nearly two ticks on average. Carlos Rodón already threw hard, and now he throws even harder. You can’t walk 10 feet without tripping over a pitcher throwing harder than ever – or so it seems to me, a fairly interested observer.
But appearances can be deceiving. I can think of any number of baseball truths that were considered evidently true by observation for years, only to later be disproven. I decided to put my eyes to the test. Have pitchers learned how to throw harder from one year to the next, changing the fundamental truth of how aging works? Let’s find out.
My method is fairly simple. I took every starter who threw at least 10 innings since pitch-level data began in 2008. I took their average four-seam fastball velocity, but only in games they started; I didn’t want to have swingmen who changed roles within or between seasons in my data. From there, I looked at every pitcher to see if he’d thrown in the majors the previous year, and if so, the change in fastball velocity from one year to the next.
In this way, I got a yearly sample of how much every returning pitcher in baseball’s velocity changed, on average, every year. As a quick example, there were 176 pitchers who compiled at least 10 innings as a starter in both 2013 and ’14. On average, they threw 0.21 mph slower in 2014 than they did in ’13. I found those pairs for every year, which gave me a yearly average of velocity changes over time. Read the rest of this entry »
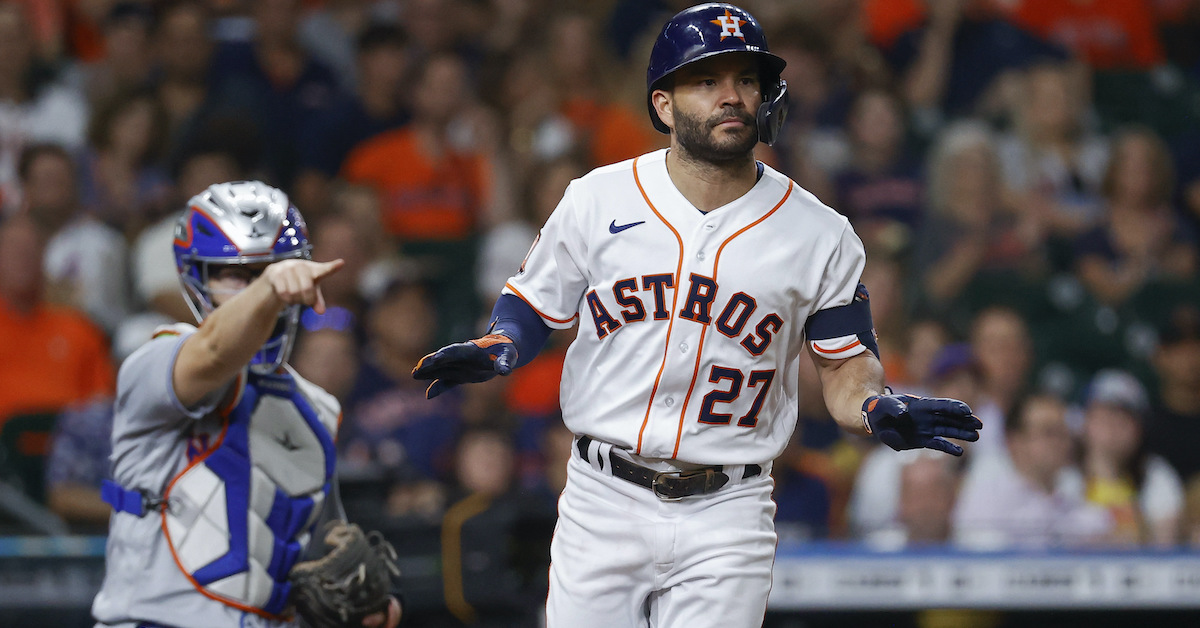
Ask pretty much any major league hitter, and they’ll tell you that they earn their paycheck with runners in scoring position. A base hit means a run, and you have to score runs to win games. An out — particularly a strikeout — squanders an opportunity to score, and those come vanishingly rarely these days, what with every pitcher in baseball throwing 100 mph with a wipeout slider and all. It’s the highest-leverage spot you can hit in; succeed with runners in scoring position, and your team will probably win, but fail, and it’s going to be a long night.
As far as we can tell, success in those situations — runners in scoring position, high leverage, you name it — isn’t predictive of future success. But that doesn’t mean approach isn’t predictive of future approach, and as you might imagine, hitters behave differently when they can smell an RBI opportunity.
One easy way to conceptualize this change in approach is to think of the edges of the zone and the area just outside of the strike zone — the Shadow Zone, in Statcast parlance — as a good test of what a hitter wants to do. On pitches down the heart of the plate, swinging is a clear best choice. On pitches nowhere near the zone, taking is the only right choice. But pitches that could go either way? The best strategy depends on what you’re trying to accomplish.
With runners in scoring position and no one on first — in other words, a situation where a walk is far worse than a hit — major leaguers have swung at shadow zone pitches 56.4% of the time (in the last two years). On the whole, they’ve only swung 52.9% of the time at those pitches. In other words, they increase their borderline pitch swing rate by 3.5 percentage points when the gap between a walk and a single is the largest.
That’s a rather unimpressive number. It’s the clearest time to swing that you can imagine, and batters are hardly changing their behavior. But that’s logical, when you think about it. Walks aren’t suddenly worthless just because you could drive in a run; juicing up the bases for the next batter still has value. And swinging at borderline pitches is hardly the best way to drive in runs; taking borderline pitches and waiting for a mistake, or for the pitcher to challenge you, might be a better decision. Read the rest of this entry »
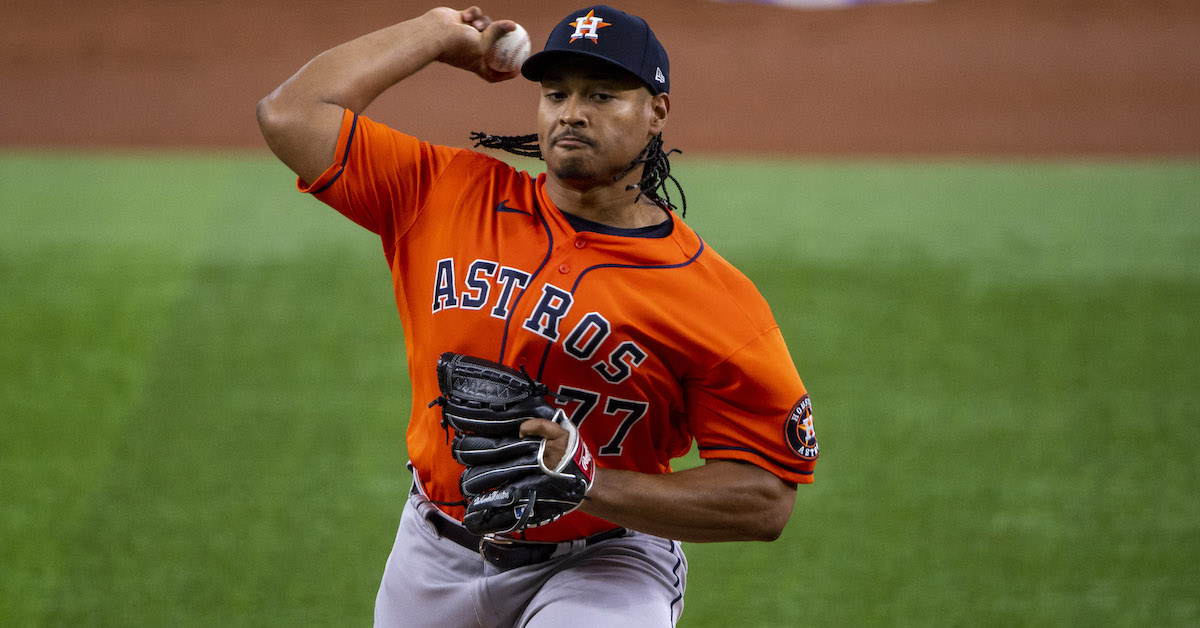
On Wednesday, the Astros easily handled the Rangers. They won, 9–2, with Luis Garcia’s strong start backed by a typically robust offensive performance. The Astros are very good. The Rangers are significantly worse. There are baseball games like this every day, multiple of them even. But this game stands alone, for one singular feat.
Er, well, dual feat. In the second inning, Garcia was simply too much for the Rangers. He faced Nathaniel Lowe, Ezequiel Duran, and Brad Miller, and wasted no time in setting them down:
That was the 107th immaculate inning — nine pitches, three strikeouts — in baseball history. It wasn’t the most recent one for long, however. In the seventh, Phil Maton came on in relief of Garcia and got right down to business. He faced Nathaniel Lowe, Ezequiel Duran, and Brad Miller, and wasted no time in setting them down:
Hey, that was really convenient! I got to use the exact same sentence again, because Maton exactly repeated Garcia’s feat; he tore through the three Rangers in only nine pitches for the 108th immaculate inning in history. It was, as you’d expect, the first time the same team has accomplished the feat twice in one game, as well as the first time it’s happened twice on the same day, to give you an idea of how out of the ordinary this was.
You didn’t need FanGraphs to tell you that was remarkable, though. Everyoneelsealreadyhas. Instead, I thought I’d take a look at perfect strikeouts — three pitches, one strikeout, no beating around the bush — and see whether this game still stands out if we remove the “innings” part of immaculate innings.
Garcia had those three perfect strikeouts in the second inning, but he actually managed another one in the game. It was, in fact, the next batter he faced: Leody Taveras went down on consecutive pitches before Marcus Semien took a first-pitch ball to end Garcia’s streak. Four three-pitch strikeouts in a game sounds quite impressive, but it’s not even the most in a game this year. Zach Eflin reeled off six perfect strikeouts in his start on May 22. Six other players have notched five such strikeouts in a game, including Garcia himself on April 22.
Extending our lens backwards in time to 2007, the earliest year in the pitch-by-pitch database I used, you’ll be unsurprised to learn that Max Scherzer holds the single-game record. On May 11, 2016, he tied a far more visible record with 20 strikeouts in a nine-inning game. He also struck out nine batters on exactly three pitches. Scherzer might just have a knack for this; he also notched two separate games with seven three-pitch strikeouts (May 26, 2017 and September 20, 2018).
There have been 11 games since 2007 where a pitcher recorded seven or more three-pitch strikeouts. No one else has more than one. Scherzer, it turns out, is the master of the efficient strikeout. Other good pitchers have approached those heights, but only rarely. Here are those 11 games:
That’s neat, but focusing on that fact highlights only Garcia, and not particularly well at that. If we’re focusing on team perfect strikeouts, the Astros mustered seven; Garcia’s four and Maton’s three were the only ones of the game. That’s part of a three-way tie for most in a single game this year. The Rays notched seven on April 14, and the Astros did it again on April 24. If you’ll recall from above, that’s the game where Garcia had five perfect strikeouts. He’s the standard-bearer for the feat this year.
Zoom out, and things get Rays-y. On August 17, 2019, they struck out ten batters on three pitches apiece, the only team (!) to eclipse Scherzer’s nine-strikeout effort. Houston pitchers certainly looked dominant yesterday, but they needed an entire extra immaculate inning to match the standard Tampa set.
Are you less interested in the specific game and more interested in Garcia’s three-pitch-strikeout prowess? He has 17 of them on the year, which certainly sounds impressive, but only places him in a tie for seventh among pitchers in 2022. Shane McClanahan is first, with a whopping 23. Nestor Cortes, of all people, has 18. Scherzer has 15, and he hasn’t pitched in a month. Garcia is certainly one of the best pitchers in baseball when it comes to going right after the batter and setting them down, but he’s not the best in the business.
Did I succeed in exhausting everyone’s interest in three-pitch strikeouts? Who knows! I find them quite interesting, but then, I find a lot of things about baseball quite interesting. I found yesterday’s Astros feat amazing, but giving it a little more context just makes Scherzer’s feats stand out even more. The three-pitch strikeout is the ultimate expression of pitcher dominance — no waste, just three straight strikes, next please — and it stands to reason that the marquee strikeout pitcher of our generation is also the marquee three-pitch-strikeout pitcher of our generation.
Recently, I was listening to one of my favorite non-baseball podcasts when baseball unexpectedly cropped up. Well, the theory of skin in the game cropped up. The idea, espoused by many people but notably by Nassim Taleb, is that actors perform better when they get rewarded for a good outcome and punished for a bad outcome. Want a better doctor? Fine them if they misdiagnose a patient, but give them a bonus for prescribing the correct treatment. Better money manager? Force them to invest all their own money alongside their client. You get the idea.
Anyway, one example of skin not being in the game is a sports team playing out the string. For most teams at most times, sports is a very skin-in-the-game-intensive field. If you hit well, you get paid more. If you don’t, you might get sent to the minors. If your team wins, they make the playoffs. If the team doesn’t win, no postseason. The incentives are straightforward.
At the end of a long season, however, it might not feel that way. If you’re 50-100 in late September, the rewards of a good game aren’t that high, and the cost of a bad game is quite low. If you’re 15 games out in the race, being 16 games out won’t suddenly bring out the detractors. You can think of these teams as having no skin in the game; the result of one game won’t change anything for them. Read the rest of this entry »
FanGraphs readers are a smart bunch. Though the comments can sometimes unravel into a series of shouting matches, the usual atmosphere is encouraging and collegial. For example, here’s a thought-provoking question I received a few weeks ago and my reply to it:
This is from an article I wrote about Framber Valdez and how he was on pace to shatter his own historic groundball-to-fly ball ratio. A five-man infield in any other circumstance would be out of the question, but consider just how many grounders Valdez generates. Among starters with a minimum of 200 innings pitched since 2020, he’s first in groundball rate (66.7%) by a wide, wide margin. With so few balls heading towards the outfield, does it make sense to reinforce the infield instead? It’s an intriguing inquiry, one that I promised would receive an answer. So here goes! Read the rest of this entry »