Archive for Research

2019 Had a Lot of Meaningless Baseball

Have you ever been to a September game between two teams out of playoff contention? I have, and while I like a nice afternoon in the sun as much as anyone, the lack of excitement in the stadium is contagious. Empty seats are demoralizing to fans who want to root for the team — there’s no one around to echo their cheers, so the cheers start to feel perfunctory. If you went to the game to get the thrill of baseball rather than for a pleasant afternoon, you’re often in for a disappointment.

Of course, that feeling isn’t exclusive to September. Last June 14th, for example, the Pirates took on the Marlins in a Friday night game. Per our playoff odds, the Pirates stood a 1.4% chance of reaching postseason play. The Marlins’ odds rounded to 0%, and we have a lot of decimal places to round to. It was only June, but the two teams were already playing out the string. The crowd of 8,340 filled the stadium to roughly one-quarter capacity.

When pundits talk about baseball’s competition problem, these games are the ones they mean. There are bound to be meaningless games throughout the course of the season: a 162-game schedule leaves plenty of time to separate the wheat from the chaff, and by September many teams are simply wrapping things up. Even then though, games don’t have to be completely meaningless; even if the home team is out of it, an exciting visiting team can provide some motivation to fans.

When the streaking Mets visited the Pirates on August 2, for example, PNC Park drew an above-average number of fans for the Friday night clash, even though our playoff odds gave them a scant 0.1% chance to make the playoffs. There was at least still a reason to attend the game — the Mets were interesting, and there’s some measure of joy to be gained from seeing your club take on a contender, and a vicarious thrill to beating them.

So if you want to get to the heart of what baseball’s competitive balance problem does for interest in the game, look to the games played with no stakes. What exactly no stakes means depends on your philosophical bent, and I’ll go into several variations, but first consider this definition: a game with no stakes is one where neither team falls in the 5%-95% playoff odds range at the start of the game.
Read the rest of this entry »


For Your Enjoyment, a Home Run Rate Refresher

Here’s a question for you: does Mike Trout hit more home runs against bad pitchers? The answer is yes, of course, but we can parse the question a little differently to make it more interesting. How about this one: does Mike Trout hit more home runs per fly ball against pitchers who are home run-prone? That at least has some intrigue.

Here’s one way you might do this study. Take every pitcher in baseball and group them into quartiles based on their home run per fly ball rate. I’m using line drives and non-pop-up fly balls to make a slightly different rate, but the idea is the same. With the pitchers bucketed like so, simply observe Trout’s home run rate against each quartile:

Mike Trout Versus
Stat Quartile 1 Quartile 2 Quartile 3 Quartile 4
HR/Air% 13.33% 16.44% 26.76% 20.00%
Batted Balls 45 73 71 30

But before Tom Tango pulls his hair out, let me add something important: This is a bad way to do this study. There’s a big problem here. Trout’s home runs and the pitchers’ home run rate aren’t independent of each other. If Trout tags a guy for a few home runs, that pitcher’s home run rate goes up. If Trout doesn’t hit any out against a pitcher, that pitcher will tend towards the stingiest quartile. Even if Trout’s home runs were randomly distributed across pitchers, this data would tend towards shape. Read the rest of this entry »


The Best (Expected) Secondary Pitches of 2019

Yesterday, I put every fastball thrown in baseball last year into a giant spreadsheet to come up with expected pitch values. Well fine, it was a small snippet of code, not a giant spreadsheet. But the output came in a giant spreadsheet! In any case, the idea is pretty straightforward: look at a player’s pitches, substitute in xwOBA-based contact numbers instead of actual results, and call it a metric.

Today, I’m completing the set. Well, I’m kind of completing the set; I ignored knuckleballs because there aren’t enough of them, and secondary offerings are more complex. Due to differing classification systems, I scraped breaking balls (sliders, curveballs, knuckle curves, and even cutters) and offspeed pitches as a single pitch type. Otherwise, we might end up with something like Nick Anderson — classification systems can’t decide if he throws a curve or a slider.

One more thing: the system is heartless. No human could argue that this wasn’t the best curveball of the year:

Or if not that one, then this one, with bonus Eric Lauer bewilderment and Greinke sprinting:

Slow curves are undoubtedly the best curves, results be damned. But the soulless calculation robot doesn’t agree with me on that, caring about “whether the opposition hit it” and “whether it gets strikes” instead of “whether Ben audibly giggles when the pitch is thrown.” To each their own, I suppose. Read the rest of this entry »


The Best (Expected) Fastballs of 2019

If you’re into FanGraphs’ linear pitch values, there was a many-way tie for the single most valuable pitch of the year. As the pitch values are context-neutral and count-adjusted, the best pitch you can throw is a 3-0 pitch that retires a batter. 3-0 is the worst count you can be in as a pitcher, and an out is the best possible outcome. Here’s one:

Wait a second. That doesn’t look like a very good pitch at all! Yasiel Puig got robbed there; that’s a 400-foot laser beam, at pretty much the optimum home run angle. He just happened to catch the deepest part of the park, and Starling Marte is fast.

Yes, linear weights aren’t perfect. We all know that. Many of their problems are nearly impossible to fix; if a pitcher’s fastball helps set up his slider, should it get credit for some of the slider’s effectiveness? If he’s staying away from Juan Soto with first base open and a man on third, should we dock those pitches for being outside the strike zone? Pitch values have their fair share of problems.

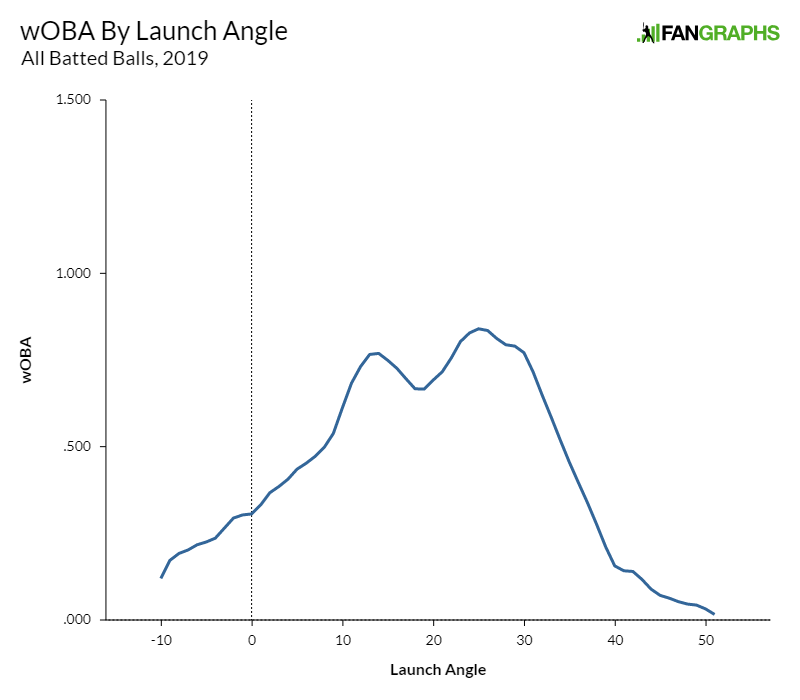
But if we can’t fix all of those problems, we can at least tackle one. When a ball is nailed like Puig did with that one, it’s usually a hit. Since 2015, we’ve had access to xwOBA, which (roughly speaking) considers the speed and angle of a given hit to assign it a value. Rather than look at the result on the field, it looks at the results of all similar batted balls. It has its shortcomings (largely related to spray angle), but it sure beats calling that Jordan Lyles pitch a good one. Read the rest of this entry »


How Winning and Financial Power Affect Free Agent Spending

Over the past few days, we’ve discussed the cost of a win in free agency and how that cost has been lowered for slightly below-average players. In this post, I want to examine some of the potential driving forces behind these changes. Specifically, I want to take a look at the following assumptions about how teams operate with respect to paying for wins on the free agent market.

  • The closer teams get to the playoffs, the more money they will be willing to spend on players because of the monetary benefits that come from making the playoffs.
  • The more money a team has, the more they will be willing to spend on a win on the free agent market because they can afford it, and vice versa (i.e. the Rays won’t spend the same dollars per win as the Yankees because the Rays have to hunt for bargains while the Yankees can afford to make the highest offer to any player they want).

We’ll take these assumptions one at a time. While there isn’t a great way to bucket teams by whether they’re “close” to the postseason without some degree of arbitrariness, I opted to look at a team’s projected win totals for each of the last two seasons, plus its current projected WAR for next season. I put teams into three categories: likely playoff teams, teams with a decent shot at the playoffs, and teams with little to no hope of making the playoffs. For the first group, I included teams projected to win at least 86 games, which usually provides a 50% or greater shot at the playoffs. For the second group, I included teams projected to win at least 77 games, but fewer than 86, which is roughly aligns with the 10%-50% range in terms of playoff odds. In the final group, I put teams with fewer than 77 projected wins.

The table below shows how much each group is spending over the last three offseasons, including this one:

Spending Based on Projected Win Totals
Wins Teams Players Dollars $/WAR (2018-2020)
86+ 28 84 $2106 M $9.0 M
77-86 33 104 $2299 M $8.3 M
77- 29 57 $656 M $8.3 M

Read the rest of this entry »


Which Types of Teams are Signing Free Agents? An Update

Last month, I set out to investigate whether the 2019-2020 offseason was a sea change in terms of teams outside the playoffs signing free agents. I can save you the click on that link — it wasn’t. At the time, things were leaning toward the less-egalitarian end of the spectrum; weighted by WAR, the average free agent was joining a team with a .545 record in 2019.

But that was a month ago, and many more signings have happened since then. All kinds of bad or in-the-middle teams have been getting into the act; the Blue Jays signed Hyun-Jin Ryu, the White Sox continued their bonanza, and the Diamondbacks signed Madison Bumgarner. There were smaller moves as well — Tanner Roark also joined the Blue Jays; Julio Teheran is an Angel now. Even the Tigers signed a few veterans.

Of course, playoff teams from 2019 added free agents as well. The Nationals fortified their bullpen with Will Harris and Daniel Hudson (plus bonus Starlin Castro action), and the Twins added Rich Hill and Homer Bailey. The point is, it’s not obvious whether the haves or have nots have done better since then.

Let’s look at a quick update first. First, there’s the rough cut; the total wins acquired in the offseason so far. Playoff teams are still acquiring more than half of the WAR available in free agency: Read the rest of this entry »


Is the Cost of a Win in Free Agency Still Linear?

It’s no secret that free agency has changed over the last decade. As more teams have embraced analytics by focusing on paying for future, rather than past, performance, and owners have pinched pennies, we’ve seen slower winters, and in the case of last offseason, teams paying significantly less for a win on the open market. This offseason has seen a welcome return of activity, with good players receiving top-dollar contracts. When we consider the health of free agency for players, the big deals seem to grab a lot of attention, as with Gerrit Cole, Anthony Rendon, and Stephen Strasburg‘s this season, and Manny Machado and Bryce Harper’s a year ago. Mega-deals create the impression that all is well, and the size of those deals can have an outsized affect when calculating dollars per win, as in my piece yesterday on the cost of a win in free agency. But the players who don’t receive those big contracts deserve a bit more attention because it is possible that as free agent spending has shifted, the money teams are paying for wins may no longer be linear.

When we talk about the linear cost of a win, we’re talking about there being a uniform amount teams are generally willing to pay per win on the free agent market; if the cost of a win is $9 million, a three-win player gets $27 million, a two-win player gets $18 million, and a one-win player receives $9 million. And while we recognize the three-win player doesn’t actually receive a one-year deal worth $27 million, when the money is spread over a multi-year deal and the presumed decline from aging is factored in, the wins paid for over the life of the contract come out in roughly that manner. For example, Hyun-Jin Ryu is projected to be roughly a three win player in 2020. But over the course of four seasons, he is likely to be worth closer to nine wins; he signed a contract for $80 million, which comes out to right around $9 million per win. Not every case fits so neatly, but Ryu is one example.

The question now is whether the above is still true. In 2017, Matt Swartz examined the seasons through 2016 and found that the cost of a win was still linear. Since then, a narrative has emerged of slightly lesser players getting squeezed. Heading into the 2017 season, Travis Sawchik discussed baseball’s embattled middle class as players appeared to be getting frozen out of free agency. He followed that up in 2018 after another slow winter provided more evidence of a market in dire straights. Providing further support, the crowdsourced contract estimates our readers provide as part of our annual Top 50 Free Agents exercise have generally overshot free agent contracts under $40 million the last few years. Read the rest of this entry »


The Cost of a Win in Free Agency in 2020

After a few cold, dreary, quiet hot stove seasons, free agency picked up its pace this winter. While Manny Machado and Bryce Harper got $300 million deals last offseason, it took until nearly spring to get those contracts finalized. This offseason, we’ve seen Gerrit Cole, Stephen Strasburg, Anthony Rendon, and Zack Wheeler sign for more than $100 million, and with the new year just eight days old, only a handful of decent free agents remain. While large deals and total spending near $2 billion have captivated us this offseason, it’s worth exploring what has made this winter different from years past. Is it just timing? Is it this class of free agents? Have teams changed their spending habits? Is the cost of a win still linear? A useful tool when examining those issues it to try to determine how much teams are paying for a win above replacement in the free agent market.

While putting dollar figures on players isn’t the most feel-good task, it’s helpful for framing conversations about costs in free agency. From the front office perspective, it helps to determine which free agents are good values and a worthy investment of resources compared to other free agents and veteran players. It also helps frame the value of younger players who have yet to reach the full six years of service time necessary to hit the market by showing the alternative cost to obtaining similar production. On the player side, these types of valuations tend to show how underpaid players are prior to reaching free agency, given the low cost of their tremendous on-field value compared to similarly productive free agents.

There are a variety of ways to go about determining how much teams are paying per win on the free agent market. Matt Swartz, having found that projections tended to overweight free agent player production and playing time when considered in the aggregate, instead considered actual production of past results to determine how much teams were paying for a win. He also used all players with at least six years of service time to account for players aging over the course of a contract. He acknowledged that there might be issues with including players on extensions. To be clear, Swartz wasn’t wrong about the way he formulated his dollars per win, but another approach can be helpful, and, if we are to look at the current offseason, necessary. Read the rest of this entry »


The Count Is King (Even After Accounting for Batter Skill)

Here’s a big, boring truism you surely don’t want to read an article about: as a pitcher, it’s better to be ahead in the count than behind. Good, great, fine. Thanks for the information, Ben, but let’s move along. We all know that, there’s no need to further prove it.

But wait! Here’s another truism that complicates the first one. Better hitters get ahead in the count more often. Mike Trout gets to 1-0 a lot more frequently than Billy Hamilton does — in roughly 48% of his plate appearances, as compared to a mere 36.8% for Hamilton.

So here’s a fact presented without context: major league hitters, as a whole, had a .363 wOBA after 1-0 counts and a .270 wOBA after 0-1 counts. Get ahead, hit better. But here’s some context, which at least slightly confuses the issue. The average wOBA of a batter reaching a 1-0 count was .322. In contrast, the average wOBA of 0-1 batters was .317. Better batters, in other words, really do reach advantageous counts more often. If you don’t account for that, you’ll probably end up over-valuing getting ahead in the count. Read the rest of this entry »


Which Types of Teams Are Signing Free Agents?

Here’s a narrative you’ve probably heard this offseason: free agency is back because non-playoff teams are trying to make a splash. On its face, it makes a lot of sense; the Angels, White Sox, Rangers, Reds, and Diamondbacks have all made meaningful additions to their rosters this year. Star players are headed to non-playoff teams, hoping to tip the scales of 2020 in their favor.

And yet, that narrative leaves out some inconvenient truths. Of the top three free agents this offseason in our Top 50, two signed with playoff teams. Sixteen free agents who were worth 2 or more WAR last year have signed so far; of those 16, 10 are headed to teams who played in October this year.

Only last year, all three of the top free agents (Manny Machado, Bryce Harper, and Patrick Corbin) signed with teams who hadn’t made the playoffs the previous year. Is the 2019-2020 offseason truly the year of non-playoff teams getting fancy, or are we merely falling victim to narrative? Read the rest of this entry »