The Robo-Zone Could Make Catcher Defense More Valuable Than Ever
How much will the ABS challenge system hurt the ability of catchers to frame pitches? That question has been bouncing around my brain for quite a while now. I’d been waiting for the offseason to really dive into the numbers, and, well, we’re here. It’s the offseason. But now that I’ve dug into all the data I could find, I think the entire premise of that question might be flawed. I thought that correcting a couple of ball-strike calls a game would erase a couple of well-framed pitches. This would no doubt hurt the better framers more than it hurt the worse ones, simply because they earn more strikes and would have more to lose. At the same time, the lesser framers would have juicier pitches to challenge, boosting their numbers a bit. As a result, the gap between good and bad framers would shrink, furthering a trend that’s been going on since we first gained the ability to quantify the value of pitch framing. It would still be valuable, just not quite as valuable as it used to be. But I’m not so sure anymore. Let’s start with the data.
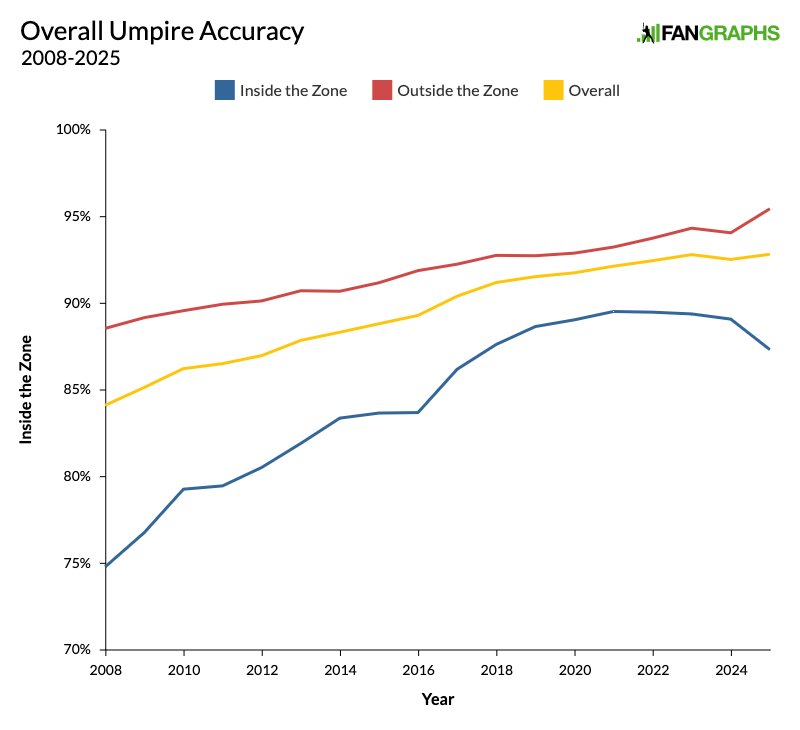
I pulled all the major league framing data I could. I pulled league-wide and individual catcher called strike rates both inside and outside the strike zone for the majors and for Triple-A, which in 2025 used the same challenge system we’ll see in 2026. I can tell you that 26 catchers got a significant amount of playing time in both Triple-A and the majors last season, and their called strike rate on pitches in the shadow zone in the majors fell by an average of 1.4 percentage points within the zone and 1.7 percentage points outside it relative to what it was in the minors. So while the Triple-A strike zone may be tighter, pitch framing is still harder in the majors. But the only data about how the challenge system has actually worked in the minors and in spring training of 2025 comes from MLB press releases, and it’s extremely sparse.
Of course, that data definitely exists. Baseball Savant guru Tom Tango wrote up a bunch of interesting takeaways from it on his blog a month ago. As you’d expect, players are more likely to challenge calls in higher-leverage moments, in the later innings, and on pitches that decide the outcome of an at-bat. For that reason, they tend to be less successful in those situations; they’re not challenging because they’re sure they’re right, but because they really want the call to go the other way. Tango also broke down some catchers and batters who were particularly good or bad at challenging. Not only did he provide their stats – poor Zac Veen challenged 24 pitches and got just three overturned – but Tango showed that Savant will be rolling out challenge probability numbers next year, using the distance from the edge of the strike zone to calculate the likelihood that any particular pitch will get challenged, and that any particular challenge will be successful. From there, it’s easy to calculate how much challenge value each batter or catcher creates above the average player. Read the rest of this entry »