Two weeks ago, we updated our Major League Leaderboards. We appreciated all the feedback and feature requests. One of those requests was to add a way to filter by the handedness of the player, and we’ve done just that!

The filter looks at whether the batter is right-handed, left-handed or a switch hitter, and filters on that value. It works the same for pitchers. We even have a switch pitcher filter, although it’s functional for just one player.
Similar to the position player filter, the handedness filter will not create a subset of data. For example, if you select switch-hitters, it will show you their stats from all their plate appearances, regardless of the side of the plate they batted from.
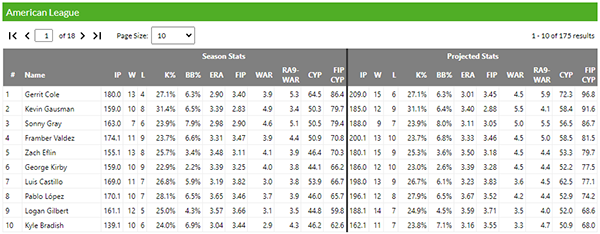
We still have the handedness splits in the “Split” menu, and these splits can be combined with the handedness filter. So you could look at all right-handed pitchers (Handedness Filter) while facing right-handed hitters (Split):

As always if you encounter any issues or bugs, please contact us at support@fangraphs.com.