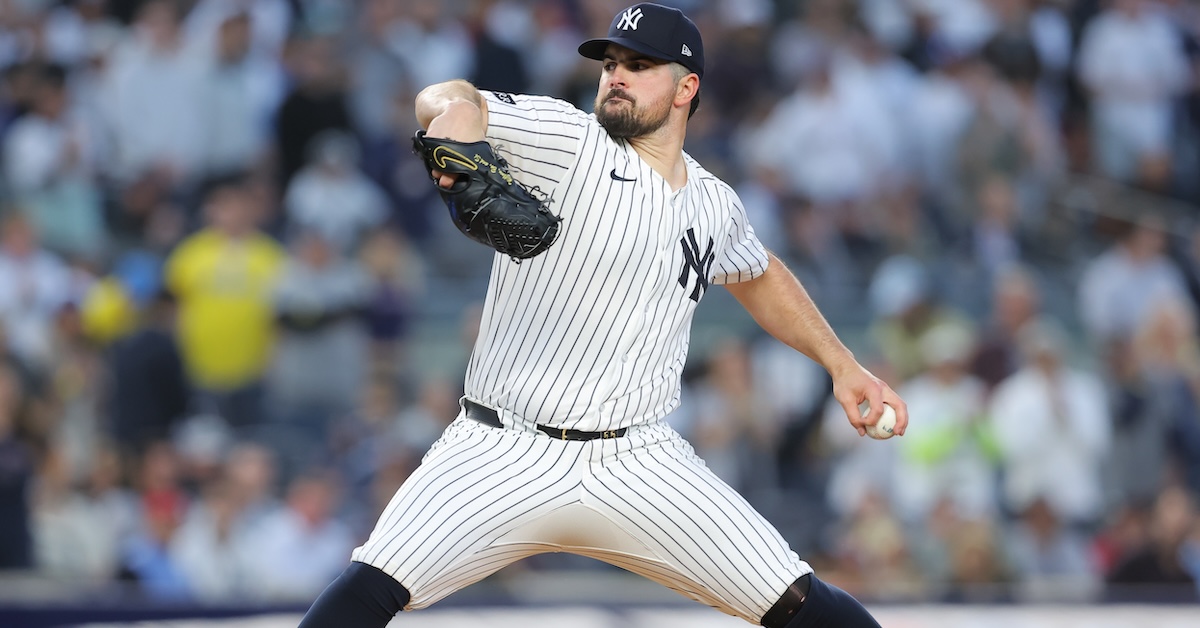
The Yankees got absolutely thrashed by the Blue Jays during the first two games of the Division Series, losing Saturday’s opener 10-1 and then again on Sunday, 13-7. To be fair, the first game was tight right up to the seventh-inning stretch, after which the Blue Jays expanded their 2-1 lead with four runs apiece in the seventh and eighth innings, but by the same token, Game 2 wasn’t even as close as that six-run margin suggests. The Yankees not only trailed 12-0 through five innings, but also were no-hit by Trey Yesavage through 5 1/3 innings before breaking through against reliever Justin Bruihl in the sixth. Now, for the second time in less than a week, they’ll turn to Carlos Rodón to face an AL East rival with their season on the line.
The 32-year-old Rodón started Game 2 of the Wild Card Series against the Red Sox, one night after Garrett Crochet and Aroldis Chapmanstifled the Yankees in the opener. Rodón held the Red Sox to three runs in six-plus innings, getting by with more than a little help from his friends. He retired the first six batters he faced before running into trouble in the third inning. Jarren Duran, the lone lefty in the lineup, singled, then Ceddanne Rafaela worked a walk, with Rodón exacerbating the situation with a throwing error on switch-hitter Nick Sogard’s sacrifice bunt. Though he recovered to strike out lefty-masher Rob Refsnyder, both runners scored on a sharp single by Trevor Story. Rodón escaped further damage when he induced Alex Bregman to ground into a double play that began with an acrobatic spin move by second baseman Jazz Chisholm Jr.
After a clean top of the fifth, Rodón was briefly staked to a 3-2 lead thanks to Aaron Judge’s RBI single, but it proved short-lived. Rodón fell behind Story 2-0 to lead off the fifth, then threw him a meatball, a 95.2-mph four-seamer that ended up in the middle of the strike zone and was hammered 381 feet to left field for a game-tying home run. A four-pitch walk to Bregman put him on the ropes, but he recovered by retiring Romy Gonzalez on a popout, then getting Carlos Narváez to ground into an around-the-horn double play. With his pitch count at a reasonable 82, manager Aaron Boone sent Rodón back out to start the seventh, but he walked Nate Eaton on four pitches, threw a wild pitch that sent him to second, then grazed Duran with a 3-0 pitch. Reliever Fernando Cruz managed to clean up the mess without further damage, aided by a stellar diving stop by Chisholm on a Masataka Yoshida infield single that, had it not been stopped, probably would have plated both Duran and Eaton. The Yankees scored what proved to be the decisive run in the eighth, when Chisholm worked a walk against Garrett Whitlock, then raced home on a long single into the right field corner by Austin Wells. Read the rest of this entry »
The pitching matchup favored the Yankees. With all due respect to one of baseball’s best young arms, Toronto’s Trey Yesavage came into the contest having thrown just 14 big league innings. Conversely, New York starter Max Fried is a three-time All-Star who finished the season 19-5 with a 2.86 ERA. While Yesavage has a bright future — he’s currently the Blue Jays’ top prospect — his mound opponent seemed a better bet to perform under the pressure-packed lights of the postseason.
That didn’t happen. Yesavage, who began the year in Low-A and didn’t make his major league debut until September 15, not only kept the Yankees off the scoreboard, but he did so in spectacular fashion. As for Fried — ditto his teammates who followed him on the bump — it was a veritable horror show. He got rocked. When all was said and done, Toronto had bombarded the Bronx Bombers to the tune of a 13-7 rout that wasn’t as close as the final score suggested. The win gave the Blue Jays a 2-0 lead in the best-of-five Division Series.
That Canada’s team launched four home runs and took a 12-0 lead before the Yankees recorded their first hit — a sixth-inning single after Yesavage had left to a huge ovation — isn’t exactly a footnote to what transpired at Rogers Centre. It was an impressive onslaught. Even so, what the 22-year-old right-hander with the power arsenal did was the story of the day. Read the rest of this entry »
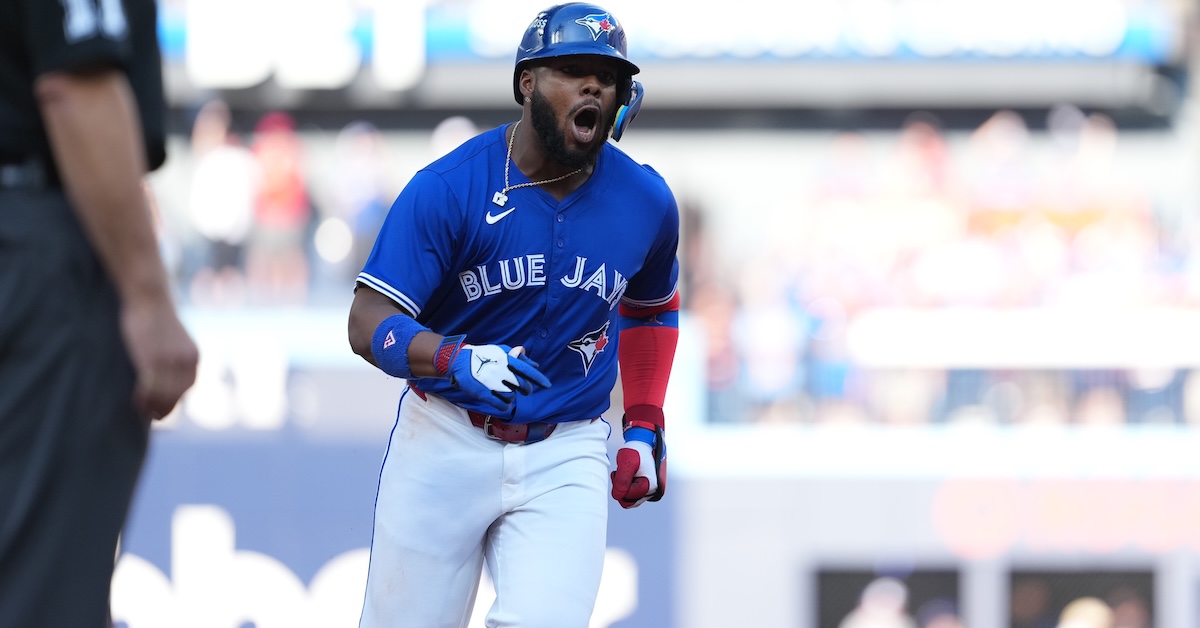
At this time last year, the Blue Jays faced some serious uncertainty. They’d just finished last in the AL East, and they had only one more season guaranteed with both Vladimir Guerrero Jr. and Bo Bichette on their roster. The future became even murkier during the winter, when the Yankees and Red Sox were both beefing up, the Orioles were still expected to be good, and the Rays were, well, the Rays. Both Guerrero and Bichette became the subject of trade rumors; really, there were questions about whether or not Toronto would just blow it all up.
Oh, how things have changed. In early April, the Jays extended Vladito through the end of the next decade, and then they caught fire. And now, one year after coming in last, they finished tied with the Yankees for the best record in the American League and took the division because they won the season series between the two teams. For that reason, Toronto hosted Game 1 of the Division Series against the New York on Saturday, and after the Jays bludgeoned the Yankees, 10-1, maybe it’s the boys from the Bronx who should be feeling a bit of self doubt.
As a franchise, the Yankees have played 441 postseason games; this loss ranks as one of their worst playoff humiliations ever:
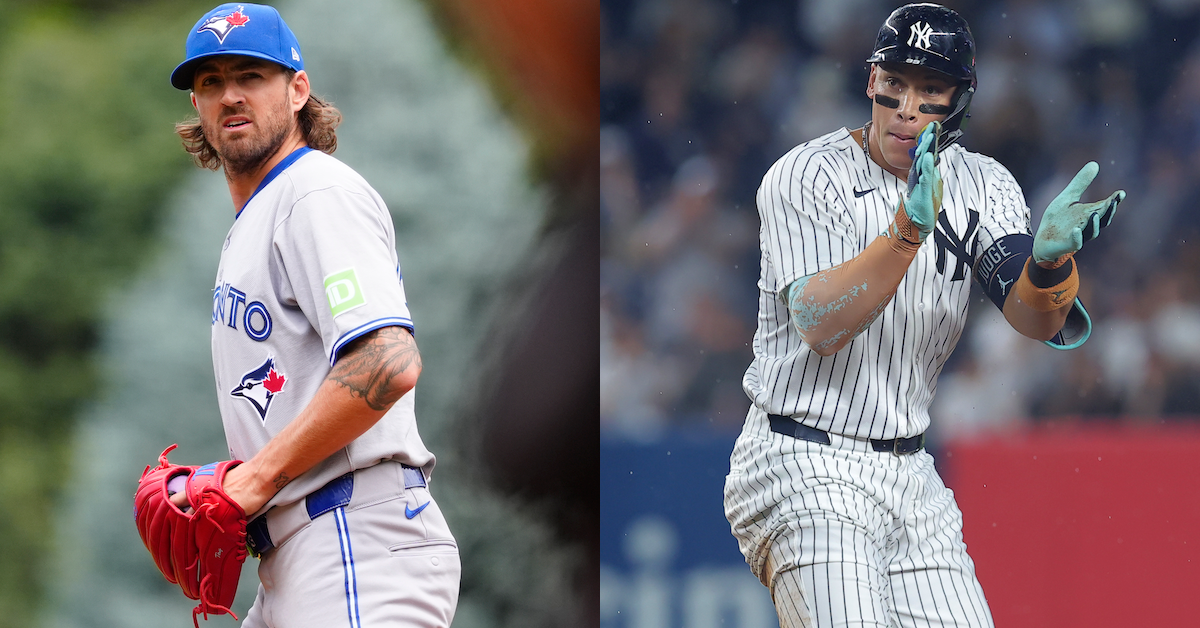
On Thursday, the New York Yankees became the first team to win a Wild Card Series after losing the first game of the best-of-three since the new playoff format was introduced in 2022. After dispatching the Boston Red Sox in the Wild Card, the Yanks have a matchup against another AL East foe lined up for the ALDS. For their part, the Toronto Blue Jays desperately needed their first-round bye to get their roster healthy after a breakneck final month of the season. These two teams finished 2025 with identical 94-68 records. The division race came down to the regular season’s final day, and the Jays only took the AL East crown thanks to a 8-5 head-to-head record against New York.
These division rivals are well acquainted with each other, though this will be the first time the two teams have met in the playoffs. (That’s pretty wild considering the Yankees’ long postseason history. There are now just three teams they haven’t faced in the playoffs: the White Sox, Nationals, and Rockies.) Their identical win totals during the regular season provide the primary storyline in this series: These are two evenly matched clubs battling for a spot in the ALCS.
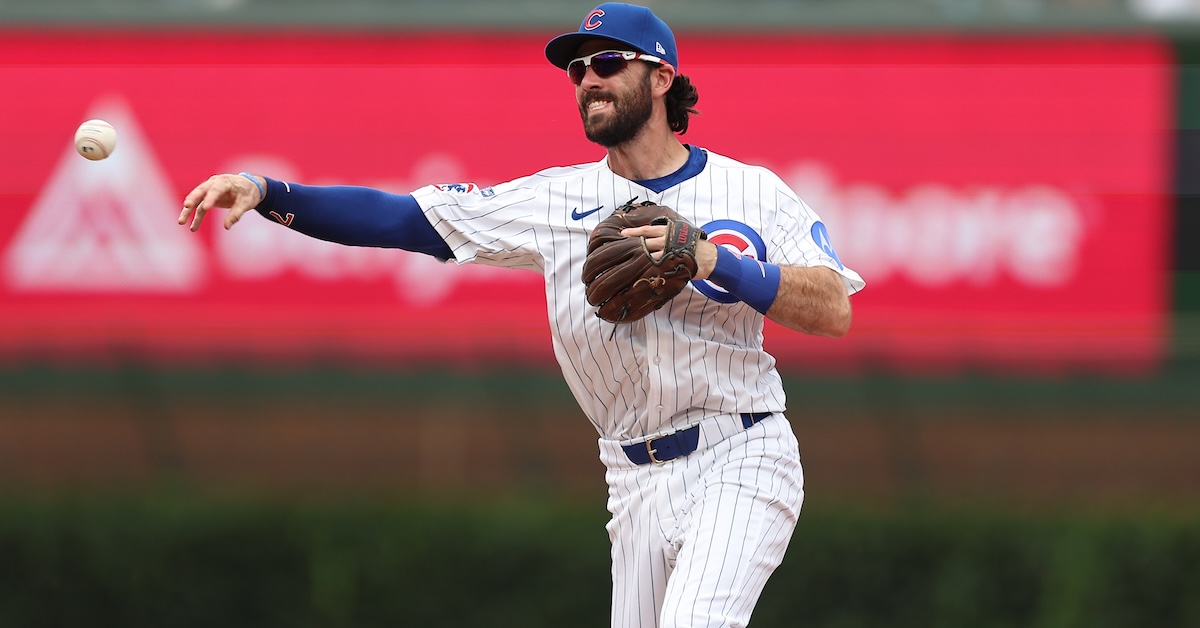
Dansby Swanson brought home back-to-back Gold Gloves in 2022 with the Braves and ’23 with the Cubs while leading the majors in Statcast’s Fielding Run Value in both seasons. Although he hasn’t added any hardware to his collection since then, and while his defensive metrics have slipped, he still grades out as comfortably above average in both FRV and Defensive Runs Saved. His defensive acumen was on display in Tuesday’s Wild Card Series opener between the Cubs and Padres, as he made a couple of pivotal, run-saving plays in Chicago’s 3-1 victory.
The Padres had taken the lead in the second inning, when Jackson Merrill and Xander Bogaerts opened the frame with back-to-back doubles off Matthew Boyd; Bogaerts took third when center fielder Pete Crow-Armstrong’s relay spurted away from Nico Hoerner at second base. Ryan O’Hearn then hit a sizzling 101-mph groundball, and Swanson, who was shaded up the middle, dove to his right to stop it. He looked Bogaerts back to third base, then threw to first for the out. The play loomed large as Bogaerts ended up stranded.
The Padres threatened again in the fourth, when Manny Machado drew a leadoff walk and took second on Merrill’s sacrifice bunt. Bogaerts legged out a chopper into the no-man’s land to the right of the mound for an infield single, and San Diego appeared poised to capitalize when O’Hearn hit a flare into shallow center field. Swanson had other ideas, making a great over-the-shoulder snag of the ball, then in one motion turning to fire home to keep Machado honest.
Cade Horton hasn’t simply been one of the best rookie pitchers in MLB this year, he has been one of the better starters in the senior circuit. The 24-year-old Chicago Cubs right-hander has a record of 11-4 to go with a 2.66 ERA and a 3.53 FIP over 115 frames. Moreover, he boasts a 0.93 ERA over his last 11 starts. In Triple-A to begin the season — his Cubs’ debut came on May 10th — Horton is now poised to start for Craig Counsell’s club in October,
My colleague Michael Baumann wrote about the 2022 first-rounder just over a month ago, but given his continued success, and with the postseason looming, another article seemed in order. Already well-informed on his background and arsenal, I asked Horton about the approach he takes with him to the mound.
“I’m a guy that is going to go out there and fill up the zone,” the erstwhile Oklahoma Sooner told me prior to a recent game at Wrigley Field. “I really just try to get outs and put my team in a good position to win. I’m a competitor, so I’m attacking the strike zone.”
Attacking the strike zone is, in many ways, akin to pitching to contact — more of an old-school approach to pitching — whereas in today’s game, chasing swing-and-miss is most often the goal. Given his high-octane heater and overall plus stuff, is he not looking to miss bats? Read the rest of this entry »
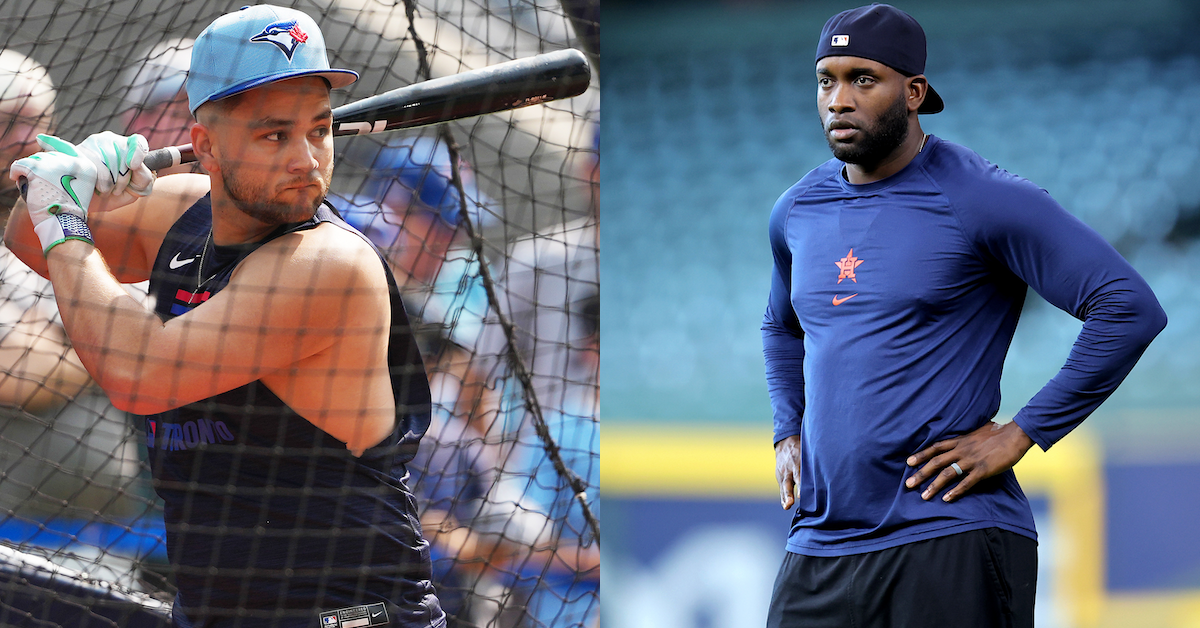
The Astros have spent nearly the entire season missing the superstar version of Yordan Alvarez, first because the 28-year-old slugger struggled during March and April and then because he missed nearly four months due to a fractured metacarpal in his right hand. He heated up upon returning to the lineup in late August, but on Monday night he sprained his left ankle, an injury likely to sideline him for the rest of the regular season and perhaps longer. He’s not the only American League star whose best hope for returning to the lineup is during the playoffs, as Blue Jays shortstop Bo Bichette has been ruled out for the rest of the regular season with a sprained ligament in his left knee.
Alvarez suffered his injury in the first inning of Monday night’s game against the Rangers in Houston. He followed Jeremy Peña’s leadoff single by drawing a walk against Jack Leiter. Carlos Correa then hit a weak comebacker toward the mound; Leiter tried to throw while on the ground but airmailed the ball far beyond the reach of first baseman Jake Burger. Peña scored easily as Adolis García retrieved the ball, but the right fielder’s throw home was nearly in time to nab Alvarez, who instead of sliding went in standing up, only to slip on home plate. He immediately began limping, had to be helped into the dugout, and did not return to the field — he started in left field — when the half-inning ended. Instead, right fielder Jesús Sánchez shifted to left and Zach Cole entered the game in right. Cole, who homered off the Braves Hurston Waldrep in his first major league plate appearance on September 12, hit his second homer off Leiter in the fifth inning of what turned out to be a 6-3 win.
“When he stepped on home plate, I had a front-row seat,” Peña said after the game. “His ankle kind of twisted, and when he had to plant again, I saw it twist again. And it’s not pretty. You don’t want to see that, especially Yordan Alvarez. We need him.”
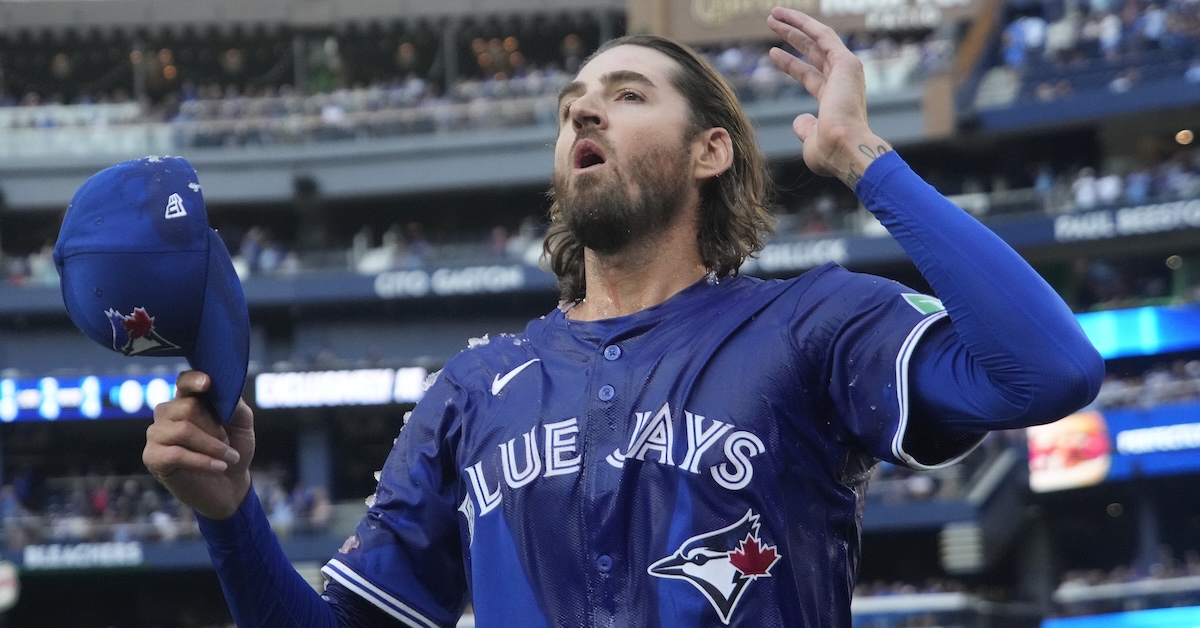
Keegan Matheson has a beard. Let’s start there. Matheson is MLB.com’s Blue Jays beat writer and he has a beard. It’s a big, glorious, pointy beard, and it’s attached to his face and everything.
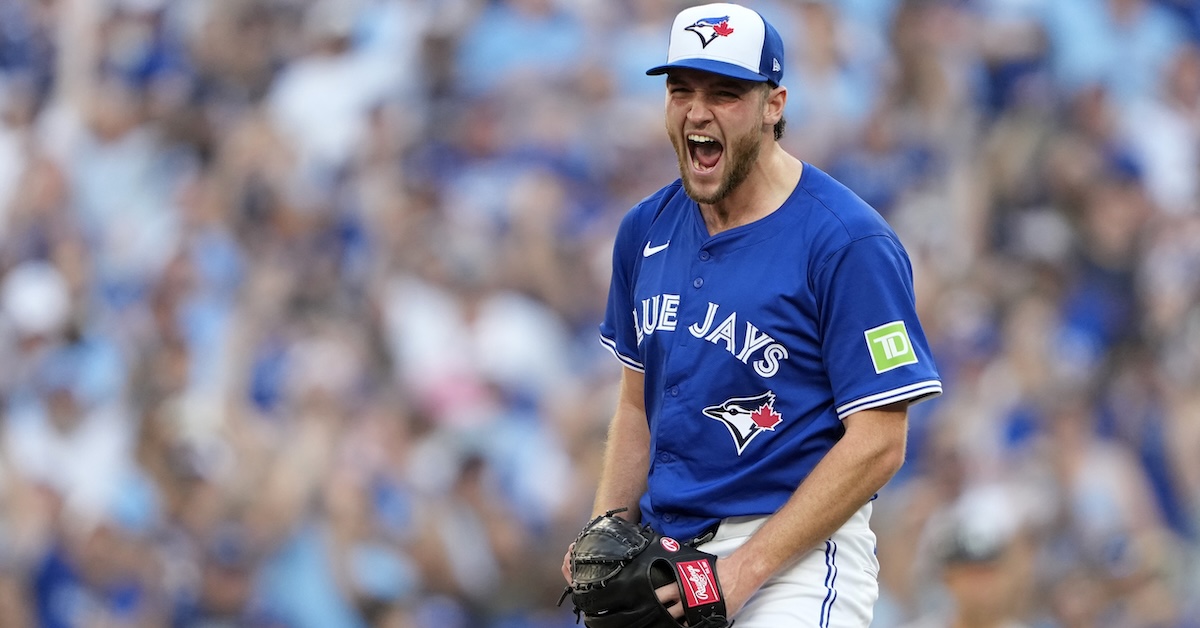
Blue Jays starter Kevin Gausman has a beard too. It’s not glorious like Matheson’s. The right-hander usually opts for a few days’ growth, but in recent weeks, he’s been going a step further. It’s still patchy in the cheeks. Closeups show you individual hairs splayed in whichever direction their whimsy takes them. All the same, more often than not, Gausman has been moving beyond stubble status and into the beginnings of beard territory. Gausman has also been pitching quite well lately, running a 2.25 ERA and 3.00 FIP over his past 10 starts.
Last Thursday, Matheson watched Gausman mow down the Astros, pitching a shutout with nine strikeouts, two walks, and one hit, and made the connection. “The nerds won’t tell you this because their charts won’t show it,” he posted on Bluesky, “but Kevin Gausman’s recent hot streak has a direct correlation to him embracing a beard. Something to monitor.” Read the rest of this entry »
Are you a fan of a team in playoff position? Are you tearing your hair out because their bullpen has been completely unable to get anybody out over the past couple weeks? Is this starting to get creepy? Does it feel as if I’m staring straight into your very soul? Worry not. I’m just playing the odds. Below is a table that shows bullpen performance over the last 14 days, but only for the 13 teams with at least a 12% chance of making the playoffs. I’ve highlighted the teams whose ERA ranks in the bottom half of the league over that stretch:
Bullpens Over the Last 14 Days
Team
ERA Rank
ERA
FIP Rank
FIP
Red Sox
5
3.40
7
3.37
Mariners
12
4.08
1
2.79
Dodgers
13
4.11
10
3.51
Astros
14
4.27
15
3.98
Phillies
15
4.29
14
3.88
Tigers
16
4.34
25
5.29
Rangers
17
4.46
5
3.28
Brewers
18
4.67
6
3.29
Padres
20
4.70
22
4.63
Mets
21
5.03
13
3.64
Yankees
23
5.23
2
2.93
Cubs
25
5.26
17
4.21
Blue Jays
26
5.28
19
4.29
There are the Red Sox in fifth place, looking solid with a 3.40 ERA. But, uh, this not exactly an encouraging sign for all these playoff teams. That’s a lot of yellow. Boston is the only team in the top 10; no one else has a bullpen ERA below 4.00. Only five of these teams are even in the top half of the league. The Mets, Yankees, Cubs, and Blue Jays all have ERAs over 5.00.
The Brewers are tied with the Twins for the league lead with five blown saves in the past two weeks. The Blue Jays and Phillies each have four. Just a reminder: The Brewers have the best record in baseball, and the Blue Jays and Phillies are tied for the second best. All of sudden, none of them can close out a game to save their lives.
Once again, I need to disavow any supernatural influence here. I don’t think there’s a paranormal reason that seemingly every good baseball team’s bullpen is in a rut. It’s mostly a coincidence. If we look at FIP, things are much more reasonable. Six of our 13 teams are in the top 10, and only four are in the bottom half of the league. That’s pretty much what you’d expect. Most of the good teams have strong bullpens. This is a short stretch, a small sample of innings, and a volatile cohort to start with. The Brewers’ bullpen has an excellent 3.29 FIP over the past two weeks, but it’s blown five saves anyway. Stuff happens.
I’ll break down the four teams at the bottom of the table along with a couple others I found noteworthy due to injury reasons, or because I’m worried about them heading into the playoffs, but that’s mostly what I wanted to tell you. All the bullpens seem to be blowing up right now. It’s weird. If you’re tearing your hair out because we’re in September and your bullpen can’t hold on to a lead, relax. First, there may be enough time to right the ship. Second, whoever you’re facing in the playoffs can’t hold a lead right now either, unless it’s the Red Sox (who gave up eight runs in a bullpen game last night, presumably because that’s what all the cool kids are doing).
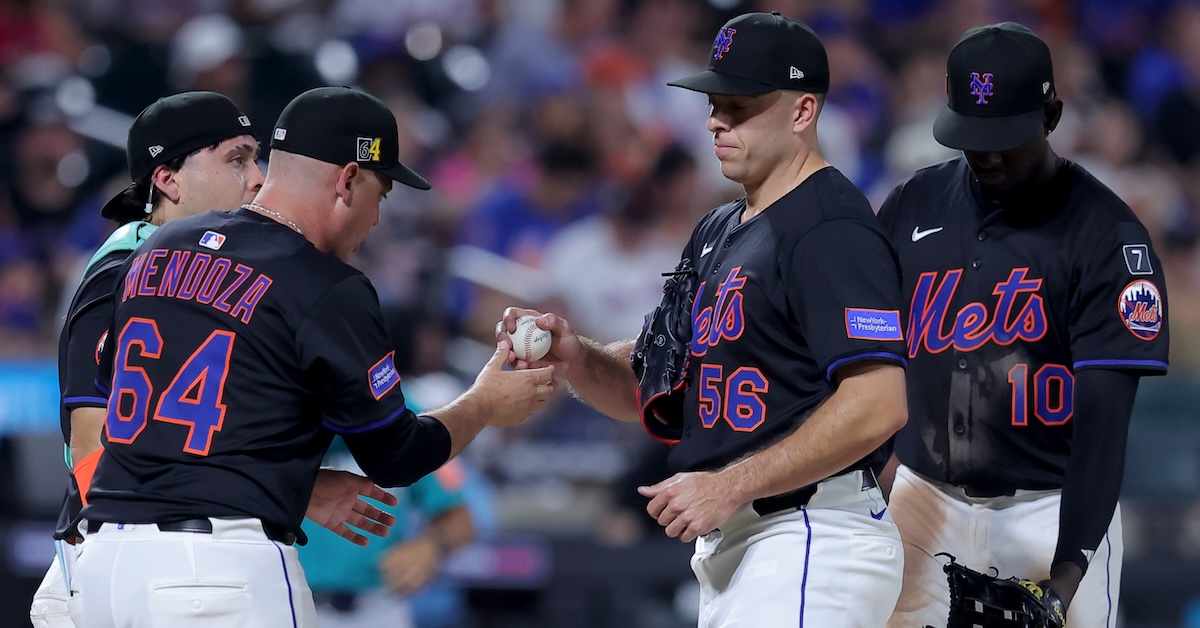
Mets
The Mets lead the league with a whopping six relievers on the IL right now: Reed Garrett, Drew Smith, Danny Young, A.J. Minter, Max Kranick, and Dedniel Núñez. Smith, Minter, Kranick, and Garrett had all been pitching well before their injuries. That’s four good relievers lost, and only Garrett has a chance to return this season. That’s how the Mets ended up claiming Wander Suero, who has thrown just 6 1/3 major league innings in the last two seasons combined, from the Braves off waivers yesterday. Suero has a 1.35 ERA and 2.63 FIP over 46 2/3 innings in Triple-A Gwinnett, and he will get the chance to prove that’s not a fluke. The Mets called him up less than half an hour ago to take the spot of the struggling Kodai Senga, who has been optioned to Syracuse.
More than that, Ryan Helsley has been completely ineffective since the deadline trade that brought him to New York from St. Louis. He had a 3.00 ERA and 3.56 FIP as a Cardinal, and he has a 11.45 ERA and 6.50 FIP as a Met. Helsley said last week that he thinks he’s been tipping pitches. With any luck, he’ll get that sorted out. If he does that and Garrett comes back pitching well, they’ll join Tyler Rogers, lefties Brooks Raley and Gregory Soto, and closer Edwin Díaz, all of whom are putting up good numbers this season. Somehow the Mets could still put together a solid bullpen going into the playoffs.
Dodgers
The Dodgers’ relievers rank third in the majors with 5.2 WAR this season, but that’s mostly because they’ve been asked to throw 570 1/3 innings, the most in baseball. At the moment, RosterResource says they’re tied with the Brewers at five injured relievers, one behind the Mets. They lost Evan Phillips to Tommy John surgery in May, deadline acquisition Brock Stewart went on the IL with shoulder inflammation almost immediately after the trade, and Alex Vesia strained an oblique on August 21. Jack Dreyer, Justin Wrobleski, and Ben Casparius are the only relievers on the team with FIPs below 3.50. Tanner Scott and Kirby Yates are load-bearing pieces who have taken major steps back and lost time to injury besides, and yet the Dodgers are still one of the higher teams on the list. After missing time with forearm tightness earlier in the season, Blake Treinen has allowed just two runs in his last 12 appearances, and his ERA is down to 3.00.
Yankees
The headliner here is the 5.60 ERA that Devin Williams has put up this season, but as Michael Baumann wrote earlier today, the underlying numbers aren’t that bad. They’re maybe even good. The Yankees lost Jake Cousins to Tommy John surgery in June and Jonathan Loáisiga to a flexor strain in August. Brent Headrick is also on the IL after taking a line drive off his pitching arm. The Yankees have also suffered blowups from Paul Blackburn and Yerry De los Santos. They pulled the plug on deadline acquisition Jake Bird almost immediately. He had a 4.73 ERA and and 3.50 FIP in Colorado before the deadline, but he got into just three games for the Yankees, allowing six runs over two innings before being optioned to Triple-A, where he has continued to struggle. Luke Weaver has been bitten by the home run bug lately, allowing four in his last seven appearances for an ERA of 5.14. However, his average exit velocity over that stretch is lower than it’s been the rest of the season, and he’s run a 2.53 xFIP. It seems more like bad luck than anything.
Fernando Cruz and David Bednar have been lights-out, Tim Hill is still a groundball machine, and Camilo Doval hasn’t allowed a run in his last five appearances. Over the entire season, the Yankees bullpen has a 3.93 xFIP, tied for second-best in baseball. Over the past two weeks, they’ve got the second-best FIP despite the hideous ERA. It’s hard to imagine them making a run without Williams and Weaver (The Deadly W’s) turning things around, but this isn’t necessarily a disastrous ‘pen either.
Cubs
By most metrics, the Cubs bullpen has been right in the middle of the pack this year. In the past two weeks, its 3.05 xFIP is the third best in baseball. So why are the ERA and FIP so ugly? That’s the danger of playing in homer-friendly Wrigley Field in August. Over that stretch, 21.1% of their fly balls have gone for home runs, second only to the Rockies (and not coincidentally, they recently spent a three-game series in Colorado). Drew Pomeranz and Taylor Rogers have put up good seasons, but have each given up a couple of homers in recent weeks, and because the Cubs have relied on their bullpen less than just about any other team over that stretch, those mistakes have been magnified. Nothing that’s happened in the past two weeks has made me change my opinion of this relief corps.
Phillies
Philadelphia’s bullpen has been an issue all year long. Free agent signings Joe Ross and Jordan Romano have not worked out at all, putting up a combined -0.5 WAR over 86 appearances and 93 2/3 innings. The good news is that the bullpen looks very different now. The Phillies released Ross, and Romano hit the IL with middle finger inflammation. They signed David Robertson in free agency in July, traded for Jhoan Duran at the deadline, and got star lefty José Alvarado back from an 80-game PED suspension on August 20. Alvardo has looked very rusty since his return and won’t be available for the playoffs, but Robertson and Duran have been excellent. Together with Matt Strahm, Orion Kerkering, and Tanner Banks, the Phillies should have a serviceable, if shallow, bullpen going into October. With Zack Wheeler out and Aaron Nola struggling, the rotation may be the bigger concern.
Blue Jays
How much time do you have? The Blue Jays had the worst bullpen in baseball in 2024, and if nothing else, they looked primed to bounce back. They non-tendered Jordan Romano. They signed the excellent Jeff Hoffman, traded for Nick Sandlin, brought back Yimi García and Ryan Yarbrough, and took flyers on arms like Amir Garrett, Jacob Barnes, and Richard Lovelady. And they have bounced back. They rank in the middle of the pack in both ERA and FIP, and seventh in xFIP. Lately, though, they just can’t seem to get outs.
They released Yarbrough before the season. The fliers they took haven’t worked out, nor have in-house guys like Chad Green, Zach Pop, and Erik Swanson. They’ve lost major pieces, with both Sandlin and García out for the season. Other injuries forced Easton Lucas and Eric Lauer into starting roles, where they’ve performed significantly worse. Hoffman put up three ugly performances in the last week of August, though he’s looked much better in the past week. Although the underlying numbers aren’t bad, deadline acquisition Louis Varland has a 6.91 ERA in 15 appearances as a Blue Jay.
If Hoffman can keep things straightened out, if Varland’s luck can turn around, if Lucas and Lauer can get back in the bullpen, if the arms that got them here – Yariel Rodríguez, Brendon Little, Braydon Fisher – can keep doing what they’re doing, the Blue Jays could have a decent bullpen going into the playoffs. But that’s a lot of ifs.
Gary A. Vasquez, Jerome Miron, and Charles LeClaire – Imagn Images
The Rangers really can’t catch a break. Just after I wrote about Nathan Eovaldi’s sneaky great season, the 35-year-old righty briefly took over the official AL ERA lead. Before he could make another start, however, the Rangers announced that Eovaldi would likely miss the remainder of the season due to a rotator cuff strain. As if losing their most effective starting pitcher wasn’t enough, the Rangers also announced on Thursday that Corey Seager, their top hitter, had undergone an appendectomy, putting the rest of his season in doubt.
With his seven-inning, nine-strikeout, one-run effort against the Guardians last Friday, Eovaldi lowered his ERA to 1.73 in 130 innings, exactly enough to qualify based on the Rangers’ 130 games to that point. With that, he snuck ahead of Tarik Skubal (2.32), Hunter Brown (2.36) and Garrett Crochet (2.46) on the AL leaderboard, completing a game of catch-up caused primarily by his missing nearly all of June due to posterior elbow inflammation. Unfortunately, post-start soreness led Eovaldi to shut down his regularly scheduled bullpen session and get an MRI, which revealed a rotator cuff strain.
The 31-year-old Seager has hit .271/.373/.487 for a team-high 136 wRC+; his 21 homers and 3.9 WAR are also tops on the Rangers. He already made two trips to the injured list in April and May for a recurrent right hamstring strain and so has played just 102 games, that after being limited to 123 last year by a sports hernia and 119 in 2023 due to a left hamstring strain and a right thumb sprain. He’s been replaced on the roster by infielder Dylan Moore, who was recently released by the Mariners, but the likely replacement for him in the lineup is superutilityman Josh Smith, who has hit .256/.333/.378 (101 wRC+) while playing every position besides pitcher and catcher. Read the rest of this entry »