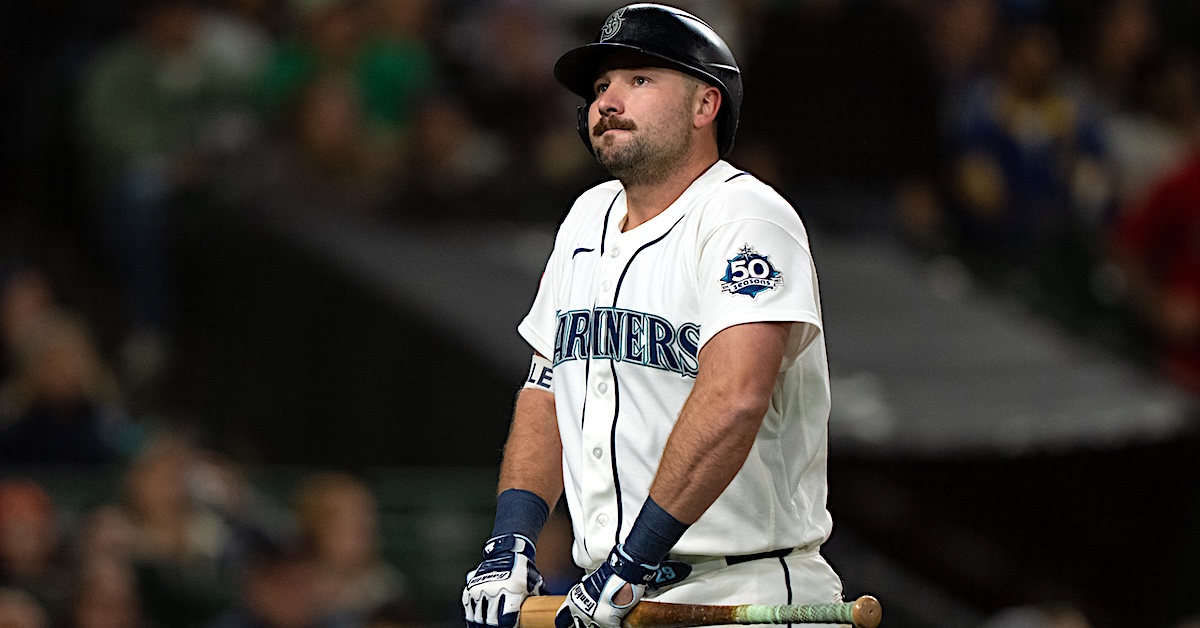
The Mariners did not record a single in their first two games of 2026. No team had ever done that in major league history. In fact, only eight teams have ever gone back-to-back games without a single, according to MLB.com’s Sarah Langs.
The reason is obvious. The Mariners didn’t hit a single because they didn’t put the ball in play very often. And frankly, how could they? Guardians pitchers threw less than 40% of their pitches in the zone, and the Mariners were forced to lay off them, drawing walks in 13.6% of their plate appearances during those two games. When the Guardians did enter the zone, the Mariners struggled to make contact, striking out 35.8% of the time. That means only 34 (50.8%) of their plate appearances ended with a batted ball. And because the Mariners employ a number of sluggers, six of those batted balls flew over the fence. Read the rest of this entry »
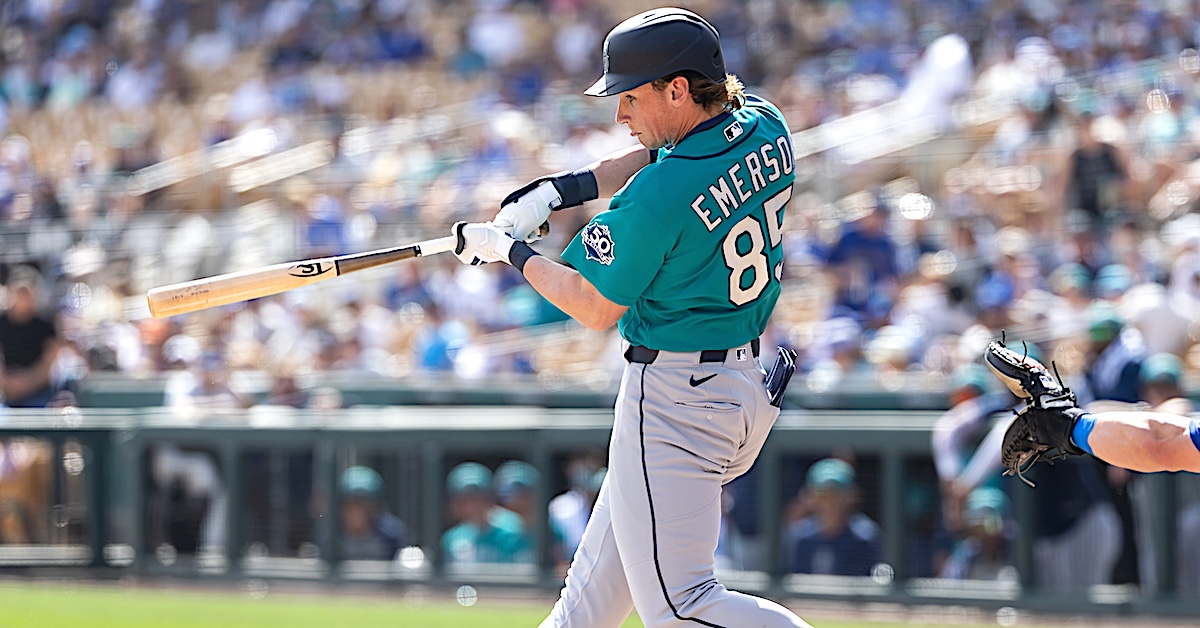
Apparently not wanting to be left out of the flurryofcontractextensionshanded out over the last two weeks, the Seattle Mariners signed a big one of their own, locking up infield prospect Colt Emerson to an eight-year contract that guarantees him $95 million over the next eight years. This includes a $1 million salary for 2026, meaning that the contract goes through the end of the 2033 season, with the Mariners holding a 2034 club option that could staple another $25 million onto the back of the contract. Emerson’s deal also includes a no-trade clause and bonuses for All-Star selections and Silver Slugger and MVP awards, de rigueur in deals such as this.
While Emerson doesn’t have one mind-blowing tool that absolutely obliterates the cognitive pathways of watchers, he’s very accomplished at basically everything he does. He’s not going to regularly blast Stantonian shots, but he’ll hit his fair share of home runs, ZiPS thinks 15-20 a year if he played home games at a neutral site rather than T-Mobile Park. Emerson is willing to draw walks, but he still retains a fundamental aggression at the plate; that’s a good thing, as being too passive is a frequent pitfall for prospects who take a good amount of free passes. There’s no whiff problem hiding in his advanced stats, either. He’s not a burner on the basepaths like Trea Turner or Bobby Witt Jr., but at the same time, he’s not me with a belly full of Cool Ranch Doritos, a 32-ounce deli container of beer, and a hamstring that hasn’t gotten a whole lot of use since the Clinton administration. It doesn’t seem like there are any serious concerns about his sticking at shortstop, and the coordinate-based method that ZiPS uses for minor leaguers sees him as a solid B+ defender at the position. Let’s crank out those projections. Read the rest of this entry »
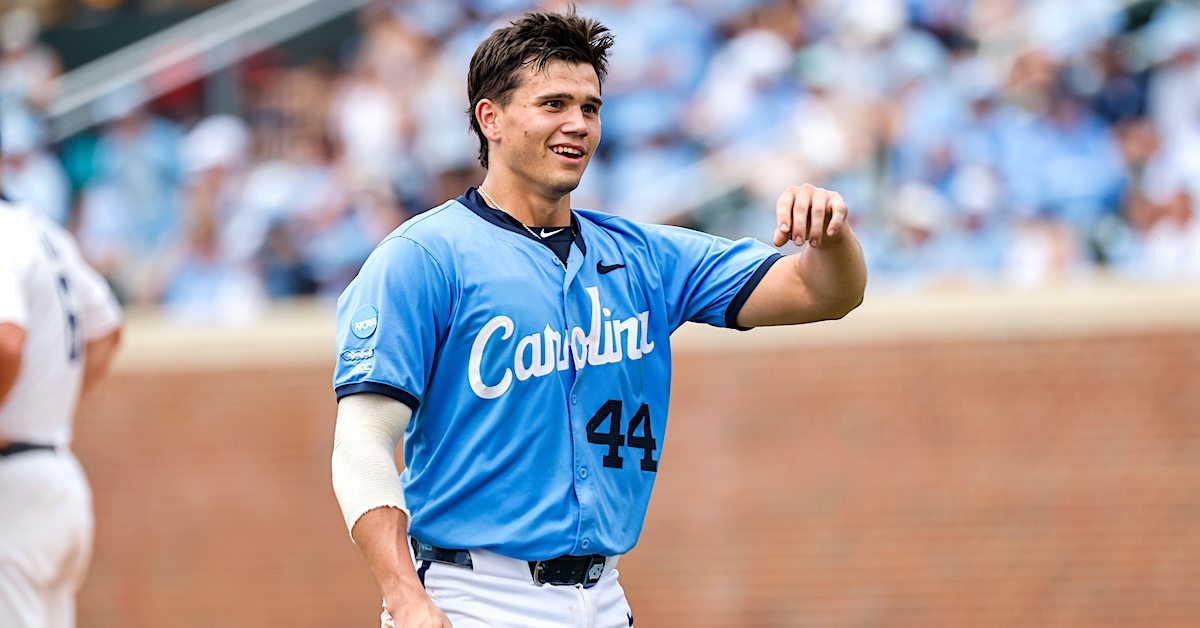
Luke Stevenson was quoted earlier this month when I wrote about how Ryan Sloan and Kade Anderson profile as Seattle Aces in the Making. My spring training conversation with the 21-year-old backstop also included what he had to say about his own skill set, which in many respects it is similar to what Cal Raleigh’s was in the minors. Stevenson’s FanGraphs scouting report, which included mention of the Mariners’ All-Star slugger, described him as “a power-hitting catcher with strong receiving skills.” Drafted 35th overall last year out of the University of North Carolina, he currently ranks as the eighth-best prospect in the Seattle system, with a 45 FV.
Brendan Gawlowski did the write-ups on our Mariners list, and he sees the potential for more from Stevenson. As Brendan put it, “If there is any jump in Stevenson’s throwing ability or bat-to-ball as he develops, he’ll climb into that [50] tier on subsequent lists.” The Raleigh comparison fits here, as well. Described as having a “power-and-OBP-over-hit profile,” Big Dumper ranked seventh in the system with a 45 FV when he reached the majors in July 2021 at age 24.
Stevenson didn’t shy away from the comp when I brought up their early-career similarities.
“I would love to get compared to him,” said the former Tar Heel, who debuted professionally with Low-A Modesto last summer and slashed .280/.460/.400 over 100 plate appearances “He’s unbelievable. Being able to work with him here in camp has been awesome, and super helpful. What he does… I mean, I definitely would like my game to resemble his.”
My mention of the power-over-hit element of his profile elicited a bit of pushback, but his response was largely a validation of Brendan’s report. Read the rest of this entry »
Tarik Skubal commanded the zone while dominating the San Diego Padres on Thursday. Making his third straight Opening Day start for the Detroit Tigers, the reigning back-to-back Cy Young Award winner threw 49 of 74 pitches for strikes, including 17 of 22 to start an at-bat. Moreover, he mixed with aplomb. Skubal garnered 14 called strikes, 10 of them on either his four-seamer or sinker, as well as 11 whiffs, nine coming on changeups. He departed after six innings having surrendered just three hits, with six strikeouts and nary a free pass.
His M.O. for attacking the strike zone? I asked the 29-year-old southpaw about that following one of his spring training outings earlier this month. As it has become increasingly common for pitchers — particularly power pitchers — to aim middle and let their stuff play from there, I wanted to know how precise he is with intended location.
“My changeup, I throw down the middle, but that’s because when I throw it down the middle, the result is down and away,” replied Skubal. “And when I throw my slider down the middle, the result is glove-side and down. So, there are pitches I throw down the middle, but that’s just visually, as opposed to what I’m actually doing.
“I feel like I do a good job of throwing strikes,” continued Skubal. “As far as really executing every pitch that I throw… I don’t know. There is probably a metric on it. I’d like to think I’m a little bit above average, but I don’t know what the numbers say.“
Measuring command is an imperfect science, so where Skubal ranks depends on your metric of choice. According to our PitchingBot model, he was among the best of the best. Last season, Skubal graded out at 64 (on a 20-80 scale) tying him with Seattle’s Bryan Woo at the top of our botCmd leaderboard. Read the rest of this entry »
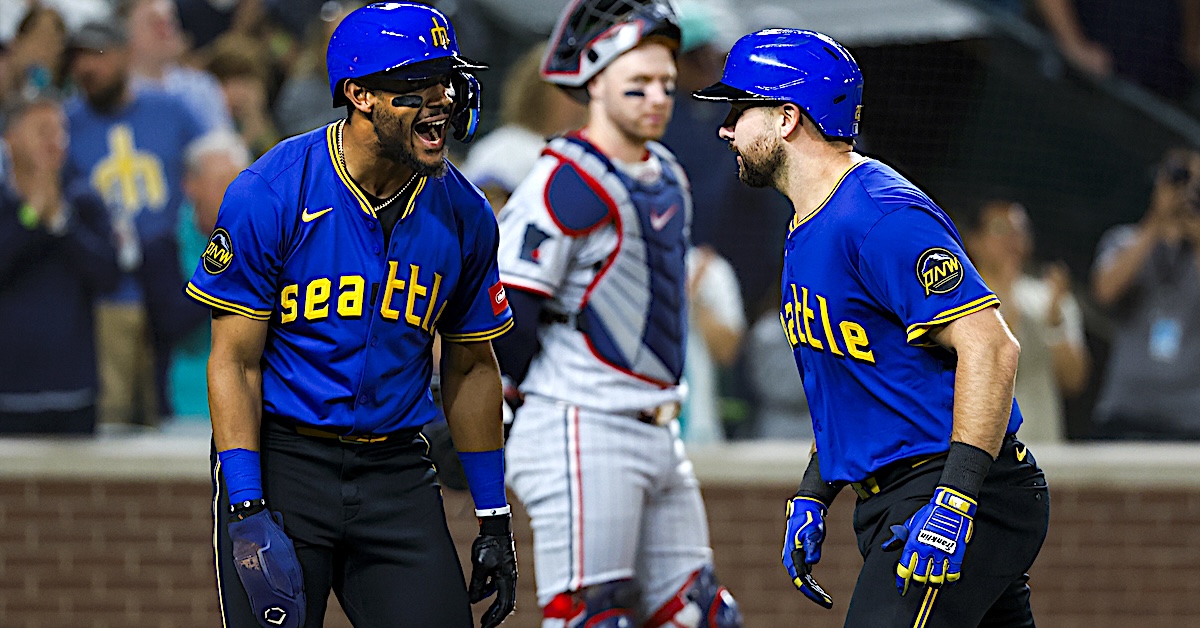
Since their first season together in 2022, Raleigh and Rodríguez have combined for 44.2 WAR. At 11.1 wins per season, that’s “on pace” for the best duo in team history, just ahead of Ken Griffey Jr. and Alex Rodriguez (65.9 WAR over six years), Griffey and Edgar Martinez (119.3 WAR over 11 years), and all sorts of other combinations from the star-studded squads of the 90s. Raleigh and Rodríguez certainly have much more to achieve before approaching these all-time greats, individually or together. But as the Mariners enter their 50th season, it appears the legacy of the franchise may finally be moving beyond its past. Read the rest of this entry »
Trey Yesavage profiles as a strong Rookie of the Year candidate, but he won’t have a chance to begin building his case in the near term. The 22-year-old Toronto Blue Jays right-hander landed on the injured list due to shoulder impingement and won’t be ready when the season gets underway later this week. His return is expected to come sooner rather than later — fingers are crossed throughout Canada — but for now, Yesavage is on the shelf.
Five months ago he was turning heads in the World Series. With just six MLB outings under his belt — three in the regular season, and three across the ALDS and ALCS — Yesavage bedeviled LA batters with an array of high-riding heaters and diving splitters. He was especially dominant in Game 5, fanning a dozen Dodgers while allowing three baserunners and a lone run over seven frames.
His meteoric rise and eye-popping postseason performances raised his public persona, but the Pottstown, Pennsylvania native hasn’t otherwise changed since being drafted 22nd overall in 2024 out of East Carolina University. He’s still polite and unassuming, and his overpowering arsenal has remained in place.
“I’m pretty much the same dude,” Yesavage told me at Blue Jays camp last week. “The pitches are the same. The velocity and movement are the same. I also don’t look at [the metrics] all that much. Whenever Trackman is up on the board, all I really look at is the vert on my heater, and the velo. The only questions I’ll ask my pitching coach are to make sure that my most-used pitch is in line.”
That would be his four-seam fastball, which averaged 94.7 mph and 19.5 inches of induced vertical break across his smattering of regular season outings. Thrown at a 45.2% clip, the offering was augmenting by a slider (28.4%) and a splitter (26.4%), the last of those offerings being the righty’s most lethal weapon. A quintessential complement to his well-elevated heaters, Yesavage’s splitter induced a 57.1% whiff rate and a .111 BAA against big-league hitters.
He began tinkering with his signature pitch in the middle of his three collegiate seasons, but it wasn’t until his draft year that the efforts bore fruit. Read the rest of this entry »
Yes, every once in a while a team will pretend to have four or six slots, but that team must inevitably confront the truth: Starting rotations have five slots. It’s a matter of policy, preference, and just plain practicality, Mariners general manager Justin Hollander said last year in an interview with Lookout Landing.
“The unfortunate thing about the roster rules is you only get 26 spots, and you only get 13 pitchers. And when you add a sixth starter, you take away a reliever. When you add a sixth starter, sometimes your starters pitch every six days, sometimes they pitch every eight or nine days. Starting pitchers are fussy. They don’t like that. They like to stay on a regular schedule. They like to know when they’re pitching.”
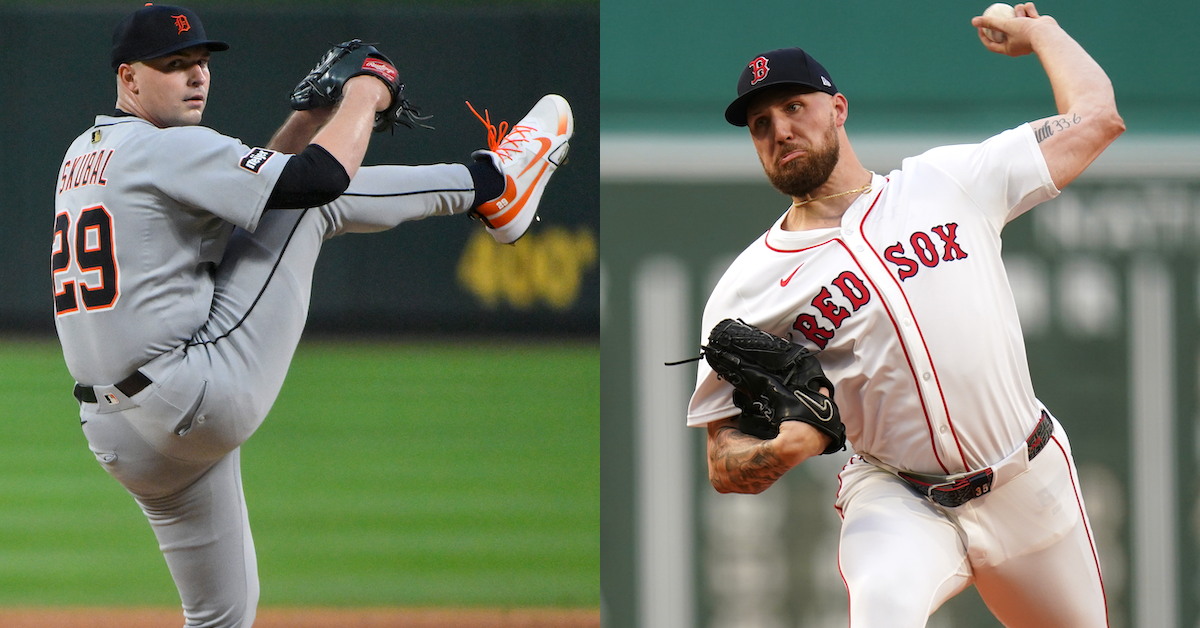
I’ve been thinking about the fixed-nature of rotations lately after reading this discussion between Eno Saris and Jen McCaffrey in The Athletic. They compare the rotations in Detroit and Boston by assigning each pitcher a label (one, two, three, four, five), sizing them up horizontally and vertically, and confronting the trade-offs in quality and depth. This reflects how many of us compare rotations in the abstract, and I wanted to see if this could be applied more broadly. Read the rest of this entry »
I’ve now spent nearly a quarter of a century working with baseball projections, and in that time, I’ve always been struck by the certainty with which so many people view them. People are far more certain than they should be that great teams will be great, star players will be stars, and so on. However, one of the things that comes from working with projections for a big chunk of your life is that you develop a painful awareness of how much of the future cannot be known until it actually happens.
As in most seasons, we enter without a general conception of which teams will be the best. We may pretend everyone starts off with a clean slate, but absolutely nobody expects the Rockies to be better than the Dodgers. But even if that particular scenario is extremely unlikely, every one of the top teams has a scenario in which things fall apart. These clubs have a vested interest in protecting against that potential downside, as much as possible, so I thought it would be interesting to look at the doomsday scenario for some of the best teams in baseball.
To get an idea, I did a full seasonal simulation of the ZiPS projected standings, and instead of looking at the standings overall, I looked at the bottom 20% of outcomes to see what we could glean from the results. According to ZiPS, every team except the Dodgers misses the playoffs when it performs no better than its 20th-percentile win total.
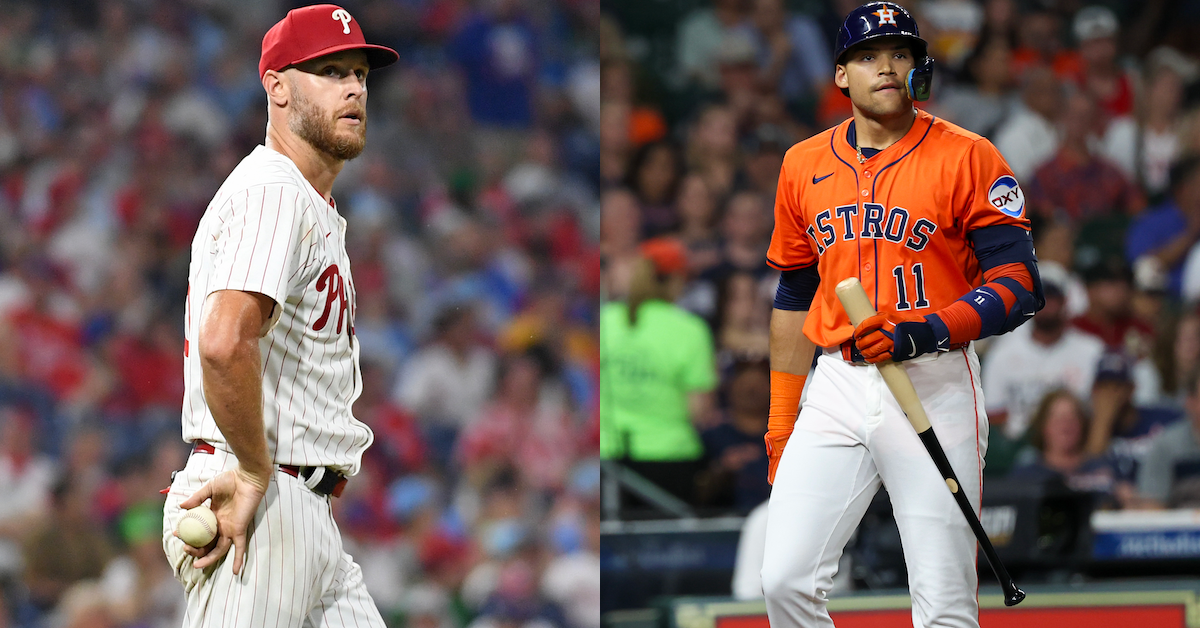
Philadelphia Phillies: Rotation Depth
This almost seems counterintuitive given just how good the rotation projections are for the Phillies, but the projections are not enthusiastic about their depth here. And what makes that especially worrisome is that with so much uncertainty around the health of Zack Wheeler and the performance of Aaron Nola, Philadelphia is probably going to need that depth more than it did last year. This time around, the Phillies are missing Ranger Suarez, who signed with the Red Sox during the offseason. Andrew Painter was healthy in 2025, but one cannot ignore that he was rather middling against Triple-A hitting. The outfield looks like a problem, as well, but it generally has been, and ZiPS is a fan of Justin Crawford.
If Philadelphia adds one of the innings-eaters still available in free agency, ZiPS sees the team’s outlook improve, much more than I expected. Just having someone like Lucas Giolito, Tyler Anderson, or even Patrick Corbin around did a lot to alleviate the rotational downside. It may come down to which of these pitchers is open to a swing role or a minor league deal with an opt-out date. And yes, I do think it feels weird to suggest Corbin as an upgrade for a team in 2026.
New York Mets: Right Field
The Mets certainly don’t dominate in either the rotation or bullpen projections, but ZiPS is fairly confident that both of these units will hold up over the course of the season. Despite a solid projection for Carson Benge in right field, the range of outcomes is quite high, and in the simulations where Benge struggles, ZiPS has trouble competently filling in right field. Tyrone Taylor is an underwhelming option, and ZiPS thinks Brett Baty would have a tough time defensively in the outfield. With no particularly interesting outfielders available in free agency, the best solution might simply be making sure Jacob Reimer gets some time in the outfield. New York’s roster just isn’t really set up to get him time at third base, where he probably is most valuable. But he also represents the most tantalizing 2026 upside of any player the Mets have in the minors, so they ought to try and be open to promoting him aggressively, and getting a little weird with it, if need be.
New York Yankees: Injuries
The Yankees’ outcomes are weird, in that their bad seasons were mostly ones in which Aaron Judge, for whatever reason, ended up with fewer than 300 plate appearances, and only occasionally something else. Getting limited innings from Gerrit Cole and Carlos Rodón was already baked into the cake, and ZiPS thinks there are enough fourth-starter types to patch up any rotation holes that might pop up. The problem is, just how do you replace Judge? I’m not sure there’s a scenario where the Yankees can do much to mitigate any risk there, for the simple reality that in a tightly projected division, suddenly losing six wins is likely to drop them out of the AL East divisional race. At the very least, the Yankees should hold off on shopping Spencer Jones for help elsewhere, but it wouldn’t fix a Judge loss.
Baltimore Orioles: Rotation Quality
Baltimore has potential aces in both Trevor Rogers and Kyle Bradish, but that word potential is an unpleasant adjective. Adding Pete Alonso and Taylor Ward really stabilizes the offense, which was a concern last year, but the rotation is an issue. The Orioles finished with a bottom five rotation in the ZiPS simulations more often than all other AL East teams combined. There’s nothing on the farm that helps this, and I think that with the Orioles increasingly pushing their chips in, they ought to be aggressive at taking the opportunity to loot struggling teams of their top pitching, even if the prospect hit would be tremendous. I think there are even scenarios, though not many, in which it might make sense for the O’s to trade either Adley Rutschman, assuming he has a bounce-back season, or Samuel Basallo.
Boston Red Sox: First Base
The good news is that ZiPS sees the Red Sox as the most stable of AL contenders, with the lowest percentage of sub-.500 seasons of any AL team. The rotation isn’t the best in baseball, but it may be the most bulletproof one, and that isn’t even counting on getting lots of innings from pitchers like Payton Tolle and Connelly Early, who would be Plan As in most rotations in baseball. In fact, when the Red Sox had their worst performance, it was almost entirely the offense that fell short, and not necessarily from the position you might expect.
Most people have focused on third base because of the loss of Alex Bregman, but Caleb Durbin is actually a decent option. Plus, if Durbin struggles, Marcelo Mayer could very likely provide what the former isn’t. Where there is real downside risk is at first base. I liked the Willson Contreras acquisition, too, and he’s probably going to be at least solidly average in 2026, but he’s also going to be 34 in May. It’s an age where you look at the long left tails of the outcome distribution for non-elite first basemen, and there’s always a real risk of a very sudden plummet off a cliff. Triston Casas hasn’t played in a game since last May — and won’t even play in any spring training games this year — and he has a real mixed history.
What to do? That’s a lot trickier. Boston obviously isn’t going to replace Contreras before he has that downside year. But this team should be ready for that possibility, and if the surplus of pitching turns out to be real, the Sox will have a position of depth from which to trade.
Chicago Cubs: Rotation Quality
The outlook improved with the addition of Edward Cabrera, but ZiPS still has the Cubs with the weakest rotation of the 10 teams listed here. In the ZiPS simulations, the rotation was largely the source of the Cubs’ worst seasons. There aren’t really any exciting starters left out there in free agency, but I think I’d do what I suspect the Cubs are already thinking of doing: giving Ben Brown’s upside as a starting pitcher more serious consideration. He allowed too many home runs and had a high BABIP on a really good defensive team, but it’s guys like that who tend to come out of nowhere quickly (see Corbin Burnes in 2019). Brown has swing-and-miss stuff, and I think given the potential, I’d rather see him starting at Triple-A than pitching in relief in the majors.
Houston Astros: Outfield Corners
Not counting 2020, for obvious reasons, the 686 runs the Astros scored in 2025 represented their fewest since 2014. A full, healthy season of Yordan Alvarez would be incredibly helpful, but the team’s also not likely to wring another 135 wRC+ out of Jeremy Peña. Not helping matters is that Joey Loperfido and Cam Smith project as one of the weakest corner outfield tandems in the majors in 2026. Smith surprised many, including me, in the early months last year, but an OPS that fell shy of .500 in the second half is highly concerning. There’s a chance that the Astros get little from their outfield corners, which is a problem for a team with a middling offense that just lost ace Framber Valdez in free agency. In some 30% of simulations, the Astros got a sub-90 wRC+ out of their corner outfielders, and in those runs, they had a .475 winning percentage. If there’s a team that should aggressively go after either Jarren Duran or Wilyer Abreu, it’s Houston.
Toronto Blue Jays: Rotation Depth
Even with the loss of Anthony Santander to shoulder surgery, ZiPS still sees the Blue Jays’ rotation as their biggest pain point. There are simply a lot of question marks once you get past Dylan Cease and Kevin Gausman, something I mentioned a bit in Toronto’s ZiPS rundown in January. In a lot of the sims, the team got next to nothing out of any of Cody Ponce, José Berríos, Shane Bieber, and Max Scherzer, whether because of injury, decline, or general performance issues. If Sandy Alcantara looks anywhere near his old self with the Marlins in the early months, I think the Jays ought to be one of his suitors. At the very least, Alcantara would do well with an infield that has Andrés Giménez and Ernie Clement.
Seattle Mariners: Outfield Corners
As with the Astros, ZiPS sees Seattle’s corner outfield spots as having the most downside. Unlike the Astros, ZiPS doesn’t view it as truly a doomsday scenario. After the Red Sox and Dodgers, ZiPS considers the Mariners to be the contender with the least downside. Randy Arozarena’s projection distribution is pretty interesting, with the bottom falling out of him once you get under the 15th-percentile projection or so; while his 20th-percentile OPS+ is a non-disastrous 94, it drops to 70 for the 10th-percentile level. As for Victor Robles, he’s been all over the place in his career, and the Plan Bs in the organization are unimpressive. I think Seattle’s strong enough that it doesn’t necessarily have the same need to be aggressive as Houston does, but this is still a potential point of weakness that could pose an issue.
Los Angeles Dodgers: Black Swans
It’s really hard to kill the Dodgers. I argued after the 2024-2025 offseason, a very busy one, that the Dodgers weren’t really improving their average outcome so much as drastically raising their floor. I stand by it; they’ve added Kyle Tucker and Edwin Díaz while losing nobody who was crucial to the 2025 team. That doesn’t mean they’re going to be projected to win 105 games or anything, but it does mean that in most of their worst projected outcomes, they’re still a playoff contender. Their 10th-percentile projection, for example, is 86 wins. Their 2% chance of finishing below .500 is the smallest percentage I’ve ever projected, a record that now goes back more than 20 years. Doomsday for the Dodgers may require an actual doomsday scenario like societal collapse, nuclear war, or a vacuum metastability event. Since I do not know how to prevent any of those, there’s nothing more I can add.
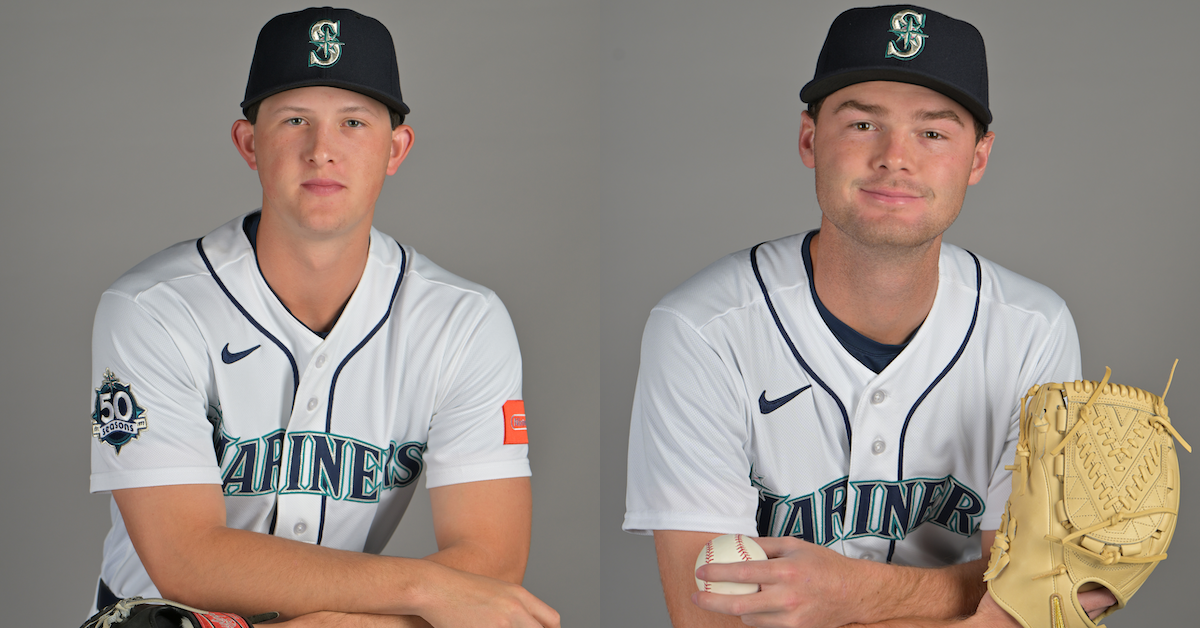
The Seattle Mariners boast two of the game’s most promising young arms. Second and third respectively in a highly regarded farm system, Ryan Sloan and Kade Anderson also reside in the front half of our 2026 Top 100 Prospects list. Sloan, a 20-year-old right-hander, ranks 20th, while Anderson, a 21-year-old southpaw, comes in at no. 50.
How do the two compare in terms of repertoire and approach? Both are profiled in the write-ups that accompany the aforementioned rankings, but what about how the pitchers see themselves? Moreover, how are they viewed by a catcher who knows them well and a prominent member of the organization’s pitching brain trust? Wanting to find out, I spoke to Anderson and Sloan, as well as to Luke Stevenson and Trent Blank, at Seattle’s spring training complex late last month.
Before we get to those perspectives, here are brief snapshots, augmented with quotes from our prospect analyst team of Eric Longenhagen, Brendan Gawlowski, and James Fegan:
Drafted third overall last year out of LSU, Anderson, who threw his first professional pitch this spring, was described as follows: “Maybe the best pitcher in the 2025 draft, [he] projects as a quick-moving mid-rotation starter with a great breaking ball.”
Sloan, who was drafted 55th overall in 2024 out of York Community High School in Elmhurst, Illinois, debuted professionally last season and logged a 3.73 ERA, a 3.18 FIP, and a 27.0% strikeout rate over 82 innings between Low-A Modesto and High-A Everett. “The upside is sky-high here,” wrote our prospect analysts, “and it’s not too early to say Sloan is one of the best pitching prospects in baseball.”
Collin Snider is with Chicago looking to recapture what he had two seasons ago with Seattle. Currently in camp with the Cubs, the 30-year-old right-hander was a pleasant surprise for the Mariners in 2024, logging a 1.94 with a 27.8% strikeout rate over 42 relief outings comprising 41-and-two-thirds innings. Last year was a different story. Hampered by a flexor strain and unable to get back on track, Snider struggled to the tune of a 5.47 ERA across 24 appearances in the majors, then posted an even uglier 8.06 ERA across 25 games with Triple-A Tacoma. Cut loose by Seattle in November, he subsequently inked a deal with the Cubs in December.
Despite the dismal results, Snider wasn’t without suitors. He had options — every team can use more pitching — and in the case of the Cubs, he also had connections. Tyler Zombro, the NL Central club’s Vice President of Pitching Strategy, previously worked at Tread Athletics, where Snider trained in previous offseasons. As the erstwhile Vanderbilt Commodore put it, “That really steered my decision. I like the way the pitching development is here.”
Asked about his poor 2025 performance, Snider pointed to how his injury contributed to bad mechanical habits that resulted in a drop in velocity, as well as “pitch shapes that weren’t the same.” He knew what was happening, but correcting it was another matter.
“I was very rotational, throwing too side-to-side, whereas I need to be north-south,” Snider said. “Side-to-side made the velo go down, because I couldn’t get behind the baseball. I was aware of what was going on, but I didn’t know why I was doing it, or how to make the adjustment quickly. It ended up being one of those things where I needed the offseason to straighten it out.”
Snider averaged 92.5 mph with his four-seamer last season, whereas in the prior two years that number was 94.2 and 95.3. His sweeper was also impacted by his delivery being out of sync. Read the rest of this entry »