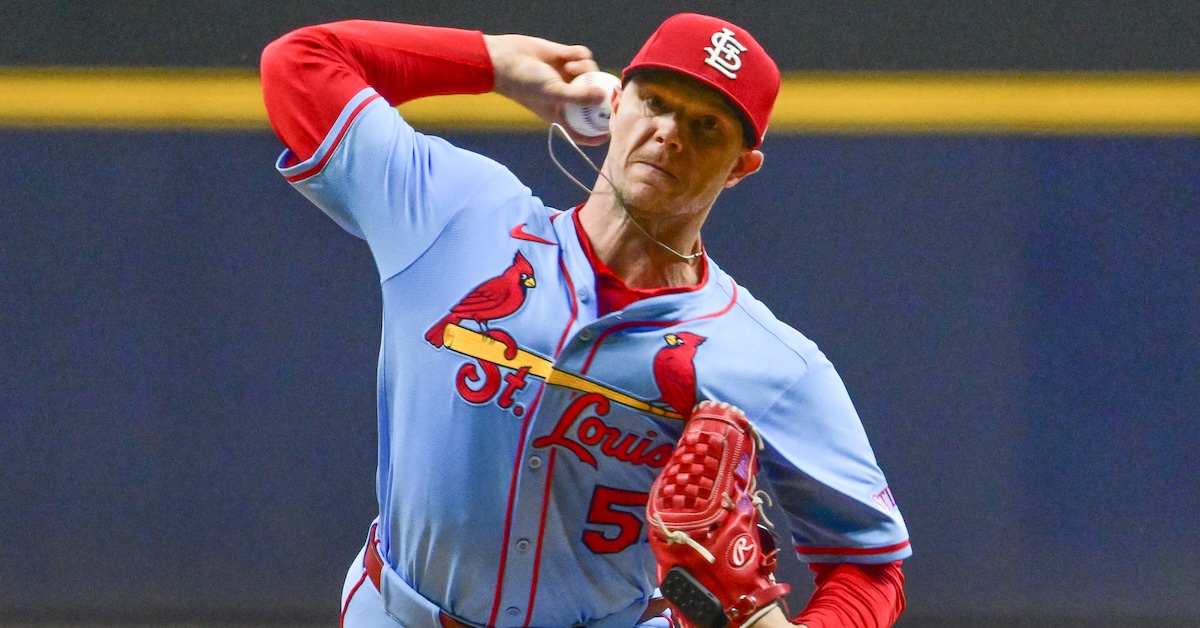
When the Red Sox traded forSonny Gray, they knew they were getting an old-school starter with seven pitches. He’s got a sinker and a four-seamer. He’s got a cutter, a traditional slider, and a sweeper. He’s got a curveball and a changeup. The traditional slider is the only one of the seven that Gray doesn’t throw regularly; the others all saw at least 15% usage against righties or lefties in 2025. Gray is 36 years old. He’s a three-time All-Star with 330 starts and 125 wins under his belt, and a career ERA of 3.58. At this point, you might assume that he’s about as finished a product as you could find, but you’d be wrong, and that seems to be part of the reason he’ll be pitching in Boston next year.
In 2024, the Red Sox made waves for throwing fastballs just 36.6% of the time, the lowest mark ever recorded and almost certainly the lowest mark of all time. That number went up in 2025, in large part because they added Garrett Crochet, who owned a brand-new sinker to go with a four-seamer that was one of the very best pitches in baseball 2024. But it wasn’t just Crochet. Brayan Bello brought back the four-seamer he’d ditched in 2024. A finally-healthy Lucas Giolito threw four-seamers at his highest rate since 2020. With Aroldis Chapman replacing Kenley Jansen, the closer role saw fastballs replace cutters. In all, the Red Sox finished the season with a fastball rate of 48.3%, the 11th-highest in the league. That’s quite a bounce-back. The Red Sox were very explicitly trying to get away from fastballs, but as the 2025 season showed us, the broader goal was to have their pitchers throw their best pitches more often.
That brings us to Gray, who throws the kitchen sink but still throws fastballs 40% of the time. In 2025, he led with his four-seamer against lefties and his sinker against righties, throwing both pitches 29% of the time in those situations. Shortly after the trade went through, Boston’s chief baseball officer Craig Breslow discussed it with reporters. MLB.com’s Ian Brown published a quote: “It will be a great match for Bails [pitching coach Andrew Bailey] and the rest of the pitching group and the philosophies they have in terms of leaning into strength and potentially away from slug and pitching away from fastballs when you have secondaries as your best pitch.” Read the rest of this entry »
The following article is part of Jay Jaffe’s ongoing look at the candidates on the BBWAA 2026 Hall of Fame ballot. For a detailed introduction to this year’s ballot, and other candidates in the series, use the tool above; an introduction to JAWS can be found here. For a tentative schedule and a chance to fill out a Hall of Fame ballot for our crowdsourcing project, see here. All WAR figures refer to the Baseball-Reference version unless otherwise indicated.
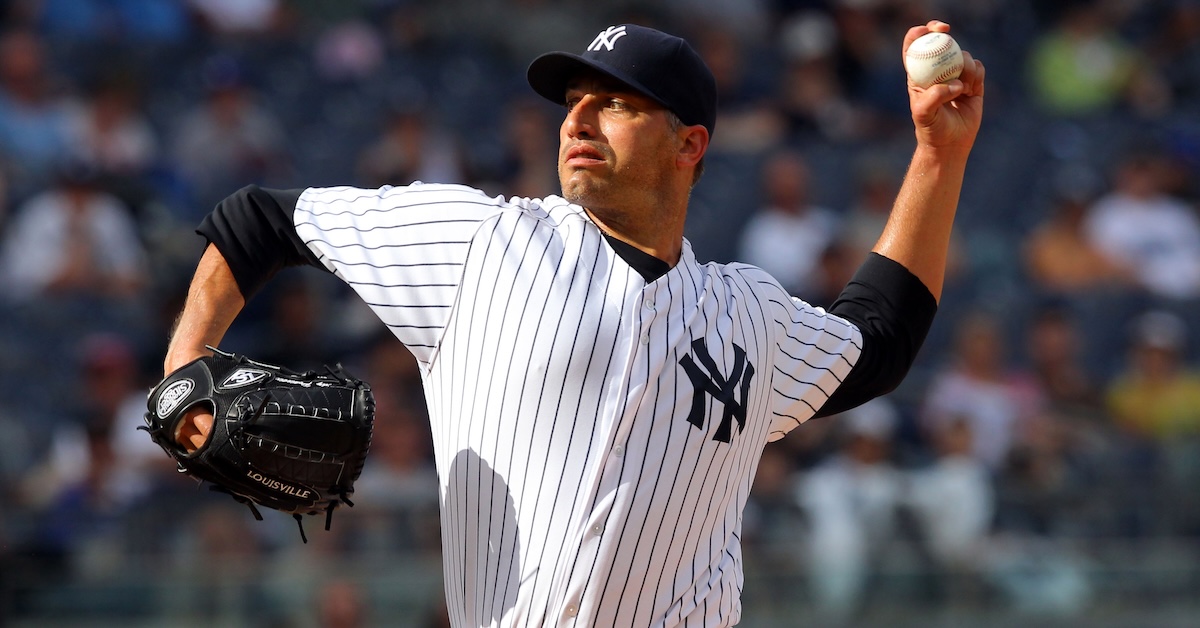
As much as Derek Jeter, Jorge Posada, Mariano Rivera, and Bernie Williams, Andy Pettitte was a pillar of the Joe Torre-era Yankees dynasty. The tall lefty Texan played such a vital role on 13 pinstriped playoff teams and seven pennant winners — plus another trip to the World Series during his three-year run with Houston — that he holds several major postseason records. In fact, no pitcher ever started more potential series clinchers, both in the World Series and the postseason as a whole.
For as important as Pettitte was to the “Core Four” (Williams always gets the short end of the stick on that one) that anchored five championships from 1996 to 2009 — and to an Astros team that reached its first World Series in ’05 — he seldom made a case as one of the game’s top pitchers. High win totals driven by excellent offensive support helped him finish in the top five of his leagues’ Cy Young voting four times, but only three times did he place among the top 10 in ERA or WAR, and he never ranked higher than sixth in strikeouts. He made just three All-Star teams.
Indeed, Pettitte was more grit than glamour. A sinker- and cutter-driven groundballer whose pickoff move was legendary, he was a championship-level innings-eater, a grinder rather than a dominator, a pitcher whose strong work ethic, mental preparation, and focus compensated for his lack of dazzling stuff. About that focus: his peering in for the sign from the catcher with eyes barely visible underneath the brim of his cap was such a visual signature that the Yankees used it on a commemorative patch when they retired his no. 46 in 2015. Read the rest of this entry »
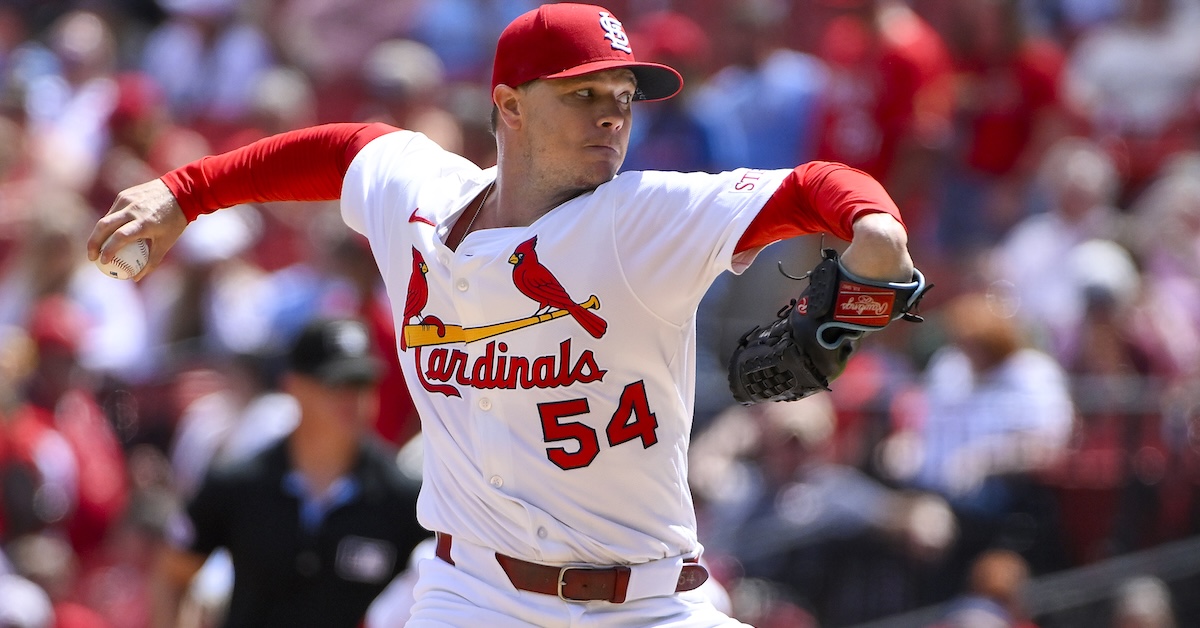
This past Sunday’s Notes column led with a look at Sonny Gray, so my joining in on his introductory Zoom session with the Boston media on Tuesday was mostly a matter of practicality. There are always things to learn — typically pieces of information that are useful down the road — when a trade acquisition takes questions from reporters. I wasn’t expecting to feature the veteran right-hander any time soon.
But then I asked Gray a question, and not only did he answer it thoughtfully, his response was meaty. The newest member of the Red Sox starting rotation spoke, uninterrupted, for a full five minutes. What he said is well worth sharing.
Here is what I asked, and — lightly edited for clarity — Gray’s expansive reply.
In April 2023, we talked about how you’ve evolved as a pitcher. Do you think you’ve settled in to who you’ll be going forward, or do you foresee any changes with your repertoire or usage?
Gray: “I hope there are changes, to be honest with you. If you’re not constantly changing, and you’re not consciously adapting, then I think that you’re going to be stagnant. Right? 2023 was a good jump for me. I added a few things. I changed a few things. But I kept the core of me together. I kept who I am.
“I spin the ball. I spin the ball better than anyone in baseball. That’s a fact. I still have enough velo to allow that to play. That’s a fact. I can take my fastball and go both ways with it, just as good as anyone. I still get my strikeouts. Read the rest of this entry »
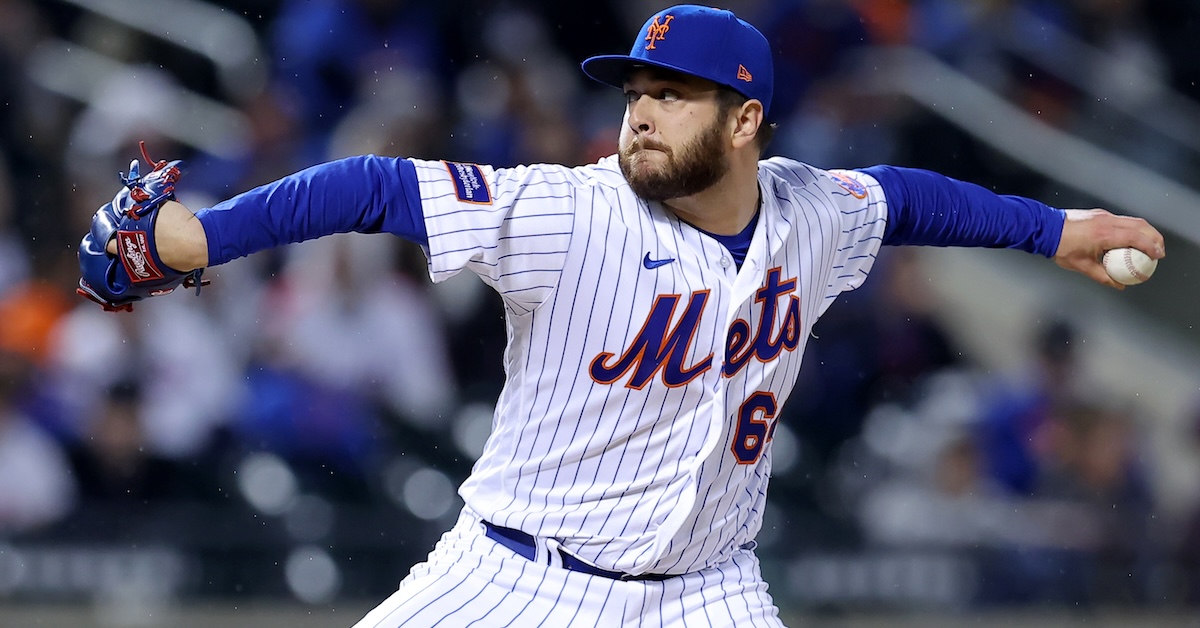
The Chicago White Sox got on the board in free agency on Wednesday morning, inking left-handed pitcher Anthony Kay to a two-year, $12 million contract with a $10 million mutual option for 2028. Kay will make $5 million in each of the next two seasons, with a $2 million buyout due if the mutual option isn’t exercised.
It’s been a huge week for the trans-Pacific starting pitching exchange, with Matt Manninggoing over to the KBO and Cody Poncecoming back in the other direction. Kay spent the past two seasons pitching for the Yokohama DeNA BayStars of NPB — and pitching quite well, it bears mentioning: In 24 starts and 155 innings this past season, Kay posted a 1.74 ERA and a 2.55 FIP. That ERA is a couple tenths better than what Tatsuya Imai, this offseason’s hot Japanese pitching import, posted this season. Read the rest of this entry »
Up and in, low and away. That’s how you attack hitters. That’s always been how you attack hitters. There are exceptions, of course. Some hitters struggle with low-inside pitches, so they see more of them. Some hitters are so feeble that pitchers just pump fastballs down the middle and dare them to do their worst. Some pitchers just throw their best pitch and don’t bother worrying about the hitter at all. But most of the time, it’s up and in, low and away. Ben Clemens wrote about a version of this yesterday, in a piece that focused on the data behind why pitchers throw inside fastballs. And the toughest inside fastballs to hit are those thrown up and in.
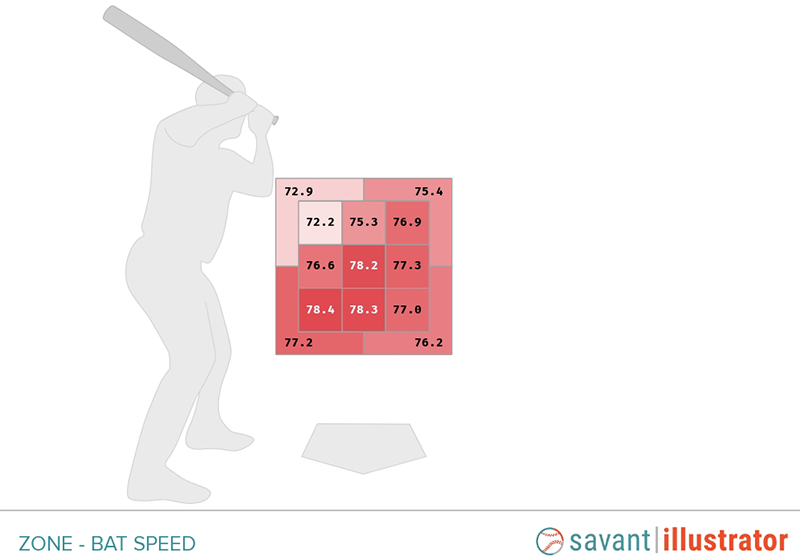
Pitchers have been throwing hard stuff up and in for as long as they’ve been throwing hard stuff, but Statcast’s new bat tracking data allowed us a new peek at why that’s such a successful game plan. The heat map for bat speed below is extra red because it belongs to Aaron Judge, but insofar as the least red spot is the high-inside strike, it might as well belong to any hitter.
It’s harder to get your bat around up there. It requires a stiffer, more rotational (as opposed to linear) swing. You can’t get your arms extended. You can’t drop your bat head on the ball. Bust somebody up and in with something hard, and they’ll have a tough time catching up to it; now confirmed by science.
Because we are not Ben Clemens, we’re going to focus on down and away today, and we’re going to focus on batters. As you can see from Judge’s heat map, bat speed tends to be slower down there too. We’re no longer just talking about getting your arms extended. You have to modify your swing to reach pitches that far away, bending and reaching, slowing down your bat because the optimal contact point is deeper. If there’s one thing we’ve learned from bat tracking data, it’s that those kinds of adjustments make you hemorrhage bat speed. Low and away is also where trickier pitches like offspeed and breaking balls tend to end up. Nobody is good against those pitches, and I do mean nobody.
See the spot in the heat map that says 77.0 mph, inside the strike zone, but on the outer third and in the bottom third? Since 2008, 225 left-handed batters and 297 right-handed batters have seen at least 500 pitches in that low-and-outside box. According to Baseball Savant’s run values, not one of those players has a positive run value against those pitches. Not one! Every single player has been below average in that particular box, and that’s not true of any of the other 12 boxes. The two players who have come closest to breaking even on those low-and-outside strikes are Hall of Famer David Ortiz, who has been worth -0.08 runs per 100 pitches, and future Hall of Famer Mike Trout, who has been worth -0.4. It’s just not possible to perform well against that pitch (at least not without eschewing the rest of the strike zone, but no one would ever do that), even if you’re literally Mike Trout.
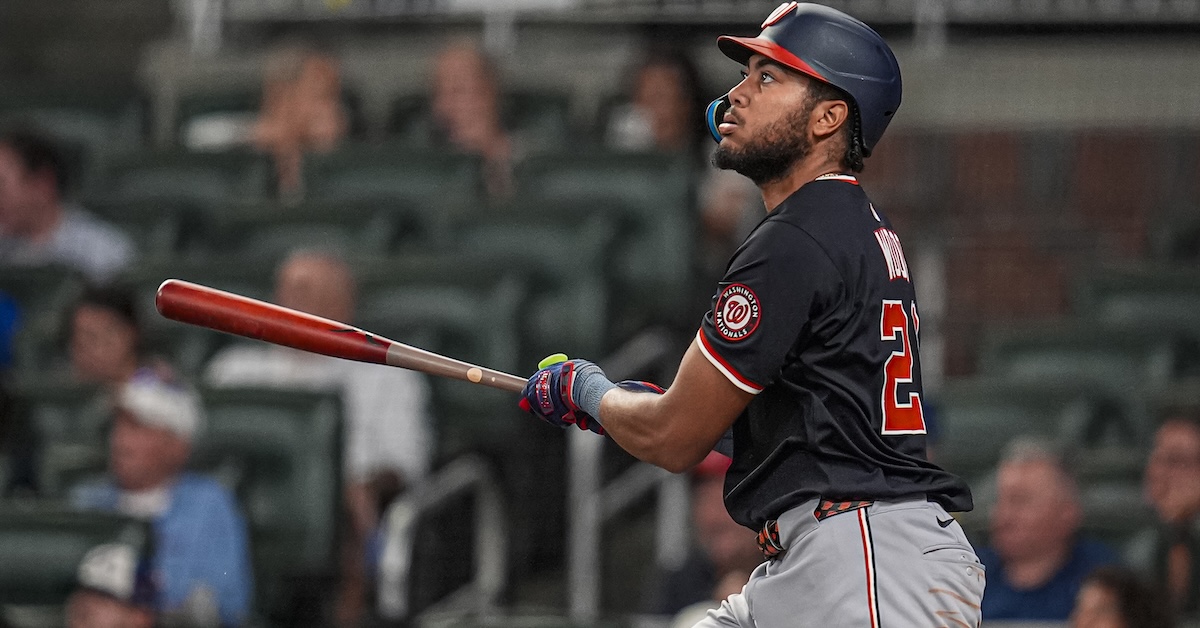
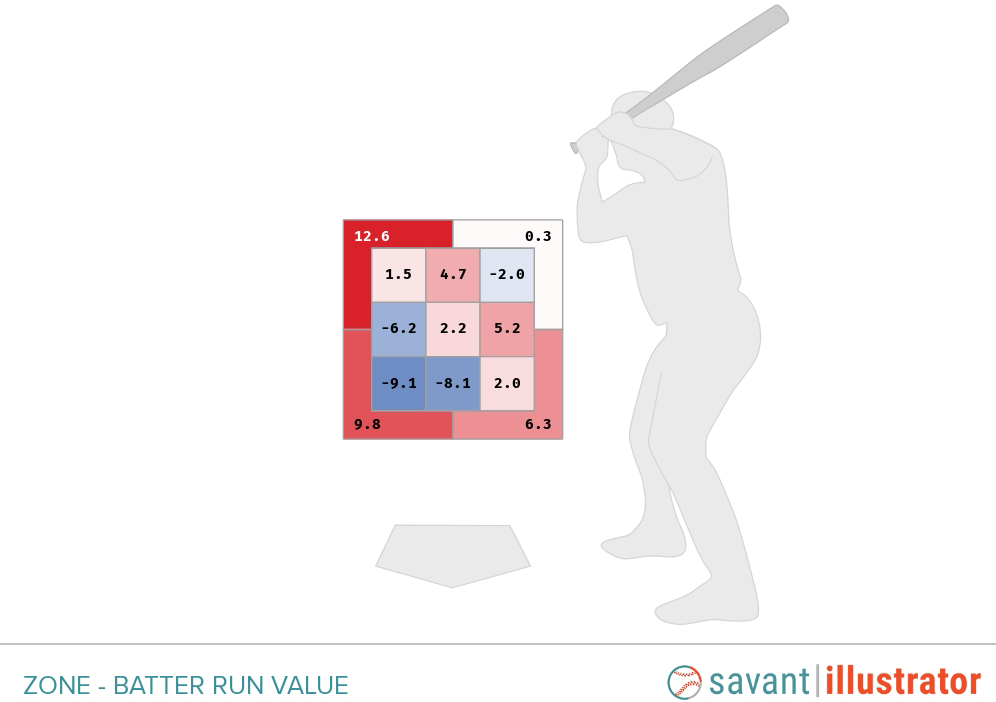
So we’ve established that the low-outside strike is hard to hit. It took 500 words, but we’re here now. The heat map below belongs to James Wood, and it’s part of the reason we’re talking about pitching people low and away. The numbers in this heat map show run value per 100 pitches, and they show why Wood is the poster boy for difficulty down and away.
After a season and a half in the majors, Wood is the proud owner of 4.6 WAR, a 125 wRC+, and one of the most explosive swings in the game. That’s amazing. He’s just 23 years old. He looks like he will be great for at least another decade. He’s also the owner of this particularly lopsided heat map. He’s patient to a fault, which means that he’s excellent on pitches outside the strike zone. He’s great when he can get his long arms extended or when he can drop his bat head on the ball. But throw him something, anything down and away but still inside the zone, and he turns into a (very imposing) pumpkin.
If you’re a regular FanGraphs reader or just a fan of the Nationals (or Padres), you’ve likely known the book on Wood since long before he actually debuted in Washington. He’s really big. He hits the ball really hard. He hits it on the ground. He whiffs a lot too. Major league pitchers knew the book as well, and they most definitely saw some earlier version of that heat map the second the Nationals called Wood up in July 2024.
I can say that for certain because even though he was just a 21-year-old rookie, 24.2% of the pitches Wood saw were located in those three blue boxes. Among players who saw at least 1,000 pitches, that was the highest rate in baseball (switching the side of the plate around for right-handers, of course). In 2025, that rate fell to 23.8% and Wood fell to third place, behind Dansby Swanson (24.5%) and Tommy Pham (24.2%). What those numbers mean is that from the moment he debuted, pitchers have known that the only way to attack Wood was to stay the hell away from his gigantic bat. Aim for the outside corner, keep it low, and hope for the best.
In a narrow sense, that strategy has been wildly successful, as those three blue boxes can attest. In 2025, 457 players saw at least 100 pitches within those boxes. Wood’s 50% swing rate ranked 376th, meaning he took way more called strikes than the average player. When he did swing, his 28.7% whiff rate was tied for 426th place, meaning that he ended up with way more swinging strikes than the average player. When Wood put the ball in play, he was more successful than the average player, because of course he was. Even though that’s the spot where he has his lowest bat speed, lowest exit velocity, and lowest launch angle, he still hits the ball so hard that it can’t help but find grass. He ran a .418 wOBACON on those pitches. But that’s not enough to mitigate all those extra strikes.
In a broader sense, that plan has its limits. Aiming for the corner against a player as patient as Wood means that when you miss, you’ve got a higher chance of missing the zone entirely, and Wood is so patient that he’ll make you pay for it. Once you’re behind, you have to hit the heart of the zone. More importantly, this is something of a desperation move. For years now, the trend across the league has been toward throwing the ball right over the middle and trusting your stuff to do the rest. The fear of grooving a pitch to Wood is driving pitchers toward an older, less successful game plan. Wood is bad at handling that pitch, but so is every hitter on earth. He’s seeing so many pitches there because against a hitter like him, all the options are suboptimal. Wood may not get to the next level as a hitter until he can find a way to cover more of the strike zone, but he’s young and he’s still learning. He may well get there. In the meantime, he’s still striking fear into the hearts of pitchers, and they’re doing their best to stay away from him.
“He has the best stuff on the staff. His pitches move all over the place.”
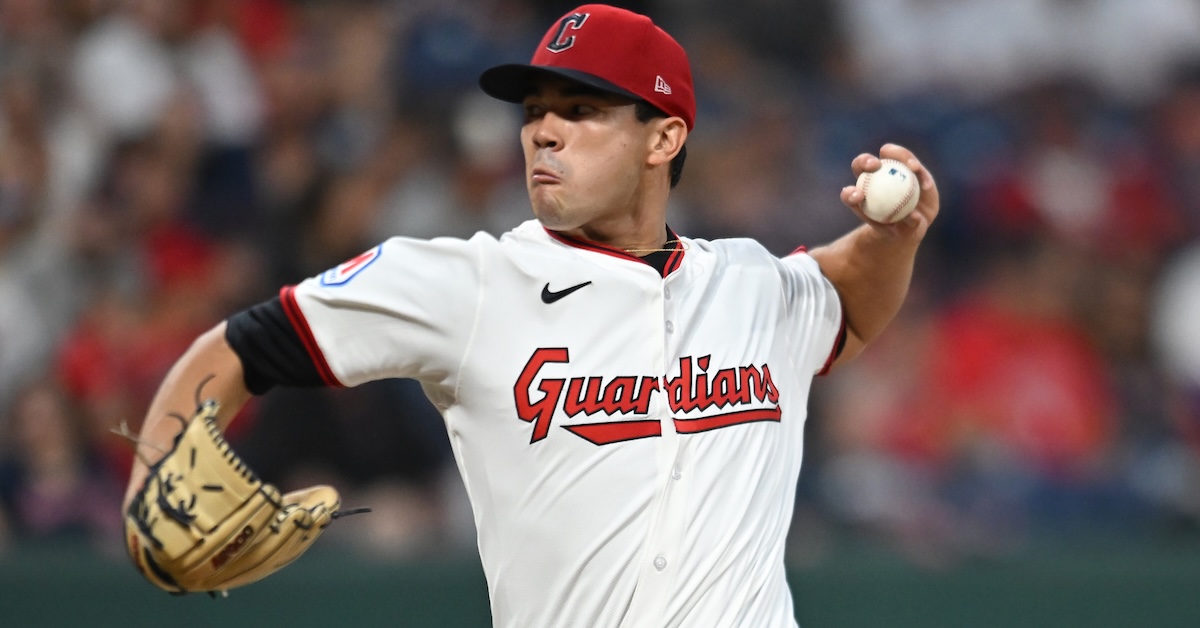
Those words, which were spoken to me in the Progressive Field press box in late September, came from someone who had not only seen the Cleveland Guardians on a regular basis throughout the season, but a person whose background also includes having played in the big leagues. His assessment of 25-year-old left-hander Joey Cantillo was based both on experience and expertise. (As we were chatting informally, I’m opting not to quote him by name.)
Cantillo’s numbers in is first full major league season suggest that he has a bright future. Initially pitching out of the bullpen, the Honolulu native moved into Cleveland’s starting rotation in early July and proceeded to log a 2.96 ERA, a 3.21 FIP, and a 25.9% strikeout rate over 13 outings comprising 67 innings. Counting his 21 appearances as a reliever, he put up 3.21 ERA, a 3.55 FIP, and a 26.9% strikeout rate over 95 1/3 frames in 2025. All told, Cantillo held opposing batters to a .217 average and a .289 wOBA.
The southpaw was originally drafted by the San Diego Padres in the 16th round of the 2017 draft out of a Kailua, Hawaii high school. (Coincidentally, two picks earlier, the Minnesota Twins took Cleveland reliever Cade Smith out of a British Columbia high school, only to have him eschew signing and attend the University of Hawaii). The Guardians subsequently acquired Cantillo in August 2020 as part of a nine-player trade that included Mike Clevinger, Austin Hedges, and Josh Naylor.
Cantillo sat down to discuss his development path and his four-pitch arsenal in the final week of the regular season.
———
David Laurila: How much have you changed since coming here from San Diego?
Joey Cantillo: “A bunch. When I first got here I wasn’t really throwing very hard. I was one of those guys where it was like, ‘Hey, if he can throw harder he could really do some good things.’ Getting here, it was, ‘Hey, let’s start to move the body faster, get the body in better positions and use it better.’
“That’s what we focused on those first couple years, and it was a struggle. When you’re out there on the mound thinking about things like body positions, it takes away from your over-the-plate focus at times. I needed to learn to balance that. Mechanics and competing are two different things.”
For the 22nd consecutive season, the ZiPS projection system is unleashing a full set of prognostications. For more information on the ZiPS projections, please consult this year’s introduction, as well as MLB’s glossary entry. The team order is selected by lot, and the next team up is the Miami Marlins.
Batters
While the Marlins were expected to need to fight hard to get out of the NL East basement in 2025, the team was surprisingly solid from midseason on, and though they never reached .500, they at least flirted with it thanks to a winning record in the second half.
A lot of the happy surprises in Miami came from the starting lineup. While a team wRC+ of 96, good for 21st in the majors, doesn’t exactly occasion a “Mission Accomplished” banner, both marks were a notable improvement on the team’s recent history. Indeed, a 96 wRC+ represents the team’s best result since 2017, that year being one of only two seasons in which the Marlins passed the century mark. While there’s no direct comparison to the team’s terrific Marcell Ozuna/Christian Yelich/Giancarlo Stanton outfield of that era, there’s actually some good young offensive talent on the team. And importantly for Miami, it’s generally inexpensive. Read the rest of this entry »
While 29 American teams sit around twiddling their thumbs, the Toronto Blue Jays continue to run up their bill on the free agent market. After spending $210 million (with deferrals) to bring Dylan Cease in on Thanksgiving Eve, Toronto has now landed one of the top international free agents: right-handed pitcher Cody Ponce, late of the Hanwha Eagles of the KBO.
Even those of you who vaguely remember Ponce from his first stint in the majors might have trouble distinguishing him from any other of the dozens of big, replacement-level relievers the Pirates have thrown out there over the past decade. On some level, Ponce’s stint in Asia is just a chapter in a Sisterhood of the Traveling Pants-type deal he’s stuck in with John Holdzkom, Nick Kingham, and Colin Holderman.
The following article is part of Jay Jaffe’s ongoing look at the candidates on the BBWAA 2026 Hall of Fame ballot. For a detailed introduction to this year’s ballot, and other candidates in the series, use the tool above; an introduction to JAWS can be found here. For a tentative schedule and a chance to fill out a Hall of Fame ballot for our crowdsourcing project, see here. All WAR figures refer to the Baseball Reference version unless otherwise indicated.
Before he turned 25 years old, Cole Hamels had already reached the pinnacle of the baseball world. At the tail end of his third major league season, the lanky lefty — listed at 6-foot-4, 205 pounds — had gone 4-0 with a 1.80 ERA during the 2008 postseason, leading the Phillies to their first championship since 1980 and winning NLCS and World Series Most Valuable Player honors along the way. Suddenly, the aura he projected — a handsome laidback surfer from San Diego — needed an upgrade. He became a celebrity, expected to dress the part and live up to outsized expectations, both of which he did with some amount of awkwardness but a fair level of success.
Hamels spent the first 9 1/2 seasons of his major league career with the Phillies, part of the nucleus that helped them climb out of the doldrums to become a powerhouse that won five straight division titles. Armed with a fastball that could reach the mid-90s, an above-average curve, and a killer changeup — inspired by watching Padres closer Trevor Hoffman in his heyday — Hamels was a master of deception thanks to his consistency in throwing those three pitches from the same release point. “It’s devastating for a hitter when all of them look like a fastball, and two of them aren’t,” pitching guru Tom House, who worked with Hamels when he was a junior in high school, toldSports Illustrated’s Ben Reiter in 2009.
Hamels’ career wasn’t without hiccups. He missed significant time due to injuries while in the minors, including both the usual arm troubles and a fracture in his pitching hand, sustained during a barroom brawl while standing up for a close friend. Although he helped the Phillies get a shot at repeating their title in 2009, his postseason was a disaster; during the World Series against the Yankees, he nearly came to blows with teammate Brett Myers. At times he was overshadowed by other members of his rotation, Cy Young winners for whom the Phillies traded in case Hamels wasn’t enough, namely Cliff Lee and Roy Halladay. For as well as he pitched, Hamels himself never came close to winning a Cy Young, and he made just four All-Star teams. Read the rest of this entry »
Devin Williams, the lights-out reliever with the M. Night Shyamalan changeup, has agreed to a three-year deal with the Mets. A two-time All-Star, Williams earned NL Rookie of the Year honors in 2020 and scored a down-ballot MVP vote as recently as 2023. Even after a disastrous 2025 season kicked his career ERA all the way up from 1.83 to 2.45, he still has a career ERA of – you guessed it – 2.45. Here’s my first piece of analysis: That’s so good, you guys! Assuming he won’t keep running a 55% strand rate from here on out, the Mets just signed up for three years of one of the best relievers in baseball; meanwhile, Williams just signed up for a quick ride from the Bronx to Flushing, but it’s important to note that the ride is always going to be longer than Google Maps predicts, because the odds of actually catching an express 7 train rather than the local are vanishingly small.
Let’s start with the terms of the deal and the credit for who reported which parts of those terms, and then we’ll take a nap and perform some more light analysis. Cool? Cool. Read the rest of this entry »