One Double Play, Examined

Wednesday night, the Marlins defeated the Brewers by a comfortable 6-2 margin. Though the game wasn’t close, it could have been slightly closer: the Marlins saved a run with a clutch sacrifice fly double play in the bottom of the sixth. That’s a standard play; every level from youth tee ball on up has catch-and-throw double plays. That doesn’t mean it wasn’t impressive. In fact, the moment-to-moment action of the play shows how impressive baseball players are even on plays we think of as de rigueur.
Here, watch it in real time:
Let’s start with the pitch: Sandy Alcantara couldn’t have done much better. He dotted the bottom of the zone with a 99 mph sinker, the perfect location to induce an inning-ending ground ball. Seriously, it’s hard to draw it up any better than this:
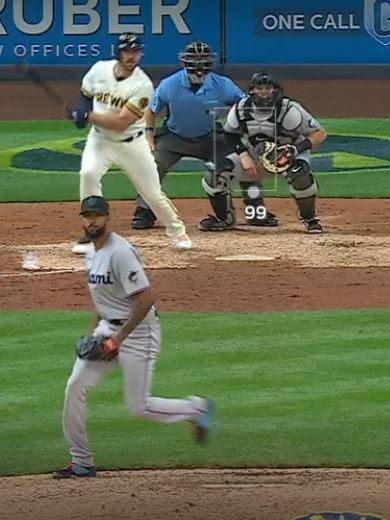
That’s a perfect location for a grounder-inducing pitch. When he’s located that pitch on the bottom edge of the zone, good things have happened: he’s saved roughly four runs relative to average per 100 sinkers he’s located there. That’s roughly in line with the best overall pitches in baseball. When he spots it, in other words, the Marlins are right where they want to be.
Travis Shaw begged to differ. Well-spotted pitch, plus velocity: he hit the smithereens out of it. The ball came off his bat at 101.7 mph, a veritable laser beam. Combined with its flat 12 degree launch angle, that ball is a hit the vast majority of the time; it carried a .910 expected batting average per Statcast, though that ignores the horizontal angle (or spray angle), and Shaw happened to hit it right at a defender. Read the rest of this entry »