I started with every defensive season in which someone played 800 innings at a position in consecutive seasons. I treated corner outfield positions as different positions here, just to keep this as clean and simple as possible. Statcast defense is still a relatively new thing, so we have only 583 two-year runs for individual players. Not enough to break it down further by age or position or component in a meaningful manner, but enough to look at the bottomline numbers. When we look at three-year runs, we drop down to 277 individual players. Thanks 2020!
Of the players who had 800 innings at the same position in three consecutive seasons, here are the 30 largest gainers from the first year to the second. I used FRV/1200 instead of raw FRV.
Nearly two-thirds of the biggest improvers had negative FRV numbers the first season, and averaged a 10.8-run improvement in the second season. While FRV is obviously a volatile number, these players successfully retained a large portion of their one-year gains in the third season, averaging a 6.4-run improvement, with only five players going back into negative territory.
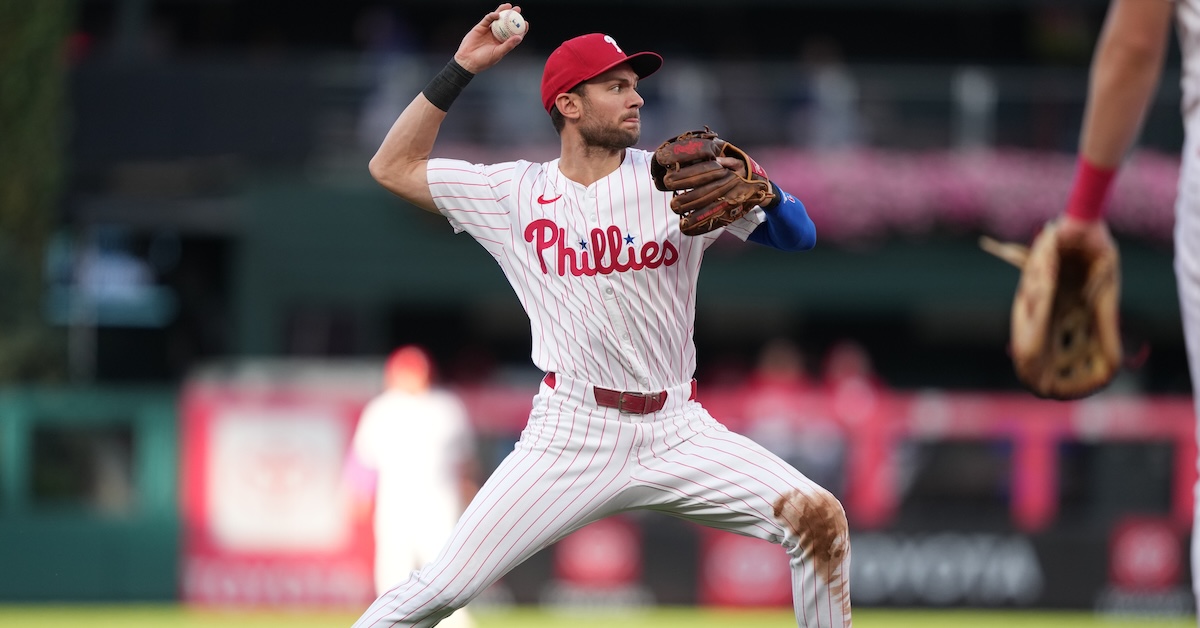
Turner’s 2024-2025 improvement in FRV/1200 is 11.7 runs, which would rank him ninth on this list, and the second-largest improvement among shortstops, behind Tim Anderson from 2017-2018. Turner doesn’t feature here because this is specifically for three-year runs, and the 2026 season hasn’t happened yet. His current Year 1-to-Year 2 gain for 2023-2024 is 4.5 runs — from -8.0 to -3.5 — and therefore not enough to make the top 30. It’s worth noting, though, that ZiPS projects him to be worth about 4.0 FRV/1200 in 2026, meaning he’d maintain about half his improvement from last year to this season.
The story here is similar. The 30 biggest decliners averaged an 11.7-run slide from Year 1 to Year 2. All but two of the 30 were initially in positive territory, and only two players (Trevor Story and Evan Longoria) rebounded to positive territory in Year 3. Compared to the change of -11.7 runs in the first two seasons, Year 3 was still at -7.9 runs below the first year. So again, the biggest declines generally still displayed significant deterioration of their defensive performances.
Despite my sample size misgivings, I also look at the stickiness by age or position. Unfortunately, the results weren’t terribly interesting; the sample sizes were simply too small to draw meaningful conclusions from this part of the exercise.
So, what does this mean? While you shouldn’t take the most recent FRV of a player as some magical this-is-their-true-ability number, large changes in performance are very meaningful going forward. That’s good news for Turner and Phillies fans.
PHILADELPHIA — Let’s get one thing clear off the top: A splitter is not a fastball. Any confusion about this topic is understandable, seeing as the full government name of the pitch is “split-finger fastball.” Don’t be a captive to the inflexibility of language. The splitter is lying to you about its very nature.
The origin story of the splitter begins in 1973, when a Cubs minor leaguer named Bruce Sutter was recovering from offseason elbow surgery and struggling to regain his fastball velocity. A pitching instructor named Fred Martin approached the sore-armed 20-year-old with a new pitch. This would be a variation on the familiar forkball, held with index and middle finger spread as far apart as possible in order to impart downward movement.
But while the forkball came out of the hand with an identifiable knuckleball action, Martin had Sutter grip the baseball ever so slightly forward, getting similar action with fastball-like spin. Read the rest of this entry »
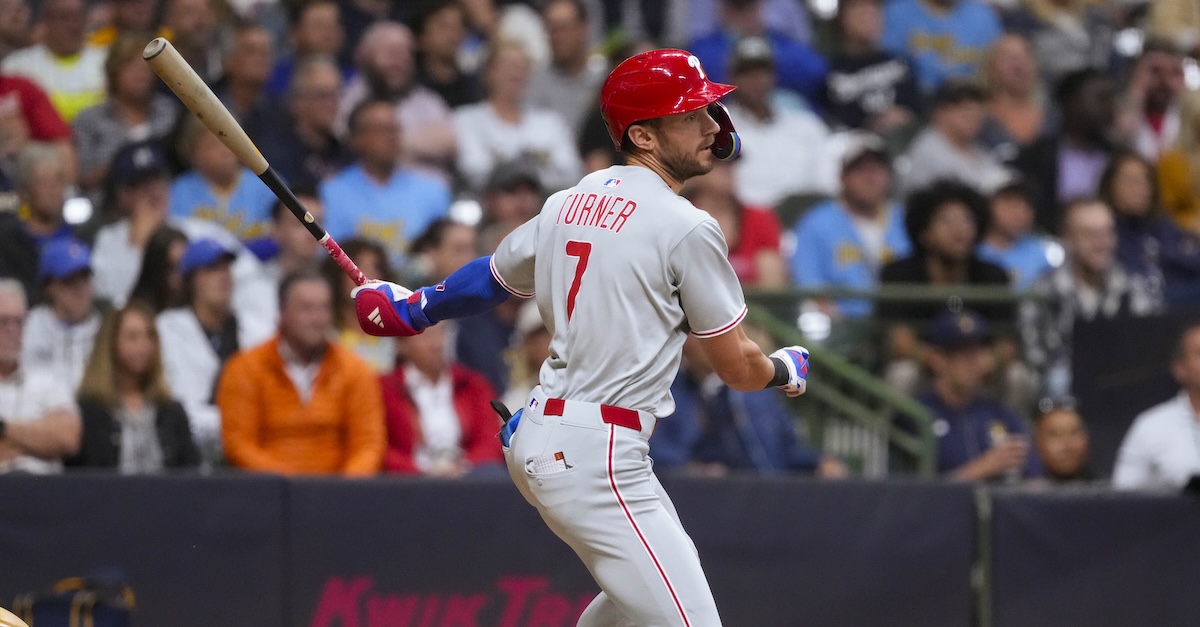
Does anybody want to win the National League batting title? Granted, with all these statheads devaluing batting average and instead offering fancier stats that identify more productive hitters, batting titles ain’t what they used to be. Nonetheless, with less than three weeks to go in the regular season, it bears noting that just one NL qualifier has a batting average of .300 or better, namely Trea Turner — and he just landed on the injured list.
The 32-year-old Turner left Sunday’s game against the Marlins in the top of the seventh inning after running to first base, where he was safe on a throwing error by shortstop Otto Lopez. He felt his right hamstring “grabbing on me,” as he described it afterwards, and was replaced by a pinch-runner. An MRI on Monday showed that he’d suffered a Grade 1 hamstring strain — thankfully not as serious as the Grade 2 left hamstring strain that knocked him out of action for six weeks last season; the Phillies think he could be back after just a 10-day IL stint. Even so, the move came on the same day that the team also placed third baseman Alec Bohm on the IL due to a cyst in his left shoulder; suddenly the Phillies are down half an infield. Luckily for them, they now own an nine-game lead in the NL East.
Thanks in large part to a 4-for-5 night on Friday, Turner is currently hitting .305/.356/.458 (125 wRC+). That’s the highest his batting average has been since June 17 (.308); he was as low as .281 as recently as August 13 but had been on fire over the past four weeks, batting .420/.448/.620 (197 wRC+) since then to overtake Will Smith (who at the time led the NL at .312), Xavier Edwards (.308), Freddie Freeman (.300) and everyone else vying for the title. Turner already has a batting title, having led the NL with a .328 mark in 2021. Read the rest of this entry »
Every morning, I go to FanGraphs and pull up a few leaderboards. One of my favorites these days shows trailing 30-day plate discipline statistics. Ever since Michael Harris II dug himself a huge hole by swinging at everything and then dug himself out of it by swinging some more, I’ve been checking to see whether he’s reined in his swing-first tendencies. Never fear, he’s still up there hacking — his swing percentage ranks 18th in the majors over the last month — but this isn’t an article about Harris. Here are the top 10 hitters in baseball by swing percentage over the last 30 days:
This generally isn’t a ranking you want to be at the top of. Ezequiel Tovar is on there because he’s never seen a slider he doesn’t like. In the aggregate, this group is hitting horribly over the last month. But there are two exceptions to that statement. Ozzie Albies is having a resurgent stretch, and as you can see from his low swinging strike rate, he’s operating pretty differently from the rest of this group. That’s neat, but Albies also isn’t the focus of today’s article. No, that would be Bryce Harper, who seems to defy everything I know about patience and power.
Sluggers wait for their pitch. I’ve known that for as long as I’ve followed baseball. I grew up on Barry Bonds’ perfect idea of the zone, A-Rod and David Ortiz taking tough pitches off the outside corner, Albert Pujols walking more often than he struck out. And this isn’t some SEAGER issue, either. That metric is about measuring controlled aggression, the ability to swing frequently without bad chases. Corey Seager’s career chase rate is 27.1%. The last time Harper showed that much restraint was 2018. How does he do it?! Read the rest of this entry »
Are you a fan of a team in playoff position? Are you tearing your hair out because their bullpen has been completely unable to get anybody out over the past couple weeks? Is this starting to get creepy? Does it feel as if I’m staring straight into your very soul? Worry not. I’m just playing the odds. Below is a table that shows bullpen performance over the last 14 days, but only for the 13 teams with at least a 12% chance of making the playoffs. I’ve highlighted the teams whose ERA ranks in the bottom half of the league over that stretch:
Bullpens Over the Last 14 Days
Team
ERA Rank
ERA
FIP Rank
FIP
Red Sox
5
3.40
7
3.37
Mariners
12
4.08
1
2.79
Dodgers
13
4.11
10
3.51
Astros
14
4.27
15
3.98
Phillies
15
4.29
14
3.88
Tigers
16
4.34
25
5.29
Rangers
17
4.46
5
3.28
Brewers
18
4.67
6
3.29
Padres
20
4.70
22
4.63
Mets
21
5.03
13
3.64
Yankees
23
5.23
2
2.93
Cubs
25
5.26
17
4.21
Blue Jays
26
5.28
19
4.29
There are the Red Sox in fifth place, looking solid with a 3.40 ERA. But, uh, this not exactly an encouraging sign for all these playoff teams. That’s a lot of yellow. Boston is the only team in the top 10; no one else has a bullpen ERA below 4.00. Only five of these teams are even in the top half of the league. The Mets, Yankees, Cubs, and Blue Jays all have ERAs over 5.00.
The Brewers are tied with the Twins for the league lead with five blown saves in the past two weeks. The Blue Jays and Phillies each have four. Just a reminder: The Brewers have the best record in baseball, and the Blue Jays and Phillies are tied for the second best. All of sudden, none of them can close out a game to save their lives.
Once again, I need to disavow any supernatural influence here. I don’t think there’s a paranormal reason that seemingly every good baseball team’s bullpen is in a rut. It’s mostly a coincidence. If we look at FIP, things are much more reasonable. Six of our 13 teams are in the top 10, and only four are in the bottom half of the league. That’s pretty much what you’d expect. Most of the good teams have strong bullpens. This is a short stretch, a small sample of innings, and a volatile cohort to start with. The Brewers’ bullpen has an excellent 3.29 FIP over the past two weeks, but it’s blown five saves anyway. Stuff happens.
I’ll break down the four teams at the bottom of the table along with a couple others I found noteworthy due to injury reasons, or because I’m worried about them heading into the playoffs, but that’s mostly what I wanted to tell you. All the bullpens seem to be blowing up right now. It’s weird. If you’re tearing your hair out because we’re in September and your bullpen can’t hold on to a lead, relax. First, there may be enough time to right the ship. Second, whoever you’re facing in the playoffs can’t hold a lead right now either, unless it’s the Red Sox (who gave up eight runs in a bullpen game last night, presumably because that’s what all the cool kids are doing).
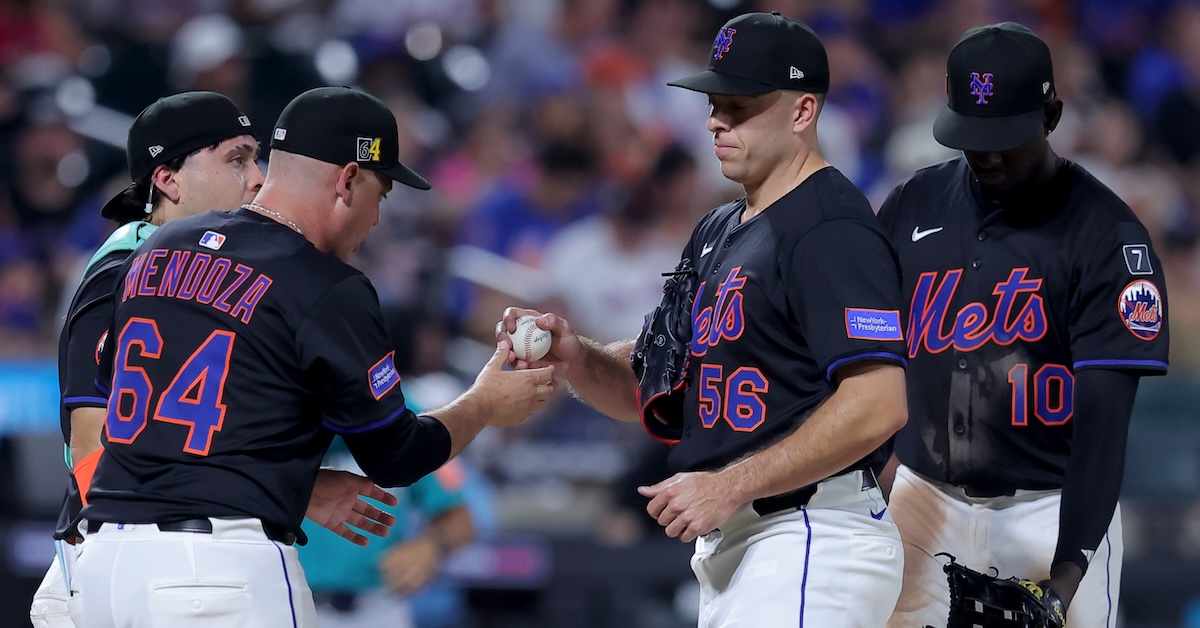
Mets
The Mets lead the league with a whopping six relievers on the IL right now: Reed Garrett, Drew Smith, Danny Young, A.J. Minter, Max Kranick, and Dedniel Núñez. Smith, Minter, Kranick, and Garrett had all been pitching well before their injuries. That’s four good relievers lost, and only Garrett has a chance to return this season. That’s how the Mets ended up claiming Wander Suero, who has thrown just 6 1/3 major league innings in the last two seasons combined, from the Braves off waivers yesterday. Suero has a 1.35 ERA and 2.63 FIP over 46 2/3 innings in Triple-A Gwinnett, and he will get the chance to prove that’s not a fluke. The Mets called him up less than half an hour ago to take the spot of the struggling Kodai Senga, who has been optioned to Syracuse.
More than that, Ryan Helsley has been completely ineffective since the deadline trade that brought him to New York from St. Louis. He had a 3.00 ERA and 3.56 FIP as a Cardinal, and he has a 11.45 ERA and 6.50 FIP as a Met. Helsley said last week that he thinks he’s been tipping pitches. With any luck, he’ll get that sorted out. If he does that and Garrett comes back pitching well, they’ll join Tyler Rogers, lefties Brooks Raley and Gregory Soto, and closer Edwin Díaz, all of whom are putting up good numbers this season. Somehow the Mets could still put together a solid bullpen going into the playoffs.
Dodgers
The Dodgers’ relievers rank third in the majors with 5.2 WAR this season, but that’s mostly because they’ve been asked to throw 570 1/3 innings, the most in baseball. At the moment, RosterResource says they’re tied with the Brewers at five injured relievers, one behind the Mets. They lost Evan Phillips to Tommy John surgery in May, deadline acquisition Brock Stewart went on the IL with shoulder inflammation almost immediately after the trade, and Alex Vesia strained an oblique on August 21. Jack Dreyer, Justin Wrobleski, and Ben Casparius are the only relievers on the team with FIPs below 3.50. Tanner Scott and Kirby Yates are load-bearing pieces who have taken major steps back and lost time to injury besides, and yet the Dodgers are still one of the higher teams on the list. After missing time with forearm tightness earlier in the season, Blake Treinen has allowed just two runs in his last 12 appearances, and his ERA is down to 3.00.
Yankees
The headliner here is the 5.60 ERA that Devin Williams has put up this season, but as Michael Baumann wrote earlier today, the underlying numbers aren’t that bad. They’re maybe even good. The Yankees lost Jake Cousins to Tommy John surgery in June and Jonathan Loáisiga to a flexor strain in August. Brent Headrick is also on the IL after taking a line drive off his pitching arm. The Yankees have also suffered blowups from Paul Blackburn and Yerry De los Santos. They pulled the plug on deadline acquisition Jake Bird almost immediately. He had a 4.73 ERA and and 3.50 FIP in Colorado before the deadline, but he got into just three games for the Yankees, allowing six runs over two innings before being optioned to Triple-A, where he has continued to struggle. Luke Weaver has been bitten by the home run bug lately, allowing four in his last seven appearances for an ERA of 5.14. However, his average exit velocity over that stretch is lower than it’s been the rest of the season, and he’s run a 2.53 xFIP. It seems more like bad luck than anything.
Fernando Cruz and David Bednar have been lights-out, Tim Hill is still a groundball machine, and Camilo Doval hasn’t allowed a run in his last five appearances. Over the entire season, the Yankees bullpen has a 3.93 xFIP, tied for second-best in baseball. Over the past two weeks, they’ve got the second-best FIP despite the hideous ERA. It’s hard to imagine them making a run without Williams and Weaver (The Deadly W’s) turning things around, but this isn’t necessarily a disastrous ‘pen either.
Cubs
By most metrics, the Cubs bullpen has been right in the middle of the pack this year. In the past two weeks, its 3.05 xFIP is the third best in baseball. So why are the ERA and FIP so ugly? That’s the danger of playing in homer-friendly Wrigley Field in August. Over that stretch, 21.1% of their fly balls have gone for home runs, second only to the Rockies (and not coincidentally, they recently spent a three-game series in Colorado). Drew Pomeranz and Taylor Rogers have put up good seasons, but have each given up a couple of homers in recent weeks, and because the Cubs have relied on their bullpen less than just about any other team over that stretch, those mistakes have been magnified. Nothing that’s happened in the past two weeks has made me change my opinion of this relief corps.
Phillies
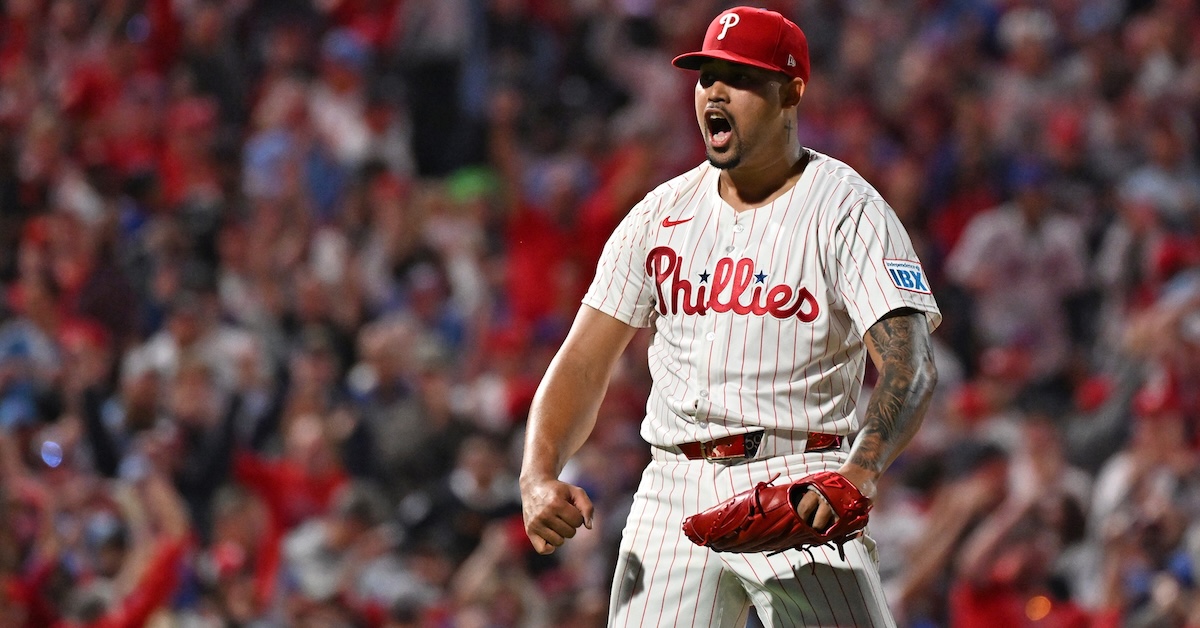
Philadelphia’s bullpen has been an issue all year long. Free agent signings Joe Ross and Jordan Romano have not worked out at all, putting up a combined -0.5 WAR over 86 appearances and 93 2/3 innings. The good news is that the bullpen looks very different now. The Phillies released Ross, and Romano hit the IL with middle finger inflammation. They signed David Robertson in free agency in July, traded for Jhoan Duran at the deadline, and got star lefty José Alvarado back from an 80-game PED suspension on August 20. Alvardo has looked very rusty since his return and won’t be available for the playoffs, but Robertson and Duran have been excellent. Together with Matt Strahm, Orion Kerkering, and Tanner Banks, the Phillies should have a serviceable, if shallow, bullpen going into October. With Zack Wheeler out and Aaron Nola struggling, the rotation may be the bigger concern.
Blue Jays
How much time do you have? The Blue Jays had the worst bullpen in baseball in 2024, and if nothing else, they looked primed to bounce back. They non-tendered Jordan Romano. They signed the excellent Jeff Hoffman, traded for Nick Sandlin, brought back Yimi García and Ryan Yarbrough, and took flyers on arms like Amir Garrett, Jacob Barnes, and Richard Lovelady. And they have bounced back. They rank in the middle of the pack in both ERA and FIP, and seventh in xFIP. Lately, though, they just can’t seem to get outs.
They released Yarbrough before the season. The fliers they took haven’t worked out, nor have in-house guys like Chad Green, Zach Pop, and Erik Swanson. They’ve lost major pieces, with both Sandlin and García out for the season. Other injuries forced Easton Lucas and Eric Lauer into starting roles, where they’ve performed significantly worse. Hoffman put up three ugly performances in the last week of August, though he’s looked much better in the past week. Although the underlying numbers aren’t bad, deadline acquisition Louis Varland has a 6.91 ERA in 15 appearances as a Blue Jay.
If Hoffman can keep things straightened out, if Varland’s luck can turn around, if Lucas and Lauer can get back in the bullpen, if the arms that got them here – Yariel Rodríguez, Brendon Little, Braydon Fisher – can keep doing what they’re doing, the Blue Jays could have a decent bullpen going into the playoffs. But that’s a lot of ifs.
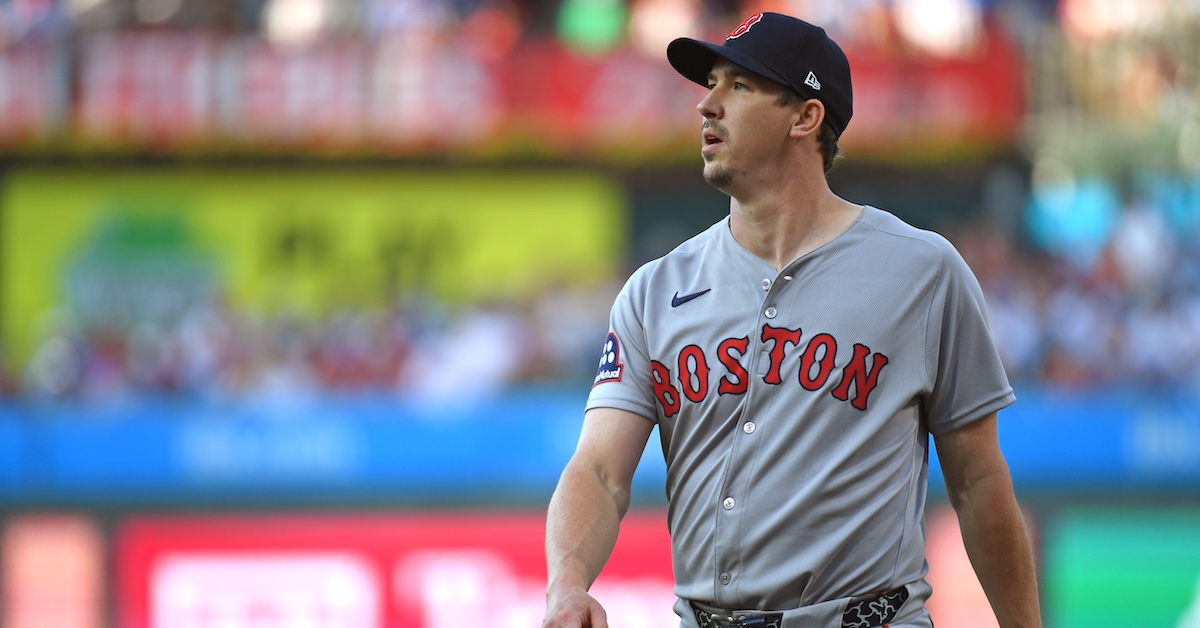
Aside from a brief run last October — one that culminated with a surprise cameo to close out last year’s World Series — Walker Buehler has scarcely resembled the pitcher who from 2019–21 made two All-Star teams and helped the Dodgers win a championship. The Red Sox took a shot at fixing him, and now the Phillies will try as well, hoping at the very least that he can provide some useful innings down the stretch and land a spot on their playoff roster.
The 31-year-old Buehler, who signed a one-year, $21.05 million deal with Boston in January, was roughed up for a 5.45 ERA and 5.89 FIP in 112.1 innings with the Red Sox, slightly higher than his marks with the Dodgers last year (5.38 ERA, 5.54 FIP in 75.1 innings) after returning from his second Tommy John surgery. He made 22 starts for the Red Sox, but his continued struggles led the team to pull him from the rotation after his August 19 start, a four-inning, four-walk, two-run outing against the Orioles. After just one relief appearance, in which he allowed two runs in 2.1 innings against the Yankees on August 24, the Red Sox released him last Friday while still owing him roughly $3.4 million.
The Red Sox — who at 77-62 are tied for the AL Wild Card lead despite weathering numerous starting pitcher injuries and disappointments — had considered replacing Buehler in the rotation with rookie Richard Fitts. But when the 25-year-old rookie landed on the injured list due to a bout of neuritis in his right arm, the team needed to add another starter, and the call-up of prospect Payton Tolle cost Buehler his spot on the 40-man roster. Read the rest of this entry »
The Mets swept the Phillies this week, which made headlines for two reasons: First, the Mets have now won 10 straight against the Phillies at Citi Field, dating back to last September, and including Games 3 and 4 of last year’s NLDS. If the Phillies don’t win a game there in the playoffs, they don’t face the Mets in New York again until the last weekend of June 2026. A potential 21-month losing streak at a divisional rival is tough to swallow, though it’s good to see that everyone’s being super normal about it.
Second, it kept the NL East race alive. The Phillies entered this division matchup seven games up with 32 to play; had they won the series, they would’ve basically had the division title in the bag. As it stands now, they’re up five, with the Mets coming to Philadelphia for a four-game set in mid-September. The Phillies are still 3-to-1 favorites, according to our playoff odds, but it’s a real pennant race now.
But this sweep is most important for a reason that went a little under the radar. While the Mets were beating seven shades of you-know-what out of the Phillies, the Dodgers were doing the same to the Reds in Los Angeles. Read the rest of this entry »
“You told me to flump off,” said umpire Derek Thomas. He pulled home plate duty for Monday’s game between the Cardinals and the Pirates, and it turned out to be a tough assignment. In the bottom of the seventh, Thomas rang up designated hitter Willson Contreras on a called strike three. He didn’t like what he heard as Contreras walked back to the dugout, so he ran him too. The flabbergasted Contreras asked why he’d been ejected, then raced back toward home plate and asked Thomas to repeat himself. The debate that ensued was short but spirited, and packed with dazzling rhetorical flourishes.
“You told me to flump off,” Thomas said again before turning to manager Oliver Marmol. “He told me to flump off.”
“No,” said Contreras. “I did not. I did not.”
“Yes, you did.”
“I did not.”
“Yes, you did.”
Diplomatic relations finally reached their breaking point. Contreras decided that if he was going to be punished for telling Thomas to flump off, he might as well get his money’s worth. He told him to flump off with gusto. “How is that?” he shouted. He repeated himself again and again, exploring various intonations while ratcheting up the intensity to make sure the message sank in fully. It was a powerhouse performance. Inspired, Marmol told Thomas where to flump as well. At that point, a less resolute individual probably would’ve just flumped off.
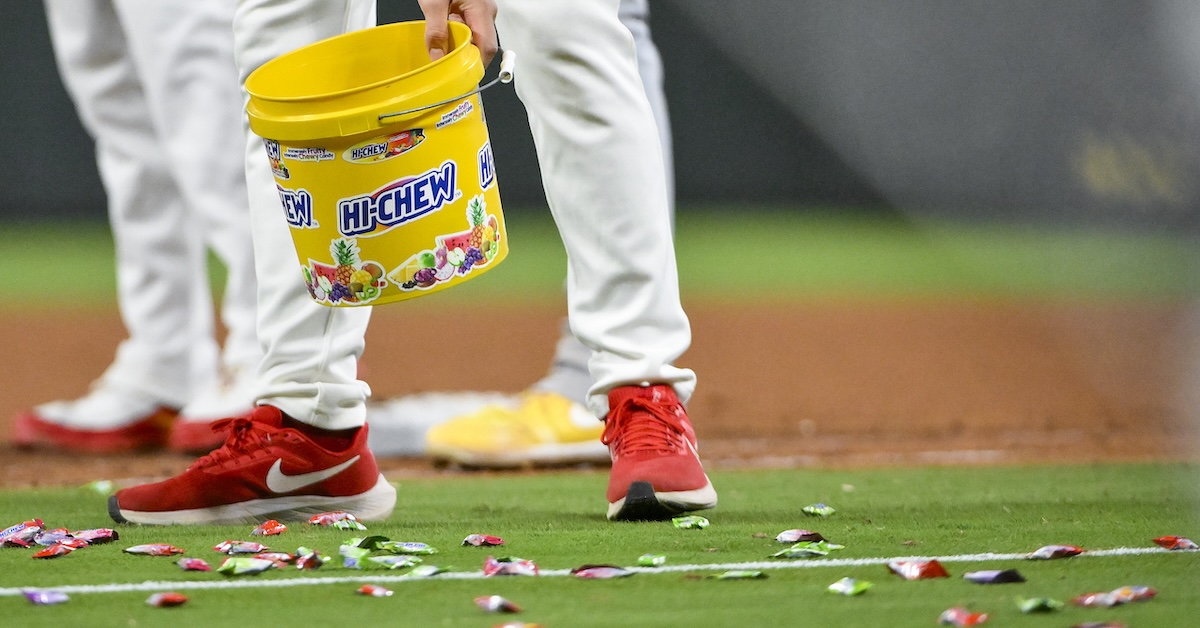
Contreras threw his helmet, then his bat, which ended up hitting a coach. The pièce de résistance came in the form of a large pail of Hi-Chew, which Contreras retrieved from the dugout and tossed onto the field:
Watching all this, I couldn’t help but be amazed. They have Hi-Chew in the dugout! Did you know they have Hi-Chew in the dugout? I watch a fair amount of baseball, and I definitely did not. For the uninitiated, Hi-Chew is Japanese candy that comes in a wide variety of fruit flavors. I love Hi-Chew. Everyone loves Hi-Chew. But it’s candy. It’s not bubble gum, which has storied history in baseball and may even improve athletic performance. And it’s not sunflower seeds, which have their own storied history, not to mention protein and electrolytes that confer their own plausible nutritional benefits. It’s just regular candy.
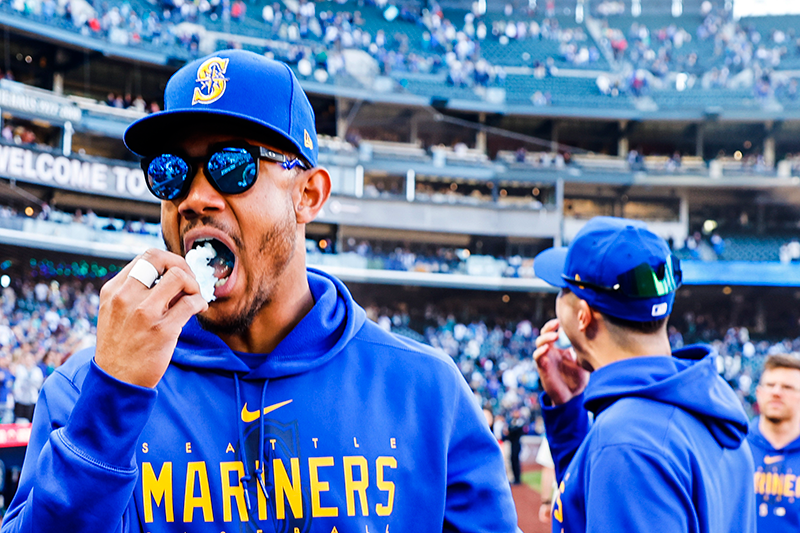
Every year or two, we get a few articles oohing and aahing at the state of nutrition for professional athletes. I will confess that I eat these articles up. I love them all. A catalog of the new, healthy snacks in the dugout? Don’t mind if I do. A deep-dive into the NBA’s love affair with peanut butter and jelly sandwiches? I’ll take a dozen. Puff pieces about the Marlins nutrition team, the Angels dietitian, the Twins dietitians, a minor league dietitian, or the Mets kitchen staff? Keep ‘em coming. Every one of these articles makes me want to be a major leaguer, starting my day with a protein shake designed to suit my exact metabolic needs, drinking tart cherry juice to aid my recovery, and eating healthy meals that are also delicious because they’re designed and prepared by world-class professionals. I’d also get to enjoy the odd bit of cotton candy:
Joe Nicholson-Imagn Images
That part’s actually important. All of the cooks, dietitians and nutritionists interviewed in these articles go out of their way to acknowledge that they’re fine with the occasional treat. They don’t want to be the junk food police, and athletes burn through so much energy between practice, warmups, workouts, and the actual games that they have absurdly high caloric needs anyway. (Left unsaid in most of these articles is the fact that these are hyper-athletic 20-somethings who could probably subsist on a diet of Cocoa Puffs anyway, even if it wouldn’t necessarily optimize performance.) Instead, they detail the many ways they’ve replaced junk with healthy options. Energy comes from sources like fruit, nuts, string cheese, and jerky. Cookies are out; Honey Stinger stroopwafels are in. Nutri-Grain bars, which are essentially a prayer to the god of Type 2 Diabetes, have been replaced by Rx Bars. And so on. With so many lesser evils available, players can indulge without wrecking their carefully-calibrated dietary regimens.
All of this makes sense. None of it is compatible with the big, surprisingly aerodynamic tub of Hi-Chew in the St. Louis dugout. There’s no decades-long history here. Hi-Chew is just a big cube of glucose. I’m going to pull a few quotes from the articles I linked to above, but I’ve doctored them just a little bit. It’s subtle, but see if you can tell what I changed.
“Everything in our clubhouse is geared toward helping promote recovery and reduce inflammation. We try to stick to snacks and foods with good nutrition. That’s why we provide Hi-Chew, which is 61% sugar and 10% fat. What’s the other 29%? I shudder to think.”
…
“How do we get the right energy in them in order to optimize their performance during the game? Also, how do we dispose of this giant tub of Hi-Chew my uncle gave me for my birthday?”
…
“Obviously, not feeding your body with the right stuff is not going to be able to help you maintain your body and your energy levels throughout the whole year, because it’s a long year. Except for Hi-Chew. Hi-Chew is fine.”
This article is not about how Hi-Chew got in the dugout. That article has already been written more than once. The story goes that as the least-tenured reliever on the Red Sox in 2012, Japanese-born Junichi Tazawa was in charge of keeping the bullpen stocked with gum. He added his own supply of Hi-Chew, which proved so popular that he couldn’t find enough to keep up with clubhouse demand. He asked the manufacturer if he could buy in bulk. Instead, the manufacturer sent it for free, then started sponsoring teams. There are big tubs of Hi-Chew in dugouts around the league because the players like it, but mostly because Hi-Chew pays for that privilege. I imagine they’re preparing to send Contreras the world’s sweetest care package in exchange for all the free publicity.
No, this article is my attempt to find out what’s actually being eaten in major league dugouts. Hi-Chew can’t be the only transgressor that somehow failed to come up in the dozens of empty-calorie articles about big league nutrition that I’ve consumed over the years. Here I should confess that this is a subject near to my heart. I was a ravenous child. I ate seeds and chewed gum during baseball games when I was younger. By middle school, I was loading boxfuls of Pop-Tarts and Fruit by the Foot in my bag at the beginning of each week. My spikes would inevitably crush the Pop-Tarts and shred their thin foil wrappers. By the end of the season, my bag would be covered in a fine, inch-deep mélange of dirt, pastry crumbs, and brown sugar filling. It smelled heavenly.
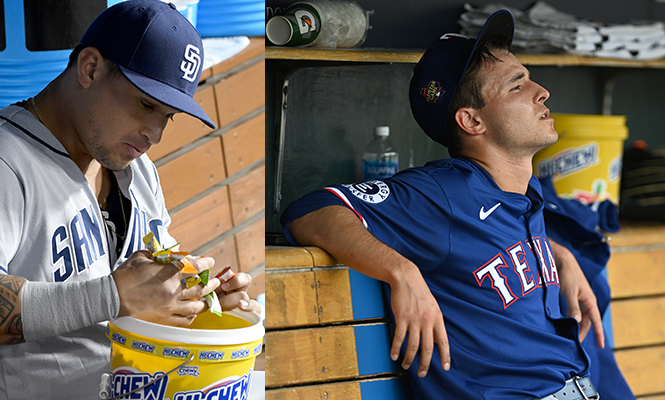
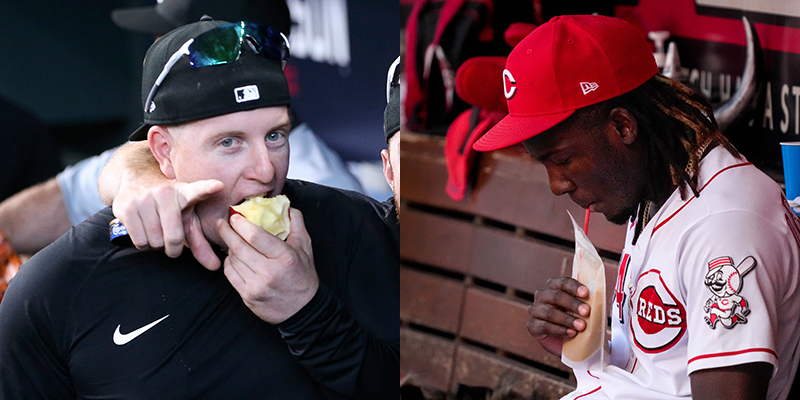
I used a brute force research methodology, hunting for sweets through thousands of photo service pictures of dugouts, bullpens, Dubble Bubble celebrations, and Gatorade baths. The hit rate was infinitesimal. Unless they’re taking a few establishing shots of gum and sunflower seeds during spring training, there’s no reason for photographers to waste their time on the snacks in the dugout. The pictures I found were usually candids, players who happened to be photographed holding a bag of seeds, dumping snacks on the player who just hit a walk-off, resting in front of the Hi-Chew tub, or digging through it looking for a very specific flavor. Behold:
Jayne Kamin-Oncea, Lon Horwedel-Imagn Images
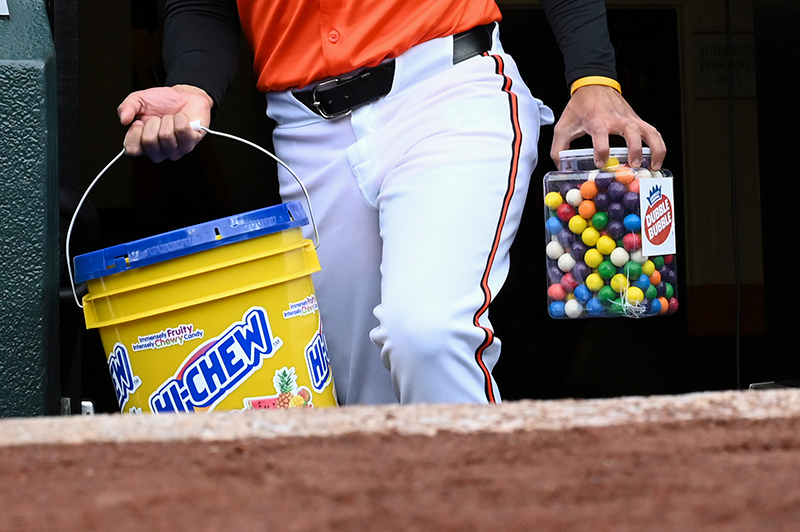
I found enough pictures of Dubble Bubble and sunflower seeds to make your head spin, though that big pail of Dubble Bubble in the dugout has changed with the times too. The next time you see a player hit a walk-off homer and receive a Dubble Bubble shower, keep an eye on the individual pieces of gum. If they’re wrapped in paper with the ends twisted, that’s regular gum, but if it’s in a plastic wrapper, that’s the sugar-free version. The Orioles also stock Dubble Bubble gumballs, along with the largest bucket of Hi-Chew in the entire league. Contreras would’ve thrown out his back trying to toss this monster:
Tommy Gilligan-Imagn Images
It’s hard to account for the ubiquity of Dubble Bubble. It’s not the official gum of Major League Baseball. So far as I can tell, Bubble Yum is the only gum that has ever borne that distinction, taking the mantle in 1998 and presumably setting it back down again at some point in the past couple decades. And it can’t be because Dubble Bubble is a pleasure to chew. If you’ll allow me to editorialize for a moment, Dubble Bubble is trash. It tastes sugary and delicious for approximately two and a half seconds, and then it turns into a tough, bitter lump in your mouth. It’s as poorly suited for blowing bubbles as it is for human consumption. (According to a 2017 Mercury News article by Andrew Baggerly, the trick to creating a wad that produces impressive bubbles is to mix the regular and sugar free versions.)
Matt Kartozian-Imagn Images
I saw more pictures of sunflower seeds than any other dugout snack. However, I was surprised not to see any David brand seeds. David was once the official sunflower seed of MLB. It provided seeds to teams for many years, and it also seemed to be the only game in town. No longer. The brand Giants is now ubiquitous. Apparently, Giants became the official sunflower seed of the Twins in 2004, and visiting players were so taken with them that other teams started ordering them too. Giants took the league by storm, but amazingly, it would take another 11 years before it became the official sunflower seed of the San Francisco Giants. According to a 2019 article, Giants ships two or three pallets of seeds to every major league stadium each year. Why were visiting players so into Giants sunflower seeds? Because they are actually giant. They’re bigger than normal sunflower seeds, and apparently that’s a desirable trait. It also provides the delightfully rare case of a giant David taking down a goliath named David.
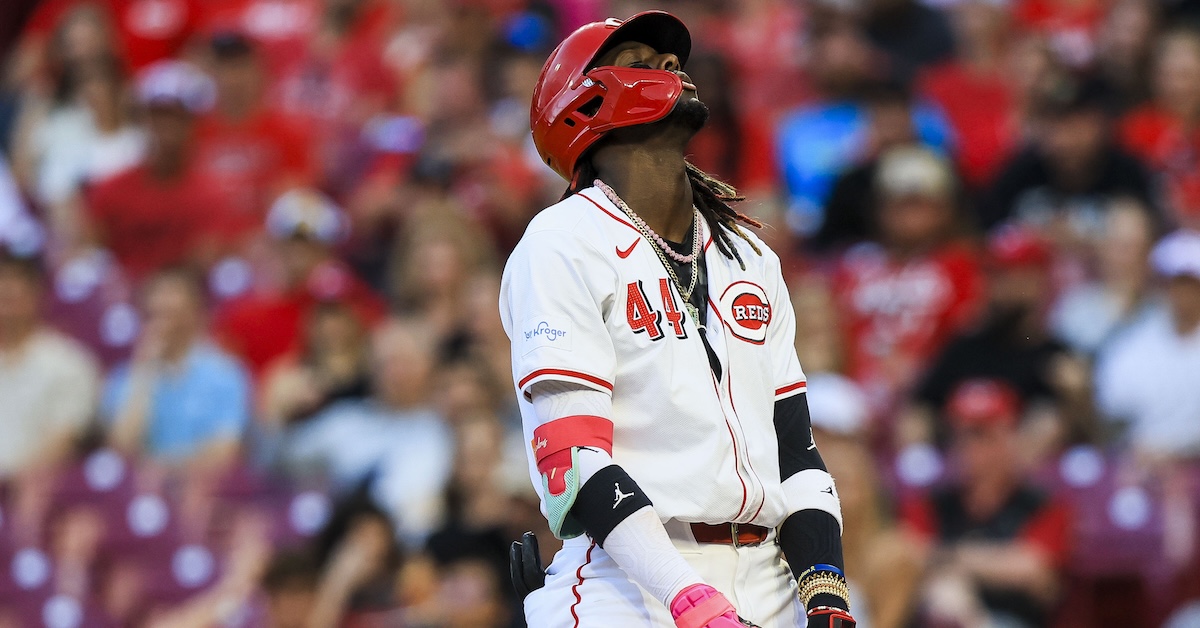
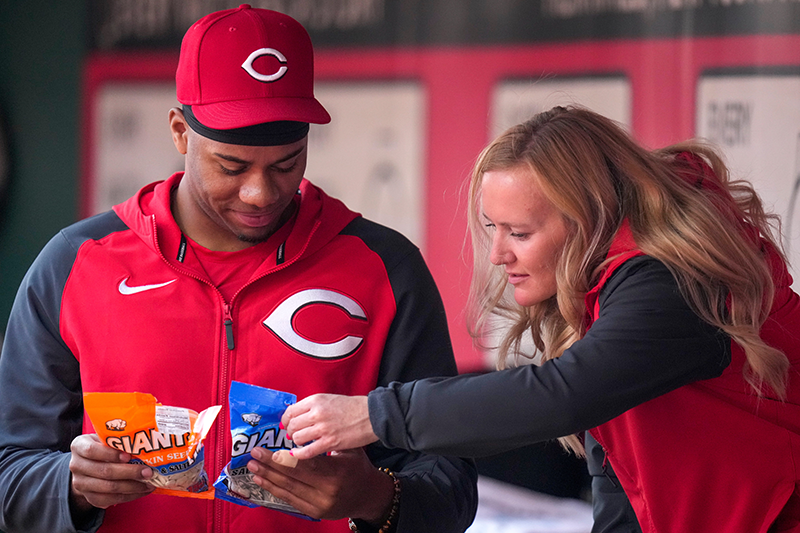
Here’s Hunter Greene comparing two bags of seeds. In his right hand are roasted and salted pumpkin seeds. In his left are salt and pepper sunflower seeds with grilled steak seasoning:
Sam Greene/The Enquirer / USA TODAY NETWORK
What makes this picture fun is that Greene is very clearly comparing the nutrition facts on the back of the bags, and he’s doing so with the help of Ashley Meuser, Cincinnati’s director of major league nutrition. I imagine if you grabbed someone off the street in 1970 and asked them what a major league nutrition director does, this is exactly what they’d picture.
I did find plenty of pictures of honest-to-goodness healthy snacks. We’ve got an apple and a smoothie in an adorable little smoothie pouch:
Troy Taormina-Imagn Images, Sam Greene/The Enquirer / USA TODAY NETWORK
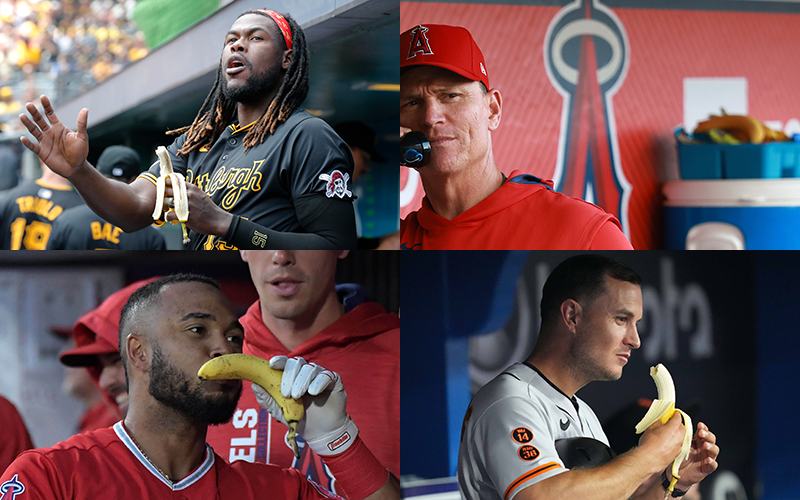
And we’ve got bananas. We’ve got lots of bananas. Oneil Cruz’s giant hand absolutely dwarfs this banana, but he nonetheless looks as if he’s about to launch into a soliloquy about its virtues as snack:
Clockwise from top left: Charles LeClaire, Kiyoshi Mio, Kirby Lee, Nick Turchiaro-Imagn Images
What could be more wholesome than that? And just look how happy Adam Engel is to be eating this banana. Surely that’s not the facial expression of a man who wishes it were still acceptable for a professional ballplayer to crush a hoagie between innings:
Thomas Shea-Imagn Images
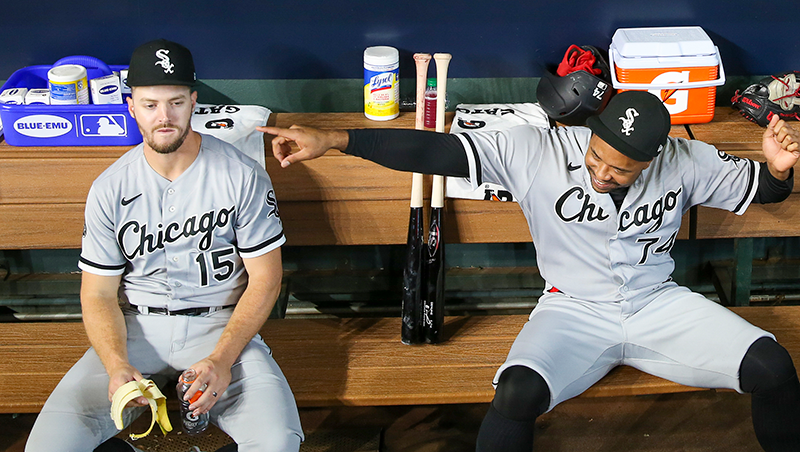
I also found some pictures of those healthy-ish stroopwafels, but that’s where the health foods stopped. Here’s Alec Marsh eating a salted caramel Honey Stinger stroopwafel (Honey Stinger calls them “energy waffles”) between innings during a game last May. But take a look at what’s in the bin in the foreground:
Kiyoshi Mio-Imagn Images
There’s a blue bag of seeds of course, but does that yellow package behind it look at all familiar? I am genuinely embarrassed to say that I instantly recognized what it was. That might not say anything good about me. Computer, enhance!
Kiyoshi Mio-Imagn Images
That’s right. That is a family size bag of Sour Patch Kids. Despite their atrocious taste in gum, major leaguers really know their gummy candies. Also, your eyes are not deceiving you. The back of the package really does encourage you to bake cookies with Sour Patch Kids in them. Even contemplating such a revolting concoction is an affront to the senses, and despite what the package shouts in all caps, it absolutely is not a thing.
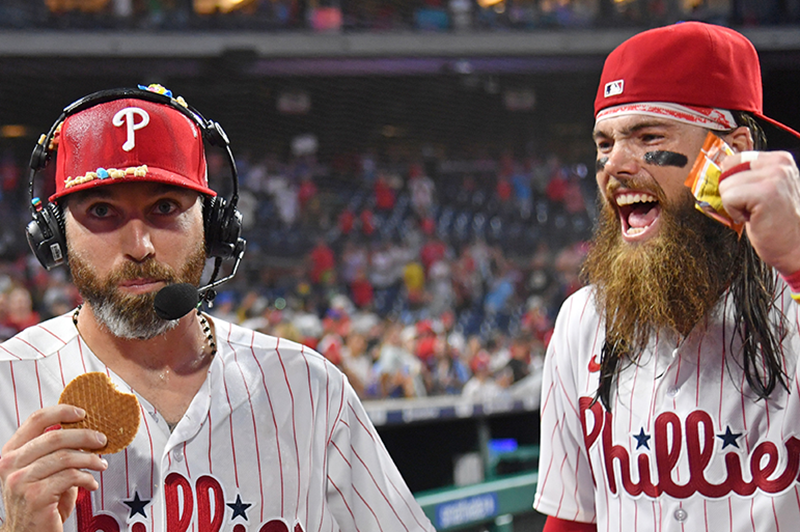
Our last batch of pictures comes courtesy of the 2023 Phillies, which shouldn’t be all that surprising, as they were one of the loudest, most fun teams in recent memory. Here’s Jake Cave chowing down on another salted caramel stroopwafel at the urging of Brandon Marsh. While his teammates gave postgame interviews, Marsh made a habit of being the one to dump alarming combinations of foods and beverages on them. He would then pressure them into eating an often-soggy snack, all while the interview was still going on. It was usually easier to give in and eat the thing than to fend off Marsh while on live television:
Eric Hartline-Imagn Images
During Cave’s interview, Alec Bohm heaved handfuls of sunflower seeds at him from the dugout. Someone else lobbed a steady stream of Dubble Bubble at his head. Marsh and Bryson Stott crept behind Cave holding two paper cups each. Marsh held the stroopwafel between his teeth. After he and Sott emptied their cups, and Bohm chipped in a perfectly timed long-distance pumpkin seed strike, he ripped the wrapper open. “Here’s a Honey Stinger,” he said, proffering it to Cave. “You have to eat it.” This picture was taken the moment Cave took a bite, and you can see how happy it made Marsh. But what I really want you to notice Cave’s hat. Marsh dumped water, while Stott dumped solids. You can see the inescapable Dubble Bubble, but I also spy a rainbow, a blue moon, a red ballon, and a green clover. The Phillies have Lucky Charms in the clubhouse! And that’s not all.
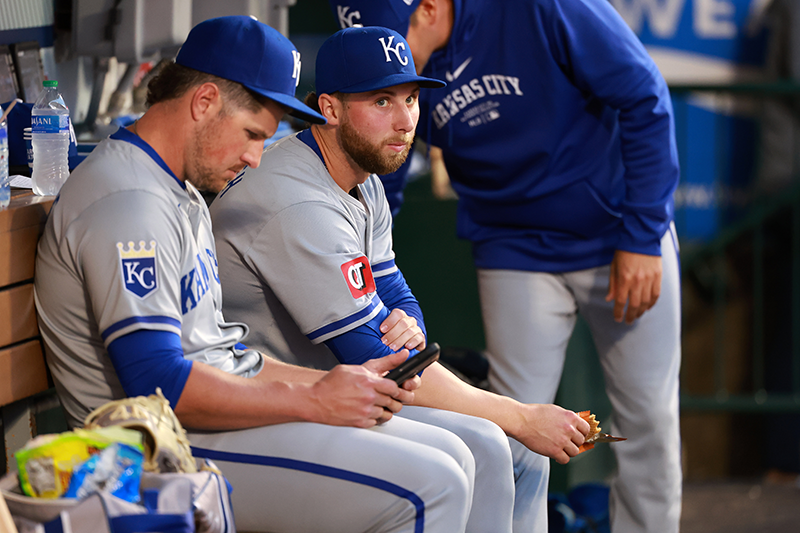
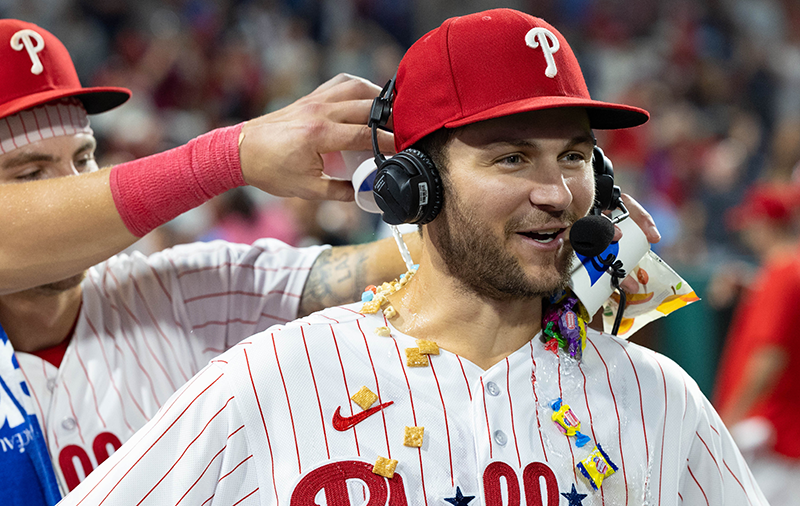
Here’s Trea Turner 10 days later, on the receiving end of gum, water, dried mango from Whole Foods, Lucky Charms, and Cinnamon Toast Crunch:
Bill Streicher-Imagn Images
As someone who has literally recorded an entire album about the monster cereals, I was genuinely taken aback by this picture. There is a big gap between having some candy available in the dugout and stocking multiple sugar cereals in the clubhouse. Candy can be an occasional indulgence. Having both Lucky Charms and Cinnamon Toast Crunch on hand is something else entirely. I have no idea whether the Phillies are a little laxer in the kitchen or whether they’re the only team whose sugar cereal habit we know about because they’re the only ones raiding the pantry every time they celebrate a win. Either way, it’s possible that big league clubhouses aren’t exactly the high-performance cathedrals that they’re made out to be.
I never would not have expected Cinnamon Toast Crunch to be anywhere near a major league baseball team. It’s genuinely hard to think of something that could be worse for a human body. Even as a child, you felt like you were getting away with something when you had Cinnamon Toast Crunch for breakfast. Or at least you felt that way until 10:30 AM rolled around and the sugar crash kicked in. It doesn’t stop at Lucky Charms and Cinnamon Toast Crunch, either. After a victory a few weeks later, Marsh and Stott dumped a cooler of Gatorade on Turner, then Stott handed him a stick of beef jerky.
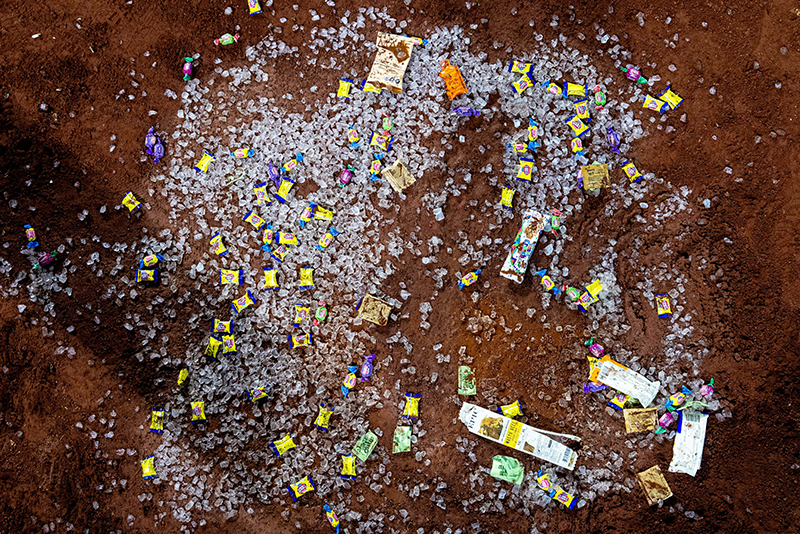
After the celebration ended, photographer Bill Streicher had the presence of mind to capture a shot of the unholy accumulation of makeshift confetti that had rained down on Turner and settled into the dirt like a pop art depiction of the night sky:
Bill Streicher-Imagn Images
You can see crushed ice, various Dubble Bubble flavors, the wagyu wrapper, and a packet of energy gel. You can see cookies-and-cream flavored Made Good granola minis, a classic example of the replace-something-terrible-with-something-not-so-bad approach. But you can also see a Cinnamon Toast Crunch breakfast bar. I didn’t even know such a thing existed, but allow me to say the most damning thing I possibly can about it: This is the kind of thing I would’ve put in my baseball bag as a high schooler. It’s basically a brick of loose Cinnamon Toast Crunch squares that have been glued together with sugar. There’s nothing less healthy that it could have possibly replaced, except maybe an actual brick, but apparently it’s part of a complete breakfast over in Philadelphia.
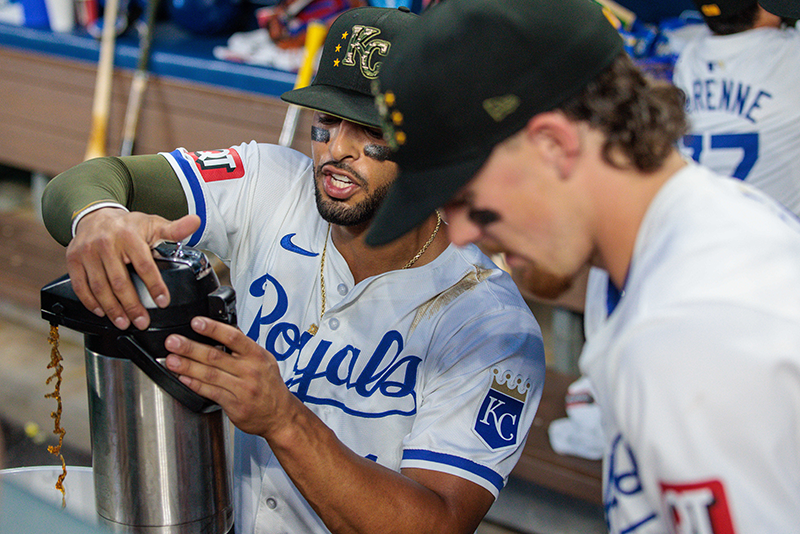
You might also notice some green and brown rectangles in that picture. Those are sugar and stevia packets, the kind you’d put in your coffee. Unsurprisingly, the people who get the most joy out of dumping comestibles on their teammates also get a lot of joy out of making whatever they’re dumping both as eclectic and as gross as possible. Here’s MJ Melendez emptying an entire coffee urn into a cooler of Powerade that will soon unleash its repulsive contents on the Royal unfortunate enough to have been the star of the game:
William Purnell-Imagn Images
I still love those those puff pieces about the nutritional advances in the big leagues. I will always love them, and I genuinely believe that the nutritionists, dietitians, and chefs involved do great work. They have dragged the game past the days of between-innings hot dogs. I’m just as certain that the vast majority of players put a huge amount of thought into how they fuel themselves. Still, it’s nice to know that in addition to all the healthier options, you can also walk into a clubhouse and get your fill of the very worst the culinary-industrial complex has to offer. Besides, it could be worse. They could start feeding the players Sour Patch Kids cookies.
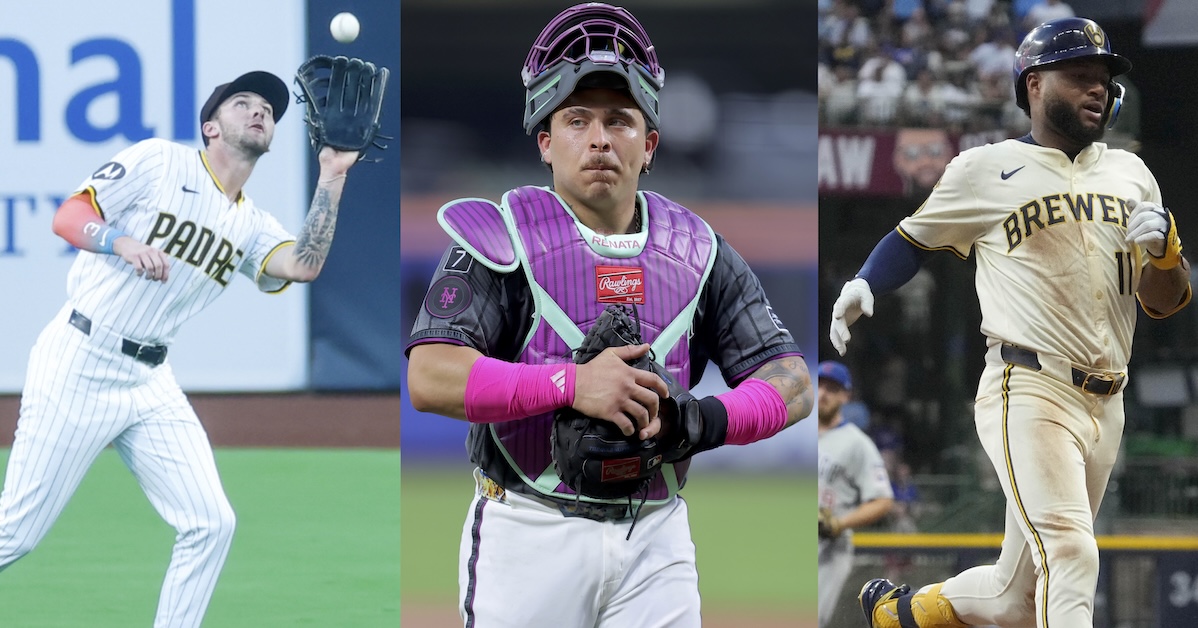
David Frerker, Brad Penner, and Michael McLoone – Imagn Images
It’s been a rough season for Francisco Alvarez — and specifically his hands. The 23-year-old catcher fractured a hamate in his left hand while taking batting practice on March 8, and after undergoing surgery, missed the first four weeks of the regular season. He scuffled upon returning, to the point that the Mets optioned him to Triple-A Syracuse in late June, but particularly since returning in late July, he hit well until he sprained the ulnar collateral ligament of his right thumb (as opposed to the UCL of his elbow) while making a headfirst slide on August 17. The injury, which requires surgery to fix, appeared to be season-ending, but to the Mets’ surprise, Alvarez has been able to swing the bat without pain, so he began a rehab assignment with Triple-A Syracuse on Wednesday. Unfortunately, in his third plate appearance of the game, he was hit on the left pinkie by an 89-mph sinker and had to leave the game.
Alvarez, who also missed seven weeks last year due to surgery to repair a torn UCL in his left thumb, was sent for testing after being removed. At this writing, the Mets have yet to reveal his prognosis, but this may set back his return, and he’ll still need another surgery this offseason. When available, he’s been one of the Mets’ more productive hitters, a big step up from the team’s other catchers on the offensive side. In 56 games, he’s hit for a career high 125 wRC+ (.265/.349/.438) with seven homers in 209 plate appearances, good for 1.4 WAR. Luis Torrens, who hit well while serving as the team’s regular catcher during Alvarez’s early-season absence, has slumped to the point that he’s batting .218/.282/.320 (73 wRC+) in 245 PA, and third-stringer Hayden Senger has been even less productive, hitting .180/.227/.197 (22 wRC+) in 67 PA.
[Update: On Thursday afternoon, Alvarez revealed that his pinkie is fractured. He said he hopes to play again this season, but a timeline for that has yet to be determined.]
The Mets, who are now 72-61, just swept a three-game series against the Phillies (76-57) at Citi Field to pull within four games of the NL East leaders. They’ve won eight of their last 11 games after losing 14 of 16 from July 28 to August 15, a skid that bumped them down to third in the NL Wild Card race, though they now have a 4 1/2-game cushion over the Reds (68-66). They’ve got some other injuries that could affect their drive for a playoff spot, but in that, they’re not alone. What follows here is a roundup of fairly recent injuries among NL contenders, some that slipped through the cracks in our coverage during recent weeks and others that merit mention so long as we’re on the topic; an alarming number of these involve fingers. I’ll go division-by-division, and follow this with a similar AL roundup. Read the rest of this entry »
Welcome to another edition of Five Things I Liked (Or Didn’t Like) This Week. August is a month I like to use for rest and recovery. After the chaos of July, there’s a natural lull in the season before the drama of September. Both deadline buyers and sellers are figuring out their new rosters and allocating playing time to new arrivals and minor league call-ups. No race is down to the wire, and yet many races are already decided. That’s a great time to relax – and what I like to do to relax is watch baseball. This week’s set of five things doesn’t have a lot of pivotal plays or playoff squads on the brink. It doesn’t have walk-offs or game-ending defensive plays. It’s just guys doing cool things, and sometimes that’s the best part of baseball. So with a quick programming note – Five Things is off next week while I go to the US Open – and a nod to Zach Lowe of The Ringer, let’s get started.
1. Ultimate Reversals
In an 0-2 count in his first start off the IL, Hunter Greene lost control of a fastball:
Hey, it happens. It was an 0-2 count, so no big deal, get ‘em next pitch. Only, wait, something was going on:
Hit… by pitch? I’m not sure anyone at the plate was sure what happened. J.T. Realmuto said something to umpire Carlos Torres. Torres thought about it and then eventually awarded Realmuto first base. Tyler Stephenson went full John Travolta behind home plate, looking around in vain for someone to make this make sense to him.
How did Reds manager Terry Francona feel about this? The same way I did, and the same way you do right now, presumably:
When the first slow-motion replay came in, everything started to make a little more sense:
Realmuto wasn’t hit by the pitch; his bat was. It’s an easy overturn. Why didn’t anyone notice? Well, Stephenson had his eyes closed and his glove blocked Torres’ view of the butt of Realmuto’s bat. No one noticed the deflection right away either; after all, Stephenson stuck up his glove trying to catch it and the ball landed in the mitt.
The replay review was short and conclusive. The call on the field was overturned; instead of a hit-by-pitch, it was a foul ball. Only, that’s not quite right – there were two strikes. The ball landed in Stephenson’s mitt after making contact with the bat. That’s a textbook foul tip strikeout. Instead of strolling to first base, Realmuto trudged back to the dugout.
There have only been five other HBP-to-strikeout overturns in the replay review era. I watched video of all of them. The one this week was the strangest. Here’s AJ Pollock getting “hit” by Tyler Chatwood in the first one I found:
See the umpire’s quick and decisive reaction? That’s normal. Call a dead ball, determine what happened, point to first to signal a hit-by-pitch – it’s standard operating procedure. Torres didn’t even call a dead ball, because he didn’t realize he needed to.
In fact, I think Realmuto might have inadvertently done this to himself. It’s feasible that if he didn’t say anything to Torres, that would have just been a ball. No one saw the ball deflect off the bat in real time, and it was such a glancing blow that no one seemed to hear it. You can tell because of their reactions; Torres doesn’t call the ball dead right away and Stephenson definitely has no idea what’s going on. Also? Change this rule! That has to be one of the hardest-luck strikeouts of all time.
2. Coordination Jung Hoo Lee’s second year in San Francisco has gone much better than his first. He’s healthy, for one thing: After an injury limited him to just 158 plate appearances in 2024, he’s been active for the entire season and has already crested 500 plate appearances this year. He’s improved across the board offensively, flashing gap-to-gap power and consistently working counts and avoiding strikeouts. It’s been more of a struggle defensively, where he’s been somewhere between blah (per OAA) and quite poor (per DRS and Baseball Prospectus’ DRP). It’s tough having your fielding compared to the ridiculous monsters who roam center these days. But how many of them can do this?
What’s that, you say? That was a standard play, catch probability 99%? The wind looked a little swirly, which made it slightly more difficult, but you’re not wrong. Lee took a meandering route to the ball and still had time to flatten his route and more or less come to a complete stop to judge the wind; he probably could have caught it standing up if he’d gotten a better read initially. That’s all true! But wait for the reveal:
It’s like a magic trick, pulling a coin out from behind a kindergartener’s ear only in baseball form. Oh, you’d expect the ball to be in my glove? No, of course it’s somewhere else. See, the ball actually kicked out of Lee’s glove, but he made a spectacular instinctual adjustment:
Lee’s right leg made that entire play. He lunged and missed with his hand, the normal thing you’d use to catch a baseball. For most players, that would be the end of the play. But Lee somehow flipped his hips to get in position, drove his right knee past the ball without bumping it away, and then pincered it into the hollow between his knees to protect it from falling to the ground.
Don’t try this at home. I say that out of personal experience – my dog looked at me funny for about five minutes while I tried to replicate it on my living room floor. There’s no practicing or teaching this. No one works on it in spring training. For nearly every outfielder in baseball, the play would have been over after it kicked out of their glove. Lee might be a below-average outfielder when you take the sum of his defensive contributions into consideration. His coordination and ability to make last-minute adjustments, though? It’s certifiably excellent.
3. Necessity Ryan O’Hearn doesn’t face lefties. In his entire Orioles career – 1,223 plate appearances – he faced only 137 lefties. It’s no secret why: He posted an 89 wRC+ against them, as compared to a 126 wRC+ against righties. That’s a huge platoon split, more than double the major league average for lefties. The O’s had a surfeit of righty platoon options, and even this year, when O’Hearn put up his best season yet, they generally didn’t let him face lefties, and he hit poorly against them when he did get the chance.
In theory, the Padres are similarly capable of sheltering O’Hearn. They’ve only given him six plate appearances against lefties, and they’ve pretty much all been out of necessity rather than desire. Your bench isn’t always as full as you’d like, the other team can sneak in lefty relievers at almost any time late in the game, and no hitter avoids facing lefties altogether. In fact, the Padres have given him those opportunities at about the same rate as the O’s. But let’s just say he’s not hitting southpaws quite so poorly with San Diego:
That’s 4-5 with a walk, and all four hits have gone for extra bases. It’s far too small of a sample to make substantive conclusions, of course, but O’Hearn has already socked as many homers against lefties in a Padres uniform as he did in Baltimore, where he played for 20 times as long.
The last one, a two-run blast against All-Star Robbie Ray, came after Mike Shildt pinch-hit with O’Hearn against a lefty. It wasn’t exactly a normal decision – Jake Cronenworth was hit in the hand in his previous plate appearance, and while he played the field afterwards, he didn’t appear to be capable of swinging a bat. Since the Padres had already juiced their lineup with righties against Ray, the only bench hitter with a platoon advantage was Elias Díaz, and your light-hitting backup catcher isn’t a real pinch-hitting option. O’Hearn was the logical play even if “pinch-hit with the guy we never let face lefties against a dominant lefty” isn’t normally a good decision.
So, is O’Hearn suddenly a lefty killer? I don’t think so, but I definitely hope so. The Padres are going to run into many more chances to either let O’Hearn hit against a lefty or replace him with an inferior hitter (Jose Iglesias? Bryce Johnson?) who stands on the other side of the plate. Previously, the decision has rarely been interesting – get the righty in there. In the last 20 days, though, O’Hearn is making it hard to pull him from the game. Yes, it’s six plate appearances. Sure, that’s not how sample sizes work. But since coming to the Padres, he’s slashing .800/.833/2.400 against lefties. Can you really turn that down in favor of Candelita? It’s gonna be a great subplot to watch down the stretch.
4. Thievery Alejandro Kirk doesn’t steal bases. In his entire minor league career, he swiped five bags, all in 2018 and 2019. He’s never so much as attempted one at the major league level. He’s listed at 5-foot-8 and 245 pounds, kind of the reverse of a prototypical base stealing frame. His 24.2 ft/sec sprint speed is in the second percentile league-wide. Could you, personally, beat Alejandro Kirk in a footrace? Probably not, but it’s at least closer than it would be for pretty much every other major leaguer.
Anyway, here’s Alejandro Kirk stealing a base:
This play was a perfect storm of pro-stealing factors. With only one out and a runner on third in a one-run game, the Rangers infield was all the way in. That meant Jake Burger couldn’t hold Kirk on first base because he was off the line and on the grass. It wasn’t a big deal, though. Is there a runner less important to hold on than the guy with 2,000 plate appearances and zero stolen base attempts? Meanwhile, with Daulton Varsho on third base, Kyle Higashioka had no interest in throwing down to second and letting Varsho maraud home. The Rangers knew there was no throw coming to second. Look at their positioning with the ball already in Higashioka’s glove:
In other words, they were more or less daring Kirk to go. Why wouldn’t they? Kirk batted 1,946 times before attempting his first steal. Second place in the majors for most plate appearances without attempting one? Spencer Horwitz with 723. The post-integration record for career plate appearances without a stolen base attempt is 2,224, by Johnny Estrada from 2001-2008. Very few batters reach 1,000 plate appearances without trying to steal at least once. Kirk was a true standout in his field of standing around.
Now he’s got a swipe in his back pocket. Estrada’s record is safe; the odds of Horwitz getting to that milestone are negligible. He’s not even a catcher! But more importantly, Kirk is on the board. He tried to act casual after stealing the base, but the crowd wouldn’t let it go (the Jays posted that it was his first career stolen base on the scoreboard). You know you’ve done something fun when you get Max Scherzer to react like this:
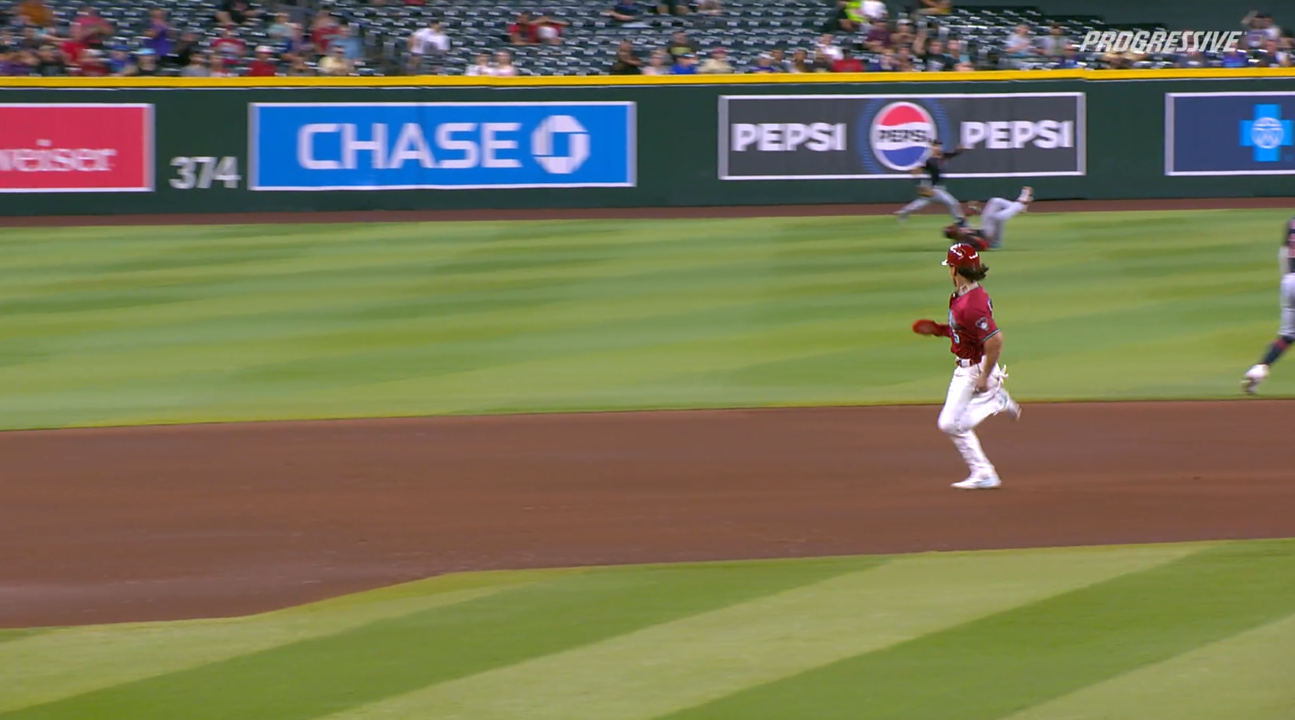
5. Pratfalls With Happy Endings
If your only understanding of outfield defense came from this column, you might think that falling over was a key part of the job:
Sorry for the camera angle; it’s all both broadcasts had. But in any case, what a disaster. You can’t fall down there. That’s Alek Freaking Thomas on the basepaths. He’s maniacally aggressive and has the speed to make it work; he’s 10 runs above average on the basepaths in his career even without taking stolen bases (he’s not a great base stealer) into account. He was on his horse right away and had eyes on home plate. Watch Thomas clock what’s going on in center, pick up third base coach Shaun Larkin waving him on, and book it home:
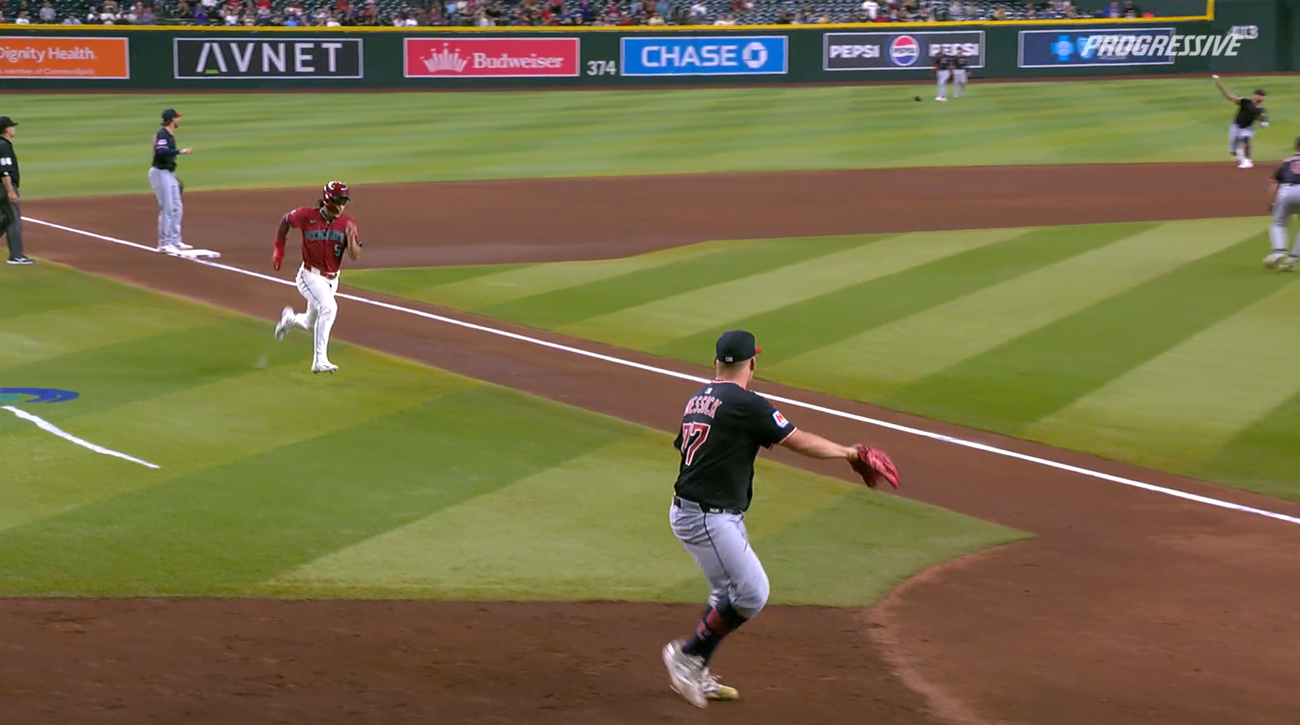
Wait, what? He got thrown out?!? Yeah, and by a lot, as it turns out. See, Angel Martínez fell, but it was fairly graceful as falls go. He didn’t lose the ball, didn’t panic, and was back on his feet quickly to toss in the relay. It took him about a second-and-a-half to recover, which isn’t great, but it’s a lot better than staying down or losing his grip:
That was a decent relay throw, perfectly on line but without a ton of vigor. Martínez has a cannon arm, but he didn’t show it off there; he was just thinking of getting the ball to the infield. When Gabriel Arias received the throw, though, he had maximum effort on his mind. Arias has an incredibly strong throwing arm, too. He knew there was going to be a play at the plate. He received the relay throw while already stepping into a throw home:
Don’t overlook Bo Naylor’s role in that play. The throw beat Thomas by plenty, but it reached Naylor on a short hop. Without perfect concentration, that ball would probably skip away. It hit so close to Naylor that he had to make a first-base-style scoop:
Meanwhile, though, even with an outfielder falling down and then feathering in a relay throw instead of ripping one, Thomas was out by quite a bit. I think I can show you what went wrong. Here’s Thomas with Martínez sprawled out in the outfield:
He’s nowhere near third base. Forget how hard Arias threw the ball on his relay; there aren’t many players who are making it home safely from this position:
The play wasn’t in front of Thomas; he noticed that Martínez fell, but he had to turn his head to run at maximum speed after that. But the timing just wasn’t right for even a fast runner to score. Martínez was throwing the ball in before Thomas reached third base. Arias was releasing it from shortstop before he was halfway home. Major league fielders are great. This just wasn’t a safe time to score, even after Martínez’s stumble.
It’s perhaps not a coincidence that Shaun Larkin isn’t coaching third base for the Diamondbacks anymore. Manager Torey Lovullo removed him after this very game, in fact. It was a straw-that-broke-the-camel’s-back situation, but I think it’s emblematic of how hard it is to wrap your head around just how athletic major leaguers are. Angel Martínez was on his back in the outfield, and then he made a natural-looking, low-effort move and just wasn’t. He didn’t have to make a hero throw. He didn’t have to try to whip it home on the fly to make up for his stumble. He just kept his head about him and let his natural coordination plus his team’s competence make up for the trip. Martínez has been quite bad in the outfield this year. He’s a shortstop by trade and hasn’t adapted to the broad expanses of grass all that cleanly. But making an athletic, tumbling play, and having the rest of the Guardians turn it into an out? He looks pretty good doing that.