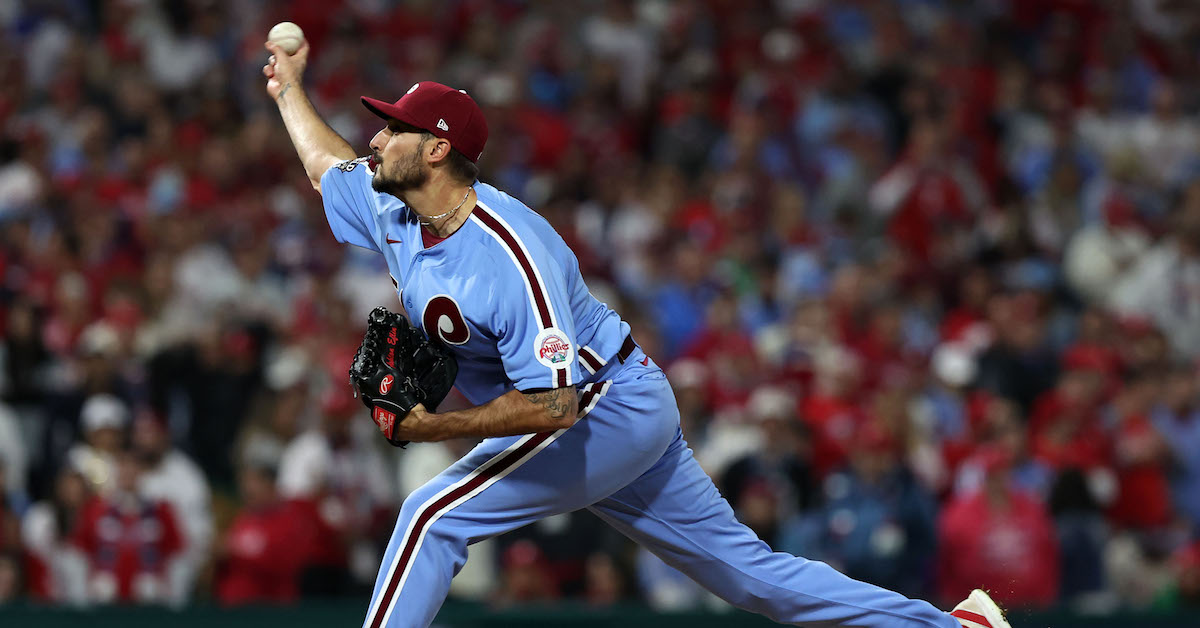
To paraphrase ILoveMakonnen, the Rays are winning, winning, winning again, so they’re spending, spending, spending. Tampa Bay threw its hat into the free agent ring Thursday night by inking right-hander Zach Eflin to a three-year, $40 million contract. That one of baseball’s most tightfisted teams would devote eight figures a year to a free agent comes as at least a mild surprise, and every time the Rays get their checkbook out some amusing historical facts bubble up to the surface.
Sure enough, the estimable Marc Topkin of the Tampa Bay Times reached into his bag and extracted a real doozy: Eflin’s $40 million deal is the largest free agent signing in franchise history by total value. Turns out the previous record-holder was, and you might want to sit down, Wilson Alvarez, who signed for $35 million over five years in the first year of the franchise’s existence.
A $40 million contract isn’t that much by the standards of modern baseball; for that matter, it’s second-pairing defenseman money for the Tampa Bay Lightning. But the signing might surprise onlookers who last saw Eflin as the third-best reliever in a Phillies bullpen that wasn’t as bad as its reputation but still wasn’t exactly the 1990 Reds. So let’s see what $40 million worth of Zach Eflin gets you these days. Read the rest of this entry »
Tuesday’s 40-man roster deadline led to the usual squall of transaction activity, with teams turning over portions of their rosters in an effort to make room for the incoming crop of young rookies. Often, teams with an overflow of viable big leaguers will try to get back what they can for some of those players via trade, but because we’re talking about guys straddling the line between major league viability and Triple-A, those trades tend not to be big enough to warrant an entire post. Over the next few days, I’ll endeavor to cover and analyze the moves made by each team, division by division. Readers can view this as the start of list season, as the players covered in this miniseries tend to be prospects who will get big league time in the next year. I’ll spend more time discussing players who I think need scouting updates or who I haven’t written about in the past. If you want additional detail on some of the more famous names you find below, pop over to The Board for a more thorough report. The Future Value grades littered throughout these posts may be different than those on the 2022 in-season prospect lists on The Board to reflect my updated opinions, and may be subject to change during the offseason.
In addition to free agent departures (Rougned Odor and Jesús Aguilar to name a few), the Orioles primed space on their 40-man roster by outrighting several fringe big leaguers, and opened Tuesday morning with just 34 players on their 40-man. They’ve had an especially high rate of turnover at catcher over the last few weeks, as they let Robinson Chirinos walk in free agency, outrighted Cam Gallagher and Anthony Bemboom off the roster, claimed both Aramis Garcia and Mark Kolozsvary off waivers from the Reds, and then outrighted Garcia. I have Kolozsvary, who is still prospect-eligible, evaluated as a third catcher on the 40-man.
Mike Elias also scooped up old buddy Daz Cameron, who replaces Yusniel Diaz on the 40-man. Daz has been in “prospect limbo” for about a year, as he graduated from rookie status in 2021 but still spent most of this season in the minors. The 40 FV (a fifth outfielder eval) and tool grades assigned to him at that time still hold (you can see those on his player page), making Daz a defensive upgrade to Diaz (who was outrighted off the roster) and a L/R fit with a couple other Orioles outfielders (Kyle Stowers, Cedric Mullins, maybe some Terrin Vavra). Cameron is out of options while Ryan McKenna (who I preferred to Cameron as a prospect by the time he graduated) is not, so barring further moves I assume Daz is more likely to break camp with the big club at this point. Read the rest of this entry »
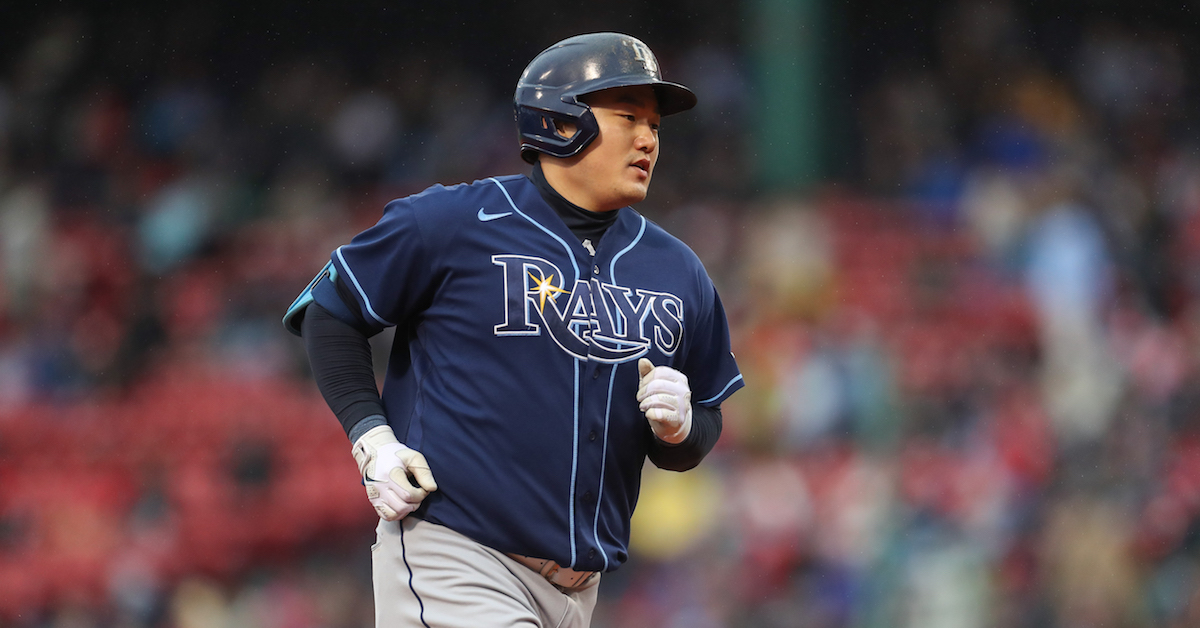
In a slightly unexpected but not at all shocking move, the Tampa Bay Rays sent first baseman Ji-Man Choi to the Pittsburgh Pirates last Thursday in exchange for low-minors pitching prospect Jack Hartman. The move was a little surprising, at least to those not familiar with Tampa Bay’s 40-man picture. Choi is a talented, inexpensive player who played a clear role for the Rays. He established himself as a fan favorite at Tropicana Field over the past five years, and there was a brief time this offseason (for about four or five hours) when he was the longest-tenured position player in Tampa. He has no clear successor in the Rays organization. Even Choi himself seemed to be caught off guard by the move. The swap was rather unexpected from a Pirates perspective, too. I can’t say I thought we’d see a rebuilding team send away a prospect for a veteran in one of the first noteworthy trades of the offseason.
Upon closer inspection, however, it’s easy to see why both teams swung this deal. The Rays have a surplus of young players in the majors who need playing time and a surplus of young players in the minors who will be eligible for the Rule 5 Draft this December if they aren’t added to the 40-man roster. Choi is a known quantity on the wrong side of 30 who doesn’t offer much in the way of positional flexibility – aside from the occasional full split at first base, that is. This is more than a simple salary dump on Tampa’s part; they have better ways to use Choi’s roster spot, an unfortunate reality for fans who grew to love his joyful attitude and impassioned bat flips. As for Pittsburgh, they finished the 2022 season without a regular first baseman and needed to find someone to fill that hole. They may not be contenders, but they still have to play 162 games, and adding another good bat to the middle of the lineup will make those games far more watchable. As an added bonus, if everything goes right, the Pirates could find themselves sneaking into contention in a weak NL Central division. Adding Choi would look like a brilliant move in retrospect. More likely, the Pirates will fall out of contention by the trade deadline and flip Choi for a lottery ticket or two. Read the rest of this entry »
The Astros inexplicably jettisoned General Manager James Click six days after winning the World Series. Jim Crane, whose reputation isn’t exactly stellar, offered Click just a one-year deal to remain in Houston — a veritable slap in the face given what the team had just accomplished. For all intents and purposes, the owner’s offer was an invitation to vamoose. Crane wanted Click gone.
With rumors of his dismissal rampant, Click fielded a barrage of questions regarding his future when he met with the media during this week’s GM meetings in Las Vegas. Not wanting to beat what was essentially a dead horse, I asked the highly-successful executive about something entirely different: Which position will be most affected by the forthcoming limitations on defensive shifts?
“My gut reaction would be second base,” replied Click. “You could make a credible case for any of the four infield positions, but I also don’t know how much it’s going to really change the game. We’ll still see teams shift as much as they can within the rules. We’ll see shortstops almost directly behind second base, or second basemen directly behind the bag. So the question becomes: ‘How much do those few feet really change the batter’s approach, and the result?’ That said, I do think we’re going to need more athleticism at all positions. Any time you’re not able to position a guy exactly where the ball is most likely to go, you’re going to have to be able to move a little more to get to those balls.” Read the rest of this entry »
Denzel Clarke isn’t one of the highest-profile prospects in the Oakland Athletics organization. A 2021 fourth-round pick out of Cal State Northridge, the 22-year-old outfielder is No. 17 in our most recent ranking of the system. But he is one of the most intriguing — and most exciting. Gifted with elite athleticism, Clarke made a number of highlight-reel catches this summer, and he also legged out a pair of inside-the-park home runs. In a season split between Low-A Stockton and High-A Lansing, he put up a 123 wRC+ while going deep 15 times and stealing 30 bases in 33 attempts.
His baseball background is modest compared to that of most of his peers. A native of Ontario, Canada, Clarke began playing at age 10, and it wasn’t until he was 16 that he began taking the game seriously. It was then that his travel-ball coach with the Toronto Mets told him he had a shot at doing something special if he devoted his attention to the diamond. Prior to that, he was multi-sport to the max.
“I played everything,” explained Clarke, who is currently with the Arizona Fall League’s Mesa Solar Sox. “In school, it was track and field — that runs in the family (Clarke’s mother competed in the 1984 Summer Olympics) —volleyball, basketball, badminton. I love racquet sports, so I played some tennis. I touched on pretty much everything except football and hockey. My mom was very precautionary with concussions, so those are the two I avoided.” Read the rest of this entry »
Two years before being hired to manage the Tampa Bay Devil Rays, Joe Maddon interviewed for the job in Boston. The winter-of-2003 vetting by the then Red Sox decision-makers — a subject I broached with Maddon in a 2007 interview — didn’t bear fruit… but what if it had? Earlier this week, I asked the proud son of Hazleton, Pennsylvania what might have happened had he started his big-league managerial career in Boston.
“I don’t think it would have turned out as well,” responded Maddon, who spent nine years in Tampa before going on to manage the Chicago Cubs and the Los Angeles Angels. “I wasn’t ready for that; I wasn’t ready for that market. Theo [Epstein] and Jed [Hoyer] made a great decision. Tito was the right guy.”
History bears that out. Four years removed from managing the Philadelphia Phillies for the same number of seasons, Terry Francona led the Red Sox to their first World Series title since 1918. While Maddon went on to win a World Series of his own, with the Cubs in 2016 — the team’s first since 1908 — hiring a first-year manager as Grady Little’s replacement wouldn’t have been in Boston’s best interests. Nor in Maddon’s.
“I needed more time to really develop what I wanted to do, and how I wanted to do it,” explained Maddon, whose managerial resume includes nine 90-plus-win seasons. “I really did need more of an expansion team than a tradition-based team at that point. I could experiment. I could try different things that weren’t very popular, or that nobody had thought about. I needed that wider berth, and the support that I got from Andrew [Friedman] at that particular time. So, thank God for unanswered prayers. I wanted the Red Sox job, but it was so much better for me to start out with the Devil Rays.” Read the rest of this entry »
Taylor Walls, pinch-hitter. Pinch-hitter Taylor Walls. I keep turning the words around in my head, like a mantra. Taylor Walls, pinch-hitter. Walls, Taylor: hitter, pinch. Sometimes it makes more sense to me, sometimes less; over enough time, anything you repeat enough seems to lose all meaning. It’s called semantic satiation: your brain starts to perceive anything as gibberish if it’s repeated frequently enough.
In this case, I’m not even sure the phrase made sense in the first place. Taylor Walls, pinch-hitter? This guy? The one who hit .172/.268/.285 this year? In the game to hit? It sounds strange right from the jump. Maybe I started from a faulty premise somewhere. Maybe pinch-hitter Taylor Walls only exists in my head. Maybe this is all a strange fever dream.
Only, it’s not. There’s box score evidence of it, right on MLB.com:
There he is, pinch-hitting in a playoff game. He’s hitting for Isaac Paredes, a right-hander, which gives us our first piece of evidence. Walls is a switch-hitter. Surely, then he came into the game to bat left-handed. Indeed he did: he faced off against Nick Sandlin, a right-handed reliever, in that initial plate appearance. Read the rest of this entry »
The Tampa Bay Rays’ season came to an end yesterday, and as a result, so did Stan Boroski’s coaching career. An underrated part of the A.L. East club’s success for over a decade, Boroski joined the staff prior to the 2010 season — he’d previously tutored pitchers in the Houston Astros organization — and became the bullpen coach in November 2011. He announced last month that he’d be retiring at the end of the season.
I recently asked members of Tampa Bay relief corps about their highly-regarded coach. What’s made him so good at his job?
“I really think it’s his presence,” said Pete Fairbanks, a mainstay in the Rays bullpen for the past three-plus seasons. “It lends itself to the environment that we’re in down there. It’s a very loose and unfocused group, and Stan does a great job of managing that. There is also his ability to put across our message of attacking the strike zone, and just how valuable that is. That’s something he has preached all of the time I’ve been here, It’s like beating a dead horse, but it’s a horse that needs to continue to be hit, over and over again. It’s that important.”
The message has resonated well. Rays relievers walked just 2.79 batters per nine innings this year — only the Dodgers were better — and their 2.96 walk rate since 2018 is the lowest in either league. In order to reach base against Boroski’s bullpen, you’ve typically needed to hit your way on. Read the rest of this entry »
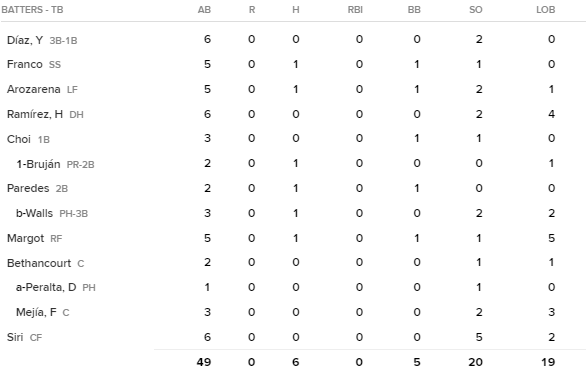
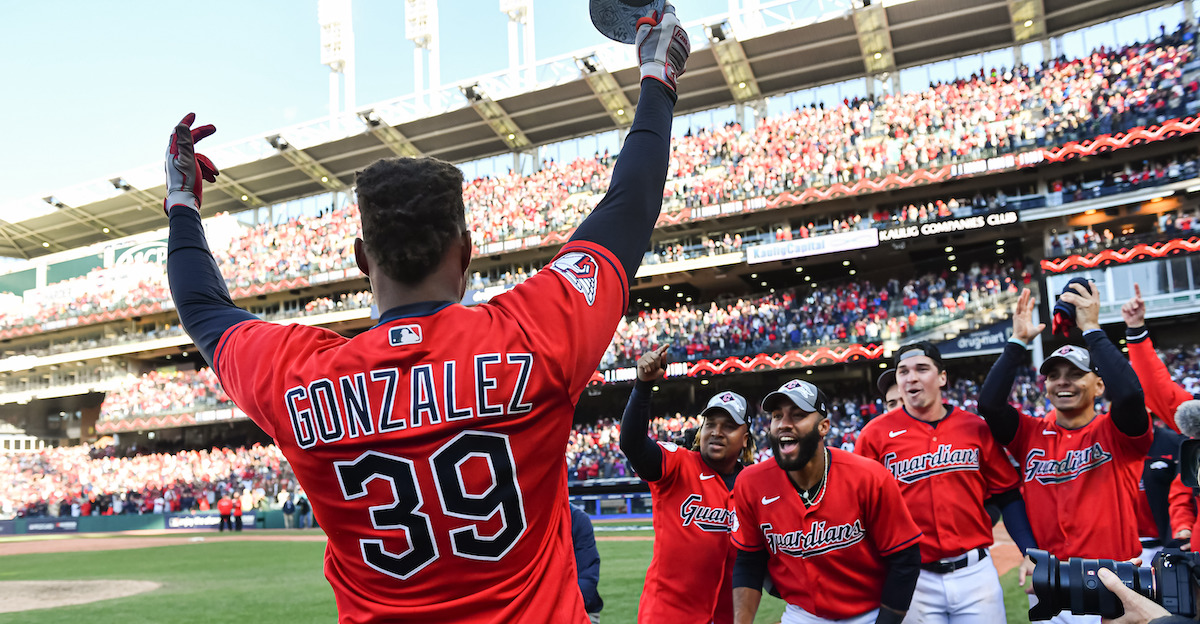
A day after playing the fastest postseason game since 1999, the Rays and Guardians combined for a game more than twice as long, lasting 15 innings and four hours and 57 minutes. Dominant pitching was the name of the game as both teams were held scoreless until the 15th inning — the longest scoreless postseason game in major league history. The decisive blow came when Oscar Gonzalez blasted a Corey Kluber cutter deep into left-center field for the walk-off win.
Between the two teams, 16 different pitchers combined for 39 strikeouts, eight walks, and 11 hits. They threw 432 pitches, 68% of which were strikes. Just 15 of the 58 balls in play were hard hit. No matter how you slice it, it was simply a masterclass in modern pitching by both teams:
The Wild Card Series opener between the Rays and Guardians was quick-moving from the beginning. Rays ace Shane McClanahan worked around a few weakly hit singles in the early innings. Cleveland starter Shane Bieber’s only baserunner in the first four frames — Ji-Man Choi, who walked — was quickly erased by a Manuel Margot double play. The first five full innings were completed in just an hour and nine minutes despite playoff-length commercial breaks, largely due to the lack of offense and Bieber’s ridiculously quick pace on the mound. The matchup of two premier starters — the AL’s fifth- and seventh-best qualified pitchers by ERA — seemed to be everything fans were hoping for.
Bieber’s start was masterful, matching his MO from the regular season: steal strikes with four-seam fastballs, then get hitters to chase his cutter and slider off the plate. The Rays’ righty-heavy lineup couldn’t figure it out for the entire game, coming up empty on 17 of their 27 swings against those two pitches. Unsurprisingly, every single one of those swinging strikes was located down and to his glove side. Bieber’s impeccable placement of pitches on the outer half was especially noteworthy against the chase-happy Christian Bethancourt and Randy Arozarena, who went a combined 0–6 with five strikeouts, four of which came on breaking balls off the plate. Bieber’s 7.2 innings of one-run ball made for the longest playoff start by a Cleveland pitcher in 15 years and will likely be among the longest starts of any pitcher this postseason. That’s a continuation of the impressive volume he put up in the regular season; he was one of just three AL pitchers to cross the 200-inning threshold. Read the rest of this entry »