Archive for Royals

Bregging the Question

Nathan Ray Seebeck-USA TODAY Sports

We are now just over a week from pitchers and catchers reporting to spring training, and while there are still a lot of moves left to make, we have a basic idea how teams will be fundamentally constructed for the 2025 season. Our free agent tracker still lists 124 remaining free agents, as of Monday evening, but most of these players aren’t likely to have major impacts on their new teams. Only 15 of the players are projected on our Depth Charts as being worth one win, and only three players are projected at two wins. But one player remaining, Alex Bregman, stands clearly above the pack, at least as the mean old computers judge the situation. (Sorry, Polar Bear.)

A famous Scott Boras client in his early 30s remaining unsigned due to underwhelming offers in free agency has become a common refrain over the last few years. Unlike with some of their departing free agents over the years, the Astros have made more than a token effort at retaining their star, extending a six-year, $156 million offer in December. The general belief around baseball is that the deal is still on the table, and both the front office and his teammates would be very happy to have him return. But from a baseball standpoint, is Houston necessarily the best place for Bregman? And if it isn’t, which teams should be seriously pursuing him?

Fellow Fangraphéen Michael Baumann discussed the Bregman to the Astros scenario recently, and concluded that given the team’s needs and the acquisition of Isaac Paredes, it would be hard to get the maximum value out of Bregman’s return without doing something shocking, like trading Paredes before the start of the season. Since I’ve completed the initial run of ZiPS projections, I’m now equipped to do some (very) preliminary standings projections. I projected the Astros both with and without Bregman, using the normal methodology I use, which attempts to deal with team upside and downside scenarios and injuries.

ZiPS currently projects the league with a level of parity that appears, at first glance, to be greater than in the typical season. While the Dodgers are projected at 97 wins, the Astros are the only other team projected with an over/under number of 90 wins. That doesn’t mean there will be only two 90-win teams – in fact, you should expect quite a few more teams to reach that threshold — just that there’s a lot of uncertainty in a baseball team’s performance, and currently only two clubs have enough depth across their rosters to avoid the disastrous downside scenarios that are built into this projection system.

At 90.2 wins on average, reconfiguring a healthy Astros team to play Bregman at third, Paredes at second, and Jose Altuve in the outfield (the latter has been discussed), adds 2.8 wins (again, on average) to the bottom line in the ZiPS projections. That’s enough to bump the team’s playoff probability from 69.9% to 78.0%. A gain of just over eight percentage points is solid, to be sure, but how does that compare with the rest of the league?

To answer that question, I redid the simulation an additional 29 times, adding Bregman in turn to each team to see how his presence would change its playoff probability. It’s a bit more complex than simply replacing a team’s existing third baseman because in most cases, Bregman would cause a significant reshuffling of the roster roles. I tried to keep Bregman at third base wherever possible and shift others around him, and I completely avoided implausible scenarios, such as a team signing him to be its starting catcher. So, how’d it shake out?

ZiPS Playoff Probability – Signing Alex Bregman
Team Current Playoff Odds Playoff Odds With Bregman Change
Kansas City Royals 39.7% 54.3% 14.6%
Detroit Tigers 31.2% 43.6% 12.4%
Cincinnati Reds 26.2% 38.5% 12.3%
San Diego Padres 51.7% 63.7% 12.0%
Arizona Diamondbacks 50.4% 61.9% 11.5%
Boston Red Sox 45.3% 56.1% 10.8%
Philadelphia Phillies 65.5% 75.9% 10.4%
Seattle Mariners 53.0% 63.2% 10.2%
Cleveland Guardians 51.3% 61.4% 10.1%
Pittsburgh Pirates 21.9% 31.8% 9.9%
Minnesota Twins 49.6% 58.2% 8.6%
St. Louis Cardinals 27.7% 36.1% 8.4%
Milwaukee Brewers 51.8% 60.0% 8.2%
Houston Astros 69.9% 78.0% 8.2%
New York Mets 61.3% 69.3% 8.0%
Texas Rangers 49.9% 57.8% 7.9%
Teampa Bay Rays 32.6% 40.5% 7.9%
New York Yankees 60.7% 68.4% 7.7%
Toronto Blue Jays 40.7% 47.9% 7.2%
Atlanta Braves 68.8% 75.2% 6.4%
Washington Nationals 5.7% 11.4% 5.7%
Baltimore Orioles 61.4% 66.7% 5.3%
The Athletics 8.9% 14.0% 5.1%
Los Angeles Angels 5.8% 9.8% 4.0%
Miami Marlins 3.2% 6.8% 3.6%
Chicago Cubs 55.8% 59.4% 3.6%
San Francisco Giants 21.4% 24.2% 2.8%
Los Angeles Dodgers 87.8% 89.8% 2.0%
Colorado Rockies 0.8% 2.6% 1.8%
Chicago White Sox 0.0% 0.1% 0.1%

There are basically two questions here for projection systems to answer: 1) How many wins would Bregman add? 2) What are the utility of those wins? Bregman would represent a massive upgrade for the White Sox, but they are extremely unlikely to be relevant enough for those wins to actually matter. (Bregman would help the Pale Hose avoid rounding to zero, skyrocketing their playoff probability to 1-in-1,455!) Their rivals on the North Side, the Cubs, also rank very low on this list for the opposite reason: ZiPS already sees the Cubs as having a very strong offense. Sure, marginal wins are valuable for any team, but it’s hard for the Cubs to really leverage Bregman without one of those downside scenarios occurring, such as underperformance from guys like Matt Shaw or Seiya Suzuki, or a rash of injuries to key players. If there were a pitching equivalent of Bregman available, the Cubs would likely be at the very top of this list.

The Astros are only in the middle of the pack in terms of playoff improvement with Bregman. But two other teams that have been rumored at times to be in the mix would see a major surge in their postseason odds if they were to sign him: the Detroit Tigers and Boston Red Sox. The Tigers are in a position where the extra wins they’d get from Bregman would translate into a huge playoff probability boost, and though ZiPS thinks Jace Jung would be solid at third, signing Bregman would trigger a roster shuffle that would tighten up right field and the short side of Detroit’s DH platoon — the team’s two weakest positions, according to ZiPS. There’s been some speculation that Bregman could play second base for the Red Sox, but as ZiPS sees it, Boston would get more value from keeping Bregman at third, moving Rafael Devers to first, and letting Triston Casas and Masataka Yoshida fight it out at DH. This alignment would require prospect Kristian Campbell to be on the roster and filling the team’s current hole at the keystone.

But the best place for Bregman, at least in the ZiPS projections, is another AL Central team: the Kansas City Royals. While the corner outfield scenario is absolutely brutal, especially if MJ Melendez and Hunter Renfroe get the vast majority of the playing time in left and right field, respectively, ZiPS sees merit in shifting Maikel Garcia or Michael Massey into one of the corner spots on the grass, with Bregman taking over at third. ZiPS also thinks Bregman would provide a terrific resolution of the hot corner questions in Cincinnati, though there’s probably even less of a chance the Reds would actually do this than the Royals. The Padres likely don’t have enough payroll flexibility even to offer Bregman a short-term deal with an opt out, but if they could find room in their budget, sell him on playing second base, and shift Jake Cronenworth to left field — or even convince Bregman to play left — there would be more high-end scenarios in which San Diego could make the Dodgers uncomfortable.

My gut says the Tigers will be the team to land Bregman, and likely very soon if it happens. They just shored up the rotation with the signing of Jack Flaherty at an extremely reasonable price, and as the projected fourth-place team in the AL Central right now, they have a lot to gain by adding a legitimate All-Star. There’s a way, but is there a will?


Royals Shore up Bullpen With Carlos Estévez

Eric Hartline-USA TODAY Sports

It’s been a quiet winter in the AL Central. After Michael Wacha signed an extension at the beginning of the offseason, the division’s five teams combined to add only one deal worth more than $20 million in guaranteed money; that was Shane Bieber’s surgery-affected pillow contract with the Guardians. Now, finally, we can add another to the ledger, courtesy of the Royals. On Wednesday, they signed Carlos Estévez to a two-year, $22.2 million deal with a club option tacked on the end, as ESPN’s Jeff Passan first reported.

The Royals came into the winter looking for relief help. It’s not the only place their roster needed a glow-up – even after trading for Jonathan India, they could still use another bat or two, especially in the corner outfield – but the bullpen was also a particular area of need. Last year’s Royals made the playoffs on the back of pitching, but their starters were the ones doing the heavy lifting, not their relievers. Deadline acquisition Lucas Erceg was the best of the group by a large margin, and John Schreiber was the only other reliever with impressive full-season numbers.

It’s not so much that a team can’t make the playoffs with such a thin bullpen – obviously, the Royals did. But they did it by the skin of their teeth at 86-76, and that despite spectacular seasons from Cole Ragans, Seth Lugo, and Wacha. Counting on those three to combine for 94 starts, 12.9 WAR, and ERAs in the low 3.00s across the board again would be wishful thinking. Additionally, they no longer have last year’s fourth starter Brady Singer, who was Cincinnati’s return in the India trade.

The 2024 bullpen finished last in baseball in shutdowns – appearances that increased win probability by six percentage points or more – and fifth worst in win probability added. Those are outcome statistics, not process ones, but the process statistics weren’t exactly pretty either. Kansas City was middle of the pack in WAR (3.6), 20th in ERA (4.13), 26th in K-BB% (12.0%). It’s not just that this team didn’t have a “true closer” – its bullpen was light on contributors from top to bottom. Read the rest of this entry »


Job Posting: Kansas City Royals – Multiple Openings

Direct links to applications (please see job details below):

Pro Player Analyst
Developer-Baseball Systems


Pro Player Analyst

Location: Kauffman Stadium, One Royal Way, Kansas City, Missouri, United States of America

Job Summary: The Kansas City Royals Baseball Club is seeking a highly motivated and creative analyst to join the organization. Under the direction of the Assistant Director of Research & Development/Player Personnel and the Director of Pro Personnel & Strategy, the analyst will be involved in several stages of the player evaluation process to meet the needs of the organization. The successful applicant will leverage baseball data to provide a competitive edge when evaluating players for the Kansas City Royals. This role will be located in Kansas City, MO.

Position Accountabilities/Responsibilities:

  • Provide data driven insights to help evaluate both pitchers and position players.
  • Collaborate with other analysts and Baseball Operations personnel to provide support at all stages of the player evaluation process
  • Query and organize data to effectively communicate
  • Perform ad-hoc analysis to assist in decision making processes
  • Work to create, advance, and or maintain machine learning models

Position Qualifications, Skills, and Experience Required:

  • 4-year degree or equivalent experience in computer science, mathematics, statistics, or related quantitative field
  • Proficiency with SQL and R to query and organize data from large databases
  • Strong understanding of advanced baseball metrics to evaluate players
  • Interpersonal and communication skills to seamlessly interact with front office, analysts, scouts, and other Baseball Operations personnel
  • Familiarity with the landscape of Major League Baseball. e.g. teams, affiliates, rosters, prospects, free agents, etc.
  • Ability to work evening, weekend, and holiday hours during the baseball season

Preferred Qualifications:

  • Record of published baseball research and or experience ranking / evaluating players
  • Intimate knowledge of MLB rosters, farm systems, free agency, and all things involving player personnel
  • Experience with machine learning and modeling techniques to extract actionable insights within large data sets

Physical Requirements:

  • Ability to lift items weighing as much as 25 pounds
  • Must be able to work in a seated position for majority of workday
  • Must be able to be productive utilizing a computer keyboard and telephone
  • Must be able to be productive in a work environment where the noise level can be high at times
  • Must be comfortable walking to navigate the facility to access the office, concourse, etc.
  • Must be able to work extended hours and/or weekends as required by deadlines and event scheduling

The physical demands described here are representative of those that may be met by an employee to successfully perform the essential functions of this job.

This role is a Full-Time, Exempt opportunity that is eligible for Company Benefits, 401K, and PTO. This role is expected to have a standard 40-hour work week.

To Apply:
To apply, please follow this link.


Developer-Baseball Systems

Location: Kauffman Stadium, One Royal Way, Kansas City, Missouri, United States of America – Virtual

Job Summary: The Kansas City Royals Baseball Club is seeking a highly motivated developer to work with our group of Developers to support baseball operations. The ideal applicant will be able to manage multiple concurrent projects that facilitate enhanced communications, reporting, and other interactions between teams internal to the organization. At this time, we are open to the possibility of Remote work for the right candidate.

Position Accountabilities/Responsibilities:

  • Assist in development tasks and data operations
    • Help with system administration of database and web servers
    • Assist in daily task monitoring to ensure data health, quality assurance, and reliability of systems
    • Automate reports and other tasks that are used on a regular basis
    • Support schema and testing of databases of various sizes
    • Maintain and support existing code across various languages and frameworks
    • Develop, test, and optimize performance and accuracy of scripts used to calculate derived data
    • Design, build, and deploy new features for organizational web applications
    • Automate, manage, and report data lifecycle based on retention and storage requirements
    • Explore novel tools to visualize data and explore models by implementing UI/UX in HTML, CSS, JavaScript/Vue.js
    • Develop responsive front-end designs suitable for multiple devices and screen sizes
    • Collaborate with baseball operations staff to create and improve internal analysis and informational tools.
    • Help ensure that systems and solutions are in line with organizational objectives

Position Qualifications, Skills, and Experience Required:

  • 4 year degree in computer science, electrical engineering, or related field or equivalent experience is required
  • Ability to work evening, weekend, and holiday hours during the baseball season is a must
  • Excellent interpersonal and communications skills and ability to interact and work with staff at all levels
  • Ability to recognize and maintain confidentiality of work materials and issues as appropriate
  • Experience with the following tools, platforms, and business data is required:
    • Two years of experience with Python
    • Strong knowledge of SQL
    • Strong knowledge of Django, Flask, or similar
    • Basic administration of UNIX-based servers (Linux, Mac, etc.)
    • Managing cloud resources on AWS or a similar platform
    • Interest in and knowledge of UI/UX and web development technologies such as HTML5, JavaScript, Vue.js, Vite, ChartJS
  • Experience with the following tools, platforms and business data is preferred:
    • Business intelligence experience is a plus
    • Baseball knowledge and exposure to baseball statistics

Physical Requirements:

  • Ability to lift items weighing as much as 25 pounds
  • Must be able to be productive utilizing a computer keyboard and telephone
  • Must be able to be productive in a work environment where the noise level can be high at times
  • Must be comfortable walking to navigate the facility to access the office, concourse, etc.
  • Must be able to work extended hours and/or weekends as required by deadlines and event scheduling

The physical demands described here are representative of those that may be met by an employee to successfully perform the essential functions of this job.

This role is a Full-Time, Exempt opportunity that is eligible for Company Benefits, 401K, and PTO. This role is expected to have a standard 40-hour work week.

To Apply:
To apply, please follow this link.

The content in this posting was created and provided solely by the Kansas City Royals.


2025 ZiPS Projections: Kansas City Royals

For the 21st consecutive season, the ZiPS projection system is unleashing a full set of prognostications. For more information on the ZiPS projections, please consult this years introduction and MLB’s glossary entry. The team order is selected by lot, and the next team up is the Kansas City Royals.

Batters

The Tigers got a bit more attention simply because they seemed so dead in the water in July, but Kansas City’s 30-win improvement from the year before – and the even more impressive 35-win improvement in Pythagorean wins – was damn impressive. Victory may have a thousand fathers, but Bobby Witt Jr. was the big daddy of this feat, missing out on an MVP award only because he plays in the same league as peak Aaron Judge. ZiPS isn’t keen to project 7- or 8-WAR seasons as the baseline expectation based on a single season, but Witt’s projection still is that of a serious MVP candidate, and among players over the next five years, his WAR projection is less than those of only Juan Soto and Shohei Ohtani. His nearly $290 million deal with the Royals is, in the early days, looking like one of the best team investments of all time.

ZiPS is naturally excited about Witt, but that excitement doesn’t carry over to the rest of the team. This probably isn’t a surprise considering that other than Witt, only Salvador Perez finished with 2 WAR among Royals hitters in 2024. If you rank Kansas City’s hitters from last season, and add up the five best after Witt, they still add up to a full win short of the franchise shortstop.

That being said, it’s not exactly a Darryl Strawberry-playing-with-Springfield-Nuclear-Plant-employees situation. ZiPS expects the Royals to get around 2 WAR at most positions, with projections for Perez, Jonathan India, and Maikel Garcia crossing the two-win line in 2025. And if Michael Massey and Vinnie Pasquantino end up playing in more games than the 120-something that ZiPS projects for them, they each would also be worth more than 2 WAR. Witt may stand alone as a superstar in this lineup, but the Royals do have some solid talent here.

What is disappointing, given how competitive the projections are for the Royals as a whole and how close they are to the Guardians and Twins, is that Kansas City didn’t make a more vigorous attempt to upgrade its corner outfield spots. MJ Melendez hasn’t done anything that ought to entitle him to be the default option in left field, even if you look at his sunnier Steamer and OOPSY projections. If you subscribe to the ZiPS projection for Melendez, the Royals, as of now, look to enter the season as a reigning playoff team with a replacement-level corner outfield. Kansas City is projected to get positive value from its left fielders overall, but only because our Depth Charts is factoring in some time for India out there, and ZiPS doesn’t like right fielder Hunter Renfroe much more than it does Melendez. Right now, it looks like the value of four of Witt’s wins will do nothing more than offset the roughly replacement-level production of those two outfielders. Then again, that’s kind of what happened last year; while Witt posted a 10-win season, Royals corner outfielders combined for about -1.0 WAR. At the moment, ZiPS is projecting their corner outfielders to be worth about 1.3 WAR. That’s an improvement, yes, but as I mentioned up top, ZiPS projects Witt to be worth about four wins less than he was last season. That’s still a six-win season, but as things stand, the Royals are projected to get about two fewer wins of total value from the three positions — shortstop, left field, and right field — this year (7.3) than they did last year (9.4).

Pitchers

ZiPS may think that the Royals have the offense of a 68-win team plus Witt, but it thinks they have a rotation that’s in the top third of the league, a more bullish outlook than the other projections. It’s not shocking that ZiPS projects Cole Ragans to have a 4-WAR season, based on Depth Charts’ projected innings for him. (Below, you’ll see ZiPS has him at 2.9 WAR, but that’s only because it projects him to throw fewer innings.) But what might be surprising is how little Seth Lugo is projected to drop off from his superb 2024 season, when he finished second in the Cy Young voting. If Witt makes up for some of the sins for the offense, the Ragans-Lugo one-two punch covers up some more of them. Michael Wacha projects as a solid no. 3 starter, and though ZiPS doesn’t love Alec Marsh, it does like Kris Bubic quite a bit. It also thinks that pitchers like Michael Lorenzen and Kyle Wright are more than capable of filling out a decent rotation.

From a projection standpoint, Noah Cameron might be the most interesting Royals starter. He’s a soft-tosser, with a fastball in the low 90s, but he has excellent command and, most importantly, he avoided getting his brains beaten in by Triple-A hitters, which is a frequent fate of pitchers of this type. Instead, opposing batters had a very low average exit velocity against him (under 83 mph). And thanks to his changeup and curveball, which are both plus pitches, he also struck out 29% of the Triple-A batters he faced. A control pitcher who can avoid hard contact and knows how to get some strikeouts is someone worth watching.

ZiPS projects the bullpen to be right around league average, thanks in large part to Lucas Erceg and Hunter Harvey, both picked up last July for the pennant race (and beyond). Considered just as a reliever, Angel Zerpa would have a projected 3.65 ERA, an slight improvement over his solid 2024 season. John Schreiber gets a fairly good projection as well, but after that, ZiPS is less impressed with Kansas City’s relief options. If the Royals are not going to fix their outfield in free agency – and they may not be able to do that anymore because most of the quality guys have already signed — they might want to get another arm or two to improve their bullpen.

From a preliminary standpoint, ZiPS projects Kansas City to finish with 82-85 wins in 2025. That’s tantalizingly close to competing on equal terms with the Twins and Guardians, close enough that the Royals should keep adding this offseason to pull ahead of their division rivals and make a run at another postseason appearance.

Ballpark graphic courtesy Eephus League. Depth charts constructed by way of those listed here. Size of player names is very roughly proportional to Depth Chart playing time. The final team projections may differ considerably from our Depth Chart playing time.

Batters – Standard
Player B Age PO PA AB R H 2B 3B HR RBI BB SO SB CS
Bobby Witt Jr. R 25 SS 668 607 104 175 36 8 29 102 48 112 28 11
Jonathan India R 28 2B 585 496 76 123 28 2 12 57 66 111 11 2
Salvador Perez R 35 C 557 511 55 134 23 1 24 81 30 123 0 0
Maikel Garcia R 25 3B 601 546 79 139 28 4 7 57 45 107 30 4
Michael Massey L 27 2B 465 429 55 111 25 2 15 60 24 87 4 1
Vinnie Pasquantino L 27 1B 535 474 59 124 29 2 22 79 48 69 1 0
Drew Waters B 26 CF 466 416 67 99 26 6 11 52 42 137 15 5
Dairon Blanco R 32 LF 322 289 54 76 13 3 6 38 22 76 41 9
Carter Jensen L 21 C 560 493 57 107 22 5 12 59 59 149 8 2
Kyle Isbel L 28 CF 404 366 57 88 18 5 9 43 27 83 10 3
Cam Devanney R 28 SS 476 428 48 98 26 2 11 54 35 126 4 3
Freddy Fermin R 30 C 340 309 37 78 14 1 8 38 25 64 1 0
Tyler Gentry R 26 RF 500 442 55 105 24 2 11 58 47 147 7 2
John Rave L 27 LF 531 471 65 112 24 4 12 57 49 138 10 4
Devin Mann R 28 1B 444 388 50 91 26 1 10 48 44 114 2 2
Paul DeJong R 31 SS 441 403 47 86 17 0 18 51 27 135 2 2
Brian O’Keefe R 31 C 334 304 36 71 17 1 12 42 28 83 1 1
Josh Lester L 30 3B 476 440 52 102 23 2 15 60 30 119 2 1
Nick Loftin R 26 2B 474 419 58 103 20 2 9 51 43 75 7 3
Ryan Fitzgerald L 31 3B 415 371 41 82 21 3 9 44 32 109 3 3
Tyler Tolbert R 27 SS 525 467 61 104 19 6 4 47 34 140 27 3
Jack Pineda L 25 SS 506 434 57 100 22 2 6 46 41 127 10 4
Adam Frazier L 33 2B 415 373 49 93 19 3 5 37 31 65 6 2
Garrett Hampson R 30 CF 310 280 35 68 14 3 3 25 23 75 10 3
Nelson Velázquez R 26 DH 472 422 57 98 21 2 17 60 42 129 7 3
Joey Wiemer R 26 CF 442 393 49 86 20 2 8 42 42 127 11 4
Nick Pratto L 26 1B 501 438 59 100 22 4 14 58 50 167 8 1
Yuli Gurriel R 41 1B 405 364 41 95 22 1 7 40 34 62 6 0
Jordan Groshans R 25 3B 453 411 47 98 18 1 4 37 39 86 0 1
Cavan Biggio L 30 2B 333 281 41 59 13 1 6 30 42 88 3 1
Robbie Grossman B 35 DH 367 311 39 70 15 1 7 34 49 88 5 1
Gavin Cross L 24 RF 429 389 44 87 19 2 11 48 33 122 15 2
Javier Vaz L 24 2B 512 449 58 107 19 3 5 47 49 65 10 2
Braden Shewmake L 27 2B 377 354 42 77 17 3 8 38 17 78 14 3
Tommy Pham R 37 RF 455 408 53 101 21 2 10 45 40 105 9 3
Hunter Renfroe R 33 RF 448 406 49 94 23 0 15 54 37 94 1 1
Chris Brito R 25 1B 293 244 26 54 11 0 3 24 38 54 3 2
Justin Johnson R 25 2B 388 343 41 72 15 1 2 32 33 86 7 3
Dillan Shrum R 27 1B 422 370 42 78 15 2 11 52 35 155 0 0
Brett Squires L 25 1B 391 349 40 77 15 1 8 43 32 127 12 4
Leonel Valera R 25 SS 391 362 43 84 14 6 5 36 19 120 10 2
MJ Melendez L 26 LF 513 460 61 109 24 4 20 64 48 126 4 4
Peyton Wilson B 25 LF 507 454 56 102 20 3 9 53 43 123 12 3
Kyle Hayes R 27 C 85 73 5 11 3 0 1 7 8 29 0 1
Sam Kulasingam B 23 RF 99 91 7 20 3 1 0 8 4 21 2 0
Trevor Werner R 24 3B 477 431 51 85 21 5 10 46 38 188 10 3
Dustin Dickerson R 24 SS 421 364 46 74 9 0 1 27 45 108 5 3
Jac Caglianone L 22 1B 132 124 12 27 7 1 2 15 6 31 1 0
Carson Roccaforte L 23 CF 511 467 53 93 21 5 7 43 39 152 17 9
Luca Tresh R 25 C 404 369 39 83 16 1 10 43 30 106 0 1
Blake Mitchell L 20 C 492 428 51 79 14 2 12 51 56 179 11 4
River Town L 25 RF 358 308 36 67 11 2 4 36 35 63 6 3
Kale Emshoff R 27 DH 330 303 26 66 15 1 8 37 20 122 1 0
Diego Hernandez R 18 2B 229 209 25 49 5 2 1 20 10 54 8 3
Jean Ramirez L 24 RF 310 269 34 58 8 2 2 24 23 78 11 6
Spencer Nivens L 23 LF 409 368 44 74 15 2 13 47 36 120 4 3
Shervyen Newton B 26 SS 342 312 34 61 13 2 8 34 23 135 1 0
Deivis Nadal L 23 LF 248 220 24 38 10 3 3 21 18 110 6 2
Omar Hernandez R 23 C 335 306 32 61 11 1 2 23 19 78 9 3
Lizandro Rodriguez B 22 2B 375 338 36 69 12 3 3 32 25 93 10 5
Joe Gray Jr. R 25 CF 431 393 37 77 16 3 7 39 27 145 8 3

Batters – Advanced
Player PA BA OBP SLG OPS+ ISO BABIP Def WAR wOBA 3YOPS+ RC
Bobby Witt Jr. 668 .288 .343 .517 137 .229 .313 3 5.6 .363 136 118
Jonathan India 585 .248 .353 .385 107 .137 .298 -4 2.3 .329 108 71
Salvador Perez 557 .262 .314 .452 112 .190 .302 -6 2.2 .326 102 73
Maikel Garcia 601 .255 .309 .359 87 .104 .306 9 2.1 .294 90 68
Michael Massey 465 .259 .302 .431 103 .172 .293 1 1.7 .315 103 57
Vinnie Pasquantino 535 .261 .331 .470 121 .209 .266 -2 1.6 .342 120 74
Drew Waters 466 .238 .313 .408 100 .171 .328 0 1.6 .314 101 58
Dairon Blanco 322 .263 .326 .391 100 .128 .338 6 1.5 .315 96 49
Carter Jensen 560 .217 .302 .355 84 .138 .286 1 1.5 .290 90 55
Kyle Isbel 404 .241 .300 .391 92 .150 .289 5 1.4 .301 91 46
Cam Devanney 476 .229 .297 .376 88 .147 .299 2 1.3 .296 86 50
Freddy Fermin 340 .252 .310 .382 93 .129 .295 1 1.2 .303 86 37
Tyler Gentry 500 .238 .319 .376 94 .138 .331 6 1.1 .307 97 55
John Rave 531 .238 .311 .382 93 .144 .311 7 1.1 .303 94 60
Devin Mann 444 .234 .321 .384 97 .149 .306 8 1.1 .310 97 49
Paul DeJong 441 .214 .272 .390 83 .176 .272 3 1.0 .287 79 44
Brian O’Keefe 334 .234 .299 .415 98 .181 .283 -3 1.0 .310 93 38
Josh Lester 476 .232 .282 .395 87 .164 .284 4 1.0 .292 87 50
Nick Loftin 474 .246 .322 .367 93 .122 .280 -2 1.0 .305 94 52
Ryan Fitzgerald 415 .221 .293 .367 84 .146 .289 5 0.8 .289 81 42
Tyler Tolbert 525 .223 .285 .315 68 .092 .310 4 0.8 .267 71 48
Jack Pineda 506 .231 .305 .332 79 .101 .312 0 0.8 .284 81 48
Adam Frazier 415 .250 .316 .357 89 .107 .291 -1 0.7 .298 85 44
Garrett Hampson 310 .243 .303 .347 82 .104 .322 3 0.7 .287 81 33
Nelson Velázquez 472 .232 .307 .412 99 .180 .293 0 0.5 .313 102 56
Joey Wiemer 442 .219 .301 .341 80 .122 .302 1 0.5 .285 85 44
Nick Pratto 501 .228 .313 .392 96 .164 .334 0 0.5 .308 97 56
Yuli Gurriel 405 .261 .326 .385 99 .124 .298 0 0.4 .311 99 47
Jordan Groshans 453 .239 .305 .316 75 .078 .293 4 0.4 .278 76 40
Cavan Biggio 333 .210 .326 .328 84 .118 .284 -2 0.4 .297 83 31
Robbie Grossman 367 .225 .333 .347 92 .122 .292 0 0.2 .306 88 37
Gavin Cross 429 .223 .289 .367 83 .144 .296 3 0.2 .286 85 45
Javier Vaz 512 .238 .318 .327 82 .089 .269 -6 0.1 .289 85 50
Braden Shewmake 377 .218 .257 .351 68 .133 .258 3 0.1 .264 71 36
Tommy Pham 455 .247 .316 .382 95 .135 .310 -4 0.1 .307 91 52
Hunter Renfroe 448 .232 .297 .399 93 .168 .266 -2 0.1 .303 89 49
Chris Brito 293 .222 .332 .304 81 .082 .273 2 0.0 .292 83 26
Justin Johnson 388 .210 .290 .277 61 .067 .275 4 0.0 .259 64 30
Dillan Shrum 422 .211 .302 .351 83 .140 .328 3 0.0 .291 83 39
Brett Squires 391 .221 .297 .339 78 .118 .323 5 0.0 .282 82 39
Leonel Valera 391 .232 .278 .345 74 .113 .333 -4 -0.1 .273 77 38
MJ Melendez 513 .237 .310 .437 107 .200 .284 -11 -0.1 .322 109 65
Peyton Wilson 507 .225 .300 .341 80 .117 .289 1 -0.2 .285 82 50
Kyle Hayes 85 .151 .261 .233 40 .082 .232 0 -0.2 .233 45 5
Sam Kulasingam 99 .220 .263 .275 51 .055 .286 2 -0.2 .239 55 7
Trevor Werner 477 .197 .266 .339 68 .141 .322 0 -0.3 .266 73 42
Dustin Dickerson 421 .203 .298 .236 53 .033 .286 1 -0.4 .251 55 28
Jac Caglianone 132 .218 .265 .339 68 .121 .275 -1 -0.5 .262 72 11
Carson Roccaforte 511 .199 .262 .311 60 .111 .279 4 -0.5 .254 65 45
Luca Tresh 404 .225 .285 .355 78 .130 .289 -11 -0.5 .281 81 38
Blake Mitchell 492 .185 .287 .311 68 .126 .283 -9 -0.5 .270 77 42
River Town 358 .217 .316 .305 76 .088 .261 -3 -0.6 .282 78 32
Kale Emshoff 330 .217 .276 .353 75 .135 .334 0 -0.6 .276 74 30
Diego Hernandez 229 .235 .279 .292 61 .057 .312 -3 -0.7 .255 61 20
Jean Ramirez 310 .216 .281 .282 59 .067 .296 3 -0.7 .255 63 26
Spencer Nivens 409 .201 .274 .358 76 .157 .259 -1 -0.8 .277 84 38
Shervyen Newton 342 .195 .256 .327 62 .131 .313 -5 -0.8 .256 67 26
Deivis Nadal 248 .173 .244 .286 48 .114 .327 2 -0.9 .237 55 17
Omar Hernandez 335 .199 .250 .261 44 .062 .261 -1 -1.0 .229 48 23
Lizandro Rodriguez 375 .204 .266 .284 55 .080 .273 -3 -1.1 .248 62 29
Joe Gray Jr. 431 .196 .258 .305 57 .109 .291 -4 -1.3 .250 62 34

Batters – Top Near-Age Offensive Comps
Player Hit Comp 1 Hit Comp 2 Hit Comp 3
Bobby Witt Jr. Francisco Lindor Alex Rodriguez Dickie Thon
Jonathan India D’Angelo Jimenez Topper Rigney Willie Kamm
Salvador Perez Terry Steinbach Walker Cooper Ray Mueller
Maikel Garcia Horace Clarke Luis Aparicio Jason Bourgeois
Michael Massey Jack Dittmer Matt Downs Tito Fuentes
Vinnie Pasquantino Babe Young Tino Martinez Ed Kranepool
Drew Waters Earl Robinson Blake Tekotte Pete Milne
Dairon Blanco Vince Coleman Michael Lang Bubba Morton
Carter Jensen JD Closser Joe Nolan Donnie Scott
Kyle Isbel Steve Hecht Gene Kingsale Jim Buckner
Cam Devanney Steve Scarborough Matt Macri Jerry Kindall
Freddy Fermin Gary Bennett Joe Azcue Buddy Rosar
Tyler Gentry James Ramsey Byron Gettis Tyrone Horne
John Rave Clete Thomas Demond Smith Matthew den Dekker
Devin Mann Paul McAnulty Ossie Blanco Scott Stahoviak
Paul DeJong Pep Young Tim Pahuta Lee Elia
Brian O’Keefe Nick Hundley Robinson Chirinos Brian Dorsett
Josh Lester Marshall McDougall Les Bell Juan Uribe
Nick Loftin J.D. Pulfer Tim Jones Jerry McDonald
Ryan Fitzgerald Tom Heintzelman Andy Sheets Dale Berra
Tyler Tolbert Rudy Rufer Jorge Nunez Nelson Castro
Jack Pineda Drew Jackson Mark Belanger Damian Jackson
Adam Frazier Kevin Sefcik Casey Candaele Will Rhymes
Garrett Hampson Nook Logan Chris Duffy Glen Barker
Nelson Velázquez Gene Oliver Jesse Barfield Johnny Weekly
Joey Wiemer LeJon Powell Joseph Hicks Shawn Payne
Nick Pratto Marv Blaylock Tyrone Horne Jim Orsag
Yuli Gurriel Tony Gonzalez Adam Kennedy Butch McCord
Jordan Groshans Mark Germann Dave Cripe Luis Galindo
Cavan Biggio Woody English Nolan Fontana Harvey Zernia
Robbie Grossman Michael Tucker Gary Geiger Phil Stephenson
Gavin Cross Pat Bryant Kevin Belcher Tito Nanni
Javier Vaz Matt Gallegos Wayne Meadows Jerry McDonald
Braden Shewmake Johnnie Walker Brandon Carter Mike Ramsey
Tommy Pham Tommy Harper Mike Kreevich Nic Jackson
Hunter Renfroe Glenn Davis Micah Hoffpauir Carlos González
Chris Brito Bo Thompson Josh Alley Wes Rachels
Justin Johnson Dan Larson Sherwin Minster William Hallstrom
Dillan Shrum Ron Durham Billy Martin Brock Peterson
Brett Squires Joe Cherry Bob Detherage Jerod Edmondson
Leonel Valera Rolando Gomez Jackie Hernandez Rich Saitta
MJ Melendez Gary Rajsich Roger Maris Josh Reddick
Peyton Wilson Shawn Payne Darren Burton Terrell Lowery
Kyle Hayes Drew Larned Bryan Graves Nick Derba
Sam Kulasingam Julio Cruceta T.J. Gamba Anthony Ray
Trevor Werner Corey Ragsdale Scott Hemond Brett King
Dustin Dickerson Doug Bernier John Ihlenburg Danny Solano
Jac Caglianone Jem Argenal Omar Lebron Chao-Ting Tang
Carson Roccaforte Adam White Harvey Brumfield Arturo McDowell
Luca Tresh Don McCormack Ronn Reynolds Rick Bradley
Blake Mitchell Kurt Kingsolver Ben Petrick Lamar Drummonds
River Town Tanner Mathis Junior Ruiz Josh Alley
Kale Emshoff Joe Rapp Steve Jackson Sean Buckley
Diego Hernandez Franklin Font Deiner Lopez Matt Lawson
Jean Ramirez Luis Ayala Jason Alstead P.J. Williams
Spencer Nivens Orsino Hill Joe Wallis Jared Keel
Shervyen Newton Chuck Jeroloman Ray Busse Mike Trahan
Deivis Nadal Curtis Charles Sandy Santos Drew Rundle
Omar Hernandez Felix Minaya John Duncan Mike Durant
Lizandro Rodriguez James Lofton David Howard Ramon Perez
Joe Gray Jr. Ronnie Jebavy Billy Murphy Billy Mottram

Batters – 80th/20th Percentiles
Player 80th BA 80th OBP 80th SLG 80th OPS+ 80th WAR 20th BA 20th OBP 20th SLG 20th OPS+ 20th WAR
Bobby Witt Jr. .314 .371 .582 162 7.7 .261 .315 .462 115 3.9
Jonathan India .274 .379 .437 126 3.6 .219 .324 .338 89 0.9
Salvador Perez .289 .337 .503 131 3.5 .235 .289 .396 90 0.8
Maikel Garcia .281 .338 .404 105 3.4 .227 .279 .317 68 0.6
Michael Massey .284 .328 .479 122 2.8 .232 .276 .374 83 0.5
Vinnie Pasquantino .289 .355 .529 143 3.0 .238 .304 .417 103 0.3
Drew Waters .266 .341 .456 121 2.8 .207 .279 .356 79 0.4
Dairon Blanco .295 .354 .444 122 2.5 .234 .296 .342 81 0.7
Carter Jensen .248 .332 .412 109 3.2 .187 .271 .304 65 0.2
Kyle Isbel .268 .327 .450 114 2.4 .215 .273 .343 72 0.4
Cam Devanney .258 .323 .427 107 2.4 .203 .272 .329 68 0.2
Freddy Fermin .284 .340 .434 115 2.1 .226 .287 .337 77 0.5
Tyler Gentry .266 .343 .422 112 2.2 .208 .290 .327 74 -0.1
John Rave .263 .336 .431 113 2.4 .210 .284 .337 74 -0.1
Devin Mann .262 .345 .435 118 2.1 .207 .292 .342 78 0.1
Paul DeJong .236 .297 .445 101 2.0 .189 .252 .345 66 0.1
Brian O’Keefe .257 .327 .465 117 1.8 .205 .273 .357 76 0.1
Josh Lester .255 .301 .447 105 2.0 .207 .254 .354 71 0.0
Nick Loftin .270 .348 .409 110 1.9 .217 .293 .318 73 -0.2
Ryan Fitzgerald .251 .321 .422 104 1.8 .193 .264 .317 64 -0.2
Tyler Tolbert .251 .310 .357 87 2.1 .199 .258 .272 51 -0.2
Jack Pineda .256 .328 .371 96 1.8 .204 .280 .293 64 -0.2
Adam Frazier .279 .348 .407 108 1.8 .219 .290 .312 70 -0.2
Garrett Hampson .272 .332 .396 103 1.5 .215 .274 .299 61 -0.1
Nelson Velázquez .258 .335 .479 121 1.7 .202 .278 .360 77 -0.7
Joey Wiemer .248 .326 .385 98 1.4 .193 .272 .298 61 -0.5
Nick Pratto .254 .338 .450 118 1.7 .200 .283 .338 75 -0.8
Yuli Gurriel .292 .354 .430 116 1.4 .228 .293 .338 77 -0.6
Jordan Groshans .264 .330 .354 92 1.4 .209 .277 .276 58 -0.5
Cavan Biggio .237 .354 .371 103 1.1 .186 .298 .284 66 -0.3
Robbie Grossman .253 .363 .393 111 1.0 .193 .300 .292 68 -0.8
Gavin Cross .250 .316 .419 102 1.2 .197 .264 .322 64 -0.8
Javier Vaz .265 .347 .368 101 1.3 .209 .289 .287 64 -1.0
Braden Shewmake .244 .286 .411 93 1.2 .189 .231 .304 52 -0.7
Tommy Pham .278 .346 .433 116 1.3 .214 .288 .335 73 -1.0
Hunter Renfroe .253 .322 .449 111 1.0 .202 .269 .345 71 -1.0
Chris Brito .252 .366 .343 101 0.7 .196 .305 .262 64 -0.7
Justin Johnson .242 .320 .321 81 0.9 .183 .264 .239 44 -0.8
Dillan Shrum .240 .330 .410 105 1.1 .182 .276 .301 61 -1.1
Brett Squires .251 .326 .392 99 0.9 .195 .271 .295 58 -1.0
Leonel Valera .263 .309 .400 98 1.1 .199 .248 .291 53 -1.0
MJ Melendez .265 .336 .504 131 1.4 .212 .280 .385 86 -1.2
Peyton Wilson .248 .329 .384 97 0.9 .197 .276 .301 63 -1.2
Kyle Hayes .182 .293 .282 62 0.0 .122 .230 .192 21 -0.4
Sam Kulasingam .254 .295 .322 74 0.1 .191 .234 .237 34 -0.5
Trevor Werner .225 .293 .382 88 0.8 .168 .239 .283 47 -1.5
Dustin Dickerson .234 .330 .272 71 0.5 .172 .273 .204 37 -1.3
Jac Caglianone .252 .298 .397 91 -0.1 .192 .241 .285 48 -0.8
Carson Roccaforte .227 .290 .357 80 0.7 .173 .236 .277 43 -1.5
Luca Tresh .257 .314 .405 99 0.5 .200 .254 .312 59 -1.5
Blake Mitchell .218 .317 .377 92 0.9 .155 .253 .257 46 -1.9
River Town .247 .344 .352 95 0.1 .193 .290 .265 59 -1.4
Kale Emshoff .242 .301 .399 93 0.1 .193 .248 .308 55 -1.5
Diego Hernandez .269 .313 .338 82 0.0 .200 .243 .248 39 -1.2
Jean Ramirez .247 .312 .330 81 0.1 .187 .251 .246 42 -1.4
Spencer Nivens .229 .300 .405 95 0.2 .174 .246 .307 56 -1.7
Shervyen Newton .221 .286 .383 83 0.0 .164 .227 .278 41 -1.7
Deivis Nadal .203 .275 .339 69 -0.3 .140 .213 .232 26 -1.6
Omar Hernandez .238 .286 .310 67 0.0 .169 .220 .225 26 -1.7
Lizandro Rodriguez .232 .291 .337 75 -0.3 .179 .240 .248 37 -2.0
Joe Gray Jr. .225 .286 .354 77 -0.2 .172 .236 .261 41 -2.1

Batters – Platoon Splits
Player BA vs. L OBP vs. L SLG vs. L BA vs. R OBP vs. R SLG vs. R
Bobby Witt Jr. .292 .350 .528 .287 .340 .513
Jonathan India .255 .366 .393 .245 .347 .382
Salvador Perez .266 .325 .455 .261 .310 .451
Maikel Garcia .266 .324 .394 .249 .302 .341
Michael Massey .252 .299 .417 .262 .304 .437
Vinnie Pasquantino .258 .328 .445 .263 .333 .483
Drew Waters .237 .306 .404 .238 .317 .412
Dairon Blanco .274 .341 .411 .255 .315 .376
Carter Jensen .208 .286 .326 .221 .308 .367
Kyle Isbel .228 .288 .347 .245 .304 .408
Cam Devanney .237 .306 .391 .224 .292 .368
Freddy Fermin .259 .326 .388 .249 .300 .378
Tyler Gentry .240 .326 .390 .236 .315 .368
John Rave .236 .306 .354 .239 .312 .394
Devin Mann .238 .329 .392 .233 .317 .380
Paul DeJong .211 .281 .394 .214 .269 .388
Brian O’Keefe .244 .313 .429 .227 .291 .405
Josh Lester .223 .268 .382 .237 .289 .403
Nick Loftin .252 .335 .394 .242 .314 .352
Ryan Fitzgerald .217 .287 .357 .223 .296 .372
Tyler Tolbert .233 .301 .320 .218 .276 .312
Jack Pineda .218 .293 .303 .235 .310 .343
Adam Frazier .241 .305 .345 .252 .319 .360
Garrett Hampson .247 .308 .361 .240 .300 .339
Nelson Velázquez .238 .319 .429 .229 .301 .404
Joey Wiemer .232 .314 .374 .210 .292 .319
Nick Pratto .223 .308 .385 .231 .315 .397
Yuli Gurriel .265 .339 .381 .259 .320 .386
Jordan Groshans .240 .313 .329 .238 .300 .309
Cavan Biggio .203 .318 .284 .213 .328 .343
Robbie Grossman .237 .345 .355 .220 .327 .344
Gavin Cross .217 .276 .349 .226 .294 .375
Javier Vaz .237 .313 .322 .239 .320 .329
Braden Shewmake .211 .244 .336 .221 .264 .358
Tommy Pham .256 .338 .385 .244 .307 .381
Hunter Renfroe .240 .319 .416 .228 .287 .391
Chris Brito .224 .341 .316 .220 .328 .298
Justin Johnson .218 .304 .297 .207 .284 .269
Dillan Shrum .210 .301 .370 .211 .302 .343
Brett Squires .216 .293 .318 .222 .298 .345
Leonel Valera .239 .290 .373 .228 .272 .329
MJ Melendez .237 .302 .407 .237 .313 .449
Peyton Wilson .218 .295 .346 .227 .302 .340
Kyle Hayes .160 .276 .200 .146 .255 .250
Sam Kulasingam .207 .250 .241 .226 .269 .290
Trevor Werner .198 .274 .351 .197 .263 .333
Dustin Dickerson .207 .305 .234 .202 .295 .237
Jac Caglianone .194 .256 .250 .227 .269 .375
Carson Roccaforte .198 .255 .302 .199 .265 .314
Luca Tresh .237 .300 .390 .219 .277 .339
Blake Mitchell .170 .266 .250 .190 .294 .332
River Town .205 .304 .273 .223 .322 .318
Kale Emshoff .224 .288 .364 .214 .269 .347
Diego Hernandez .243 .293 .300 .230 .272 .288
Jean Ramirez .211 .277 .263 .218 .283 .290
Spencer Nivens .198 .261 .317 .202 .279 .375
Shervyen Newton .198 .255 .337 .194 .257 .322
Deivis Nadal .167 .225 .288 .175 .251 .286
Omar Hernandez .208 .259 .277 .195 .245 .254
Lizandro Rodriguez .208 .262 .302 .202 .268 .277
Joe Gray Jr. .197 .268 .316 .195 .252 .299

Pitchers – Standard
Player T Age W L ERA G GS IP H ER HR BB SO
Cole Ragans L 27 10 7 3.51 30 27 156.3 134 61 16 58 174
Seth Lugo R 35 10 9 3.81 30 26 160.7 156 68 19 44 135
Michael Wacha R 33 9 8 4.07 27 26 143.7 140 65 19 42 119
Noah Cameron L 25 6 6 4.35 23 23 109.7 110 53 15 33 95
Kris Bubic L 27 5 4 4.00 33 15 87.7 83 39 10 31 88
Michael Lorenzen R 33 6 7 4.45 27 24 127.3 120 63 17 52 94
Daniel Lynch IV L 28 5 6 4.50 30 22 128.0 132 64 17 42 103
Kyle Wright R 29 6 7 4.32 17 17 93.7 91 45 11 32 76
Alec Marsh R 27 8 10 4.55 27 25 126.7 120 64 17 48 122
Steven Zobac R 24 7 9 4.51 23 21 107.7 114 54 15 31 81
Hunter Harvey R 30 3 3 3.46 49 0 52.0 46 20 5 16 52
Chandler Champlain R 25 6 9 4.76 25 24 121.0 130 64 16 41 82
Angel Zerpa L 25 3 2 4.08 47 8 70.7 70 32 8 24 58
Lucas Erceg R 30 4 3 3.50 53 0 54.0 45 21 4 24 60
John Schreiber R 31 4 2 3.74 56 2 55.3 50 23 4 22 51
Dinelson Lamet R 32 4 6 4.68 22 14 75.0 77 39 10 33 62
Andrew Hoffmann R 25 4 7 4.79 25 18 88.3 91 47 11 36 65
James McArthur R 28 4 5 4.18 43 5 60.3 59 28 7 20 54
Jonathan Bowlan R 28 6 9 4.75 29 16 91.0 97 48 13 32 68
Austin Cox L 28 3 3 4.64 34 10 77.7 78 40 9 35 58
Carlos Hernández R 28 3 4 4.26 46 6 69.7 63 33 7 31 65
Luinder Avila R 23 4 7 5.06 22 21 90.7 94 51 11 42 62
Cruz Noriega R 27 4 5 4.74 27 8 68.3 75 36 10 19 44
Sam Long L 29 3 3 4.30 49 2 60.7 58 29 8 24 53
Taylor Clarke R 32 2 4 4.80 29 9 54.3 60 29 8 18 43
Tyson Guerrero L 26 4 7 5.13 23 21 98.3 102 56 15 44 75
Evan Sisk L 28 3 4 4.27 52 1 52.7 48 25 5 27 49
Ben Kudrna R 22 5 8 5.21 22 21 102.0 111 59 16 45 70
Steven Cruz R 26 2 3 4.39 49 1 53.3 49 26 6 27 51
Josh Taylor L 32 1 1 4.32 28 1 25.0 26 12 3 9 24
Ryan Brady R 26 4 4 4.62 39 2 64.3 69 33 8 21 42
Eric Cerantola R 25 3 3 5.00 32 6 63.0 59 35 8 38 60
Tyler Duffey R 34 3 3 4.54 35 0 39.7 38 20 5 19 35
Chris Stratton R 34 3 3 4.53 51 0 55.7 54 28 6 25 45
Anthony Simonelli R 26 3 4 4.65 38 1 60.0 60 31 8 23 49
Zach Davies R 32 3 4 5.44 18 18 84.3 92 51 13 39 58
Will Smith L 35 2 3 4.75 45 0 41.7 41 22 6 15 35
William Fleming R 26 3 6 5.46 23 18 92.3 108 56 14 35 46
Anderson Paulino R 26 3 4 4.89 41 2 57.0 62 31 7 22 36
Beck Way R 25 4 6 5.37 35 9 63.7 63 38 8 39 50
Keylan Killgore L 28 3 5 4.94 37 0 47.3 47 26 6 24 41
Jacob Wallace R 26 3 5 4.92 43 0 53.0 49 29 6 33 49
Brandon Johnson R 26 3 4 5.08 40 0 51.3 53 29 8 25 45
Chase Wallace R 26 2 3 5.18 33 0 41.7 45 24 6 21 28

Pitchers – Advanced
Player IP K/9 BB/9 HR/9 BB% K% BABIP ERA+ 3ERA+ FIP ERA- WAR
Cole Ragans 156.3 10.0 3.3 0.9 8.8% 26.4% .293 122 119 3.49 82 2.9
Seth Lugo 160.7 7.6 2.5 1.1 6.5% 20.1% .290 112 105 3.97 89 2.4
Michael Wacha 143.7 7.5 2.6 1.2 6.9% 19.6% .287 105 101 4.20 95 1.8
Noah Cameron 109.7 7.8 2.7 1.2 7.0% 20.2% .296 98 102 4.24 102 1.1
Kris Bubic 87.7 9.0 3.2 1.0 8.3% 23.6% .302 107 109 3.82 94 1.1
Michael Lorenzen 127.3 6.6 3.7 1.2 9.5% 17.2% .270 96 93 4.76 104 1.1
Daniel Lynch IV 128.0 7.2 3.0 1.2 7.6% 18.7% .298 95 96 4.40 105 1.0
Kyle Wright 93.7 7.3 3.1 1.1 7.9% 18.9% .288 99 99 4.33 101 1.0
Alec Marsh 126.7 8.7 3.4 1.2 8.8% 22.4% .293 94 95 4.37 106 1.0
Steven Zobac 107.7 6.8 2.6 1.3 6.7% 17.5% .297 95 99 4.46 106 0.9
Hunter Harvey 52.0 9.0 2.8 0.9 7.4% 24.1% .291 123 120 3.47 81 0.7
Chandler Champlain 121.0 6.1 3.0 1.2 7.8% 15.5% .296 90 94 4.68 111 0.7
Angel Zerpa 70.7 7.4 3.1 1.0 7.9% 19.0% .294 105 109 4.15 95 0.7
Lucas Erceg 54.0 10.0 4.0 0.7 10.3% 25.8% .293 122 117 3.59 82 0.6
John Schreiber 55.3 8.3 3.6 0.7 9.3% 21.6% .293 114 110 3.63 88 0.6
Dinelson Lamet 75.0 7.4 4.0 1.2 9.7% 18.3% .299 91 89 4.74 110 0.5
Andrew Hoffmann 88.3 6.6 3.7 1.1 9.3% 16.8% .293 89 93 4.72 112 0.5
James McArthur 60.3 8.1 3.0 1.0 7.7% 20.8% .297 102 103 4.14 98 0.4
Jonathan Bowlan 91.0 6.7 3.2 1.3 8.0% 17.0% .298 90 91 4.76 111 0.4
Austin Cox 77.7 6.7 4.1 1.0 10.2% 16.9% .290 92 93 4.66 109 0.4
Carlos Hernández 69.7 8.4 4.0 0.9 10.3% 21.6% .287 100 100 4.04 100 0.4
Luinder Avila 90.7 6.2 4.2 1.1 10.3% 15.2% .290 84 90 5.01 119 0.3
Cruz Noriega 68.3 5.8 2.5 1.3 6.4% 14.8% .294 90 92 4.76 111 0.2
Sam Long 60.7 7.9 3.6 1.2 9.1% 20.1% .286 99 99 4.38 101 0.2
Taylor Clarke 54.3 7.1 3.0 1.3 7.5% 17.9% .310 89 85 4.61 112 0.1
Tyson Guerrero 98.3 6.9 4.0 1.4 10.1% 17.2% .290 83 86 5.22 120 0.1
Evan Sisk 52.7 8.4 4.6 0.9 11.6% 21.0% .291 100 100 4.32 100 0.1
Ben Kudrna 102.0 6.2 4.0 1.4 9.8% 15.2% .294 82 89 5.29 122 0.1
Steven Cruz 53.3 8.6 4.6 1.0 11.3% 21.4% .291 97 101 4.47 103 0.1
Josh Taylor 25.0 8.6 3.2 1.1 8.2% 21.8% .319 99 93 4.02 101 0.0
Ryan Brady 64.3 5.9 2.9 1.1 7.4% 14.8% .295 93 95 4.65 108 0.0
Eric Cerantola 63.0 8.6 5.4 1.1 13.1% 20.6% .290 85 91 5.02 117 0.0
Tyler Duffey 39.7 7.9 4.3 1.1 10.8% 19.9% .289 94 87 4.64 106 -0.1
Chris Stratton 55.7 7.3 4.0 1.0 10.2% 18.4% .289 94 89 4.42 106 -0.1
Anthony Simonelli 60.0 7.4 3.5 1.2 8.8% 18.7% .291 92 96 4.63 109 -0.1
Zach Davies 84.3 6.2 4.2 1.4 10.3% 15.4% .296 78 76 5.27 127 -0.1
Will Smith 41.7 7.6 3.2 1.3 8.4% 19.6% .287 90 83 4.59 111 -0.1
William Fleming 92.3 4.5 3.4 1.4 8.4% 11.0% .297 78 81 5.52 128 -0.2
Anderson Paulino 57.0 5.7 3.5 1.1 8.6% 14.1% .297 87 91 4.93 115 -0.2
Beck Way 63.7 7.1 5.5 1.1 13.2% 16.9% .288 80 84 5.50 126 -0.2
Keylan Killgore 47.3 7.8 4.6 1.1 11.2% 19.1% .295 86 88 4.81 116 -0.3
Jacob Wallace 53.0 8.3 5.6 1.0 13.6% 20.2% .289 87 90 4.95 115 -0.3
Brandon Johnson 51.3 7.9 4.4 1.4 10.8% 19.4% .300 84 89 4.97 119 -0.4
Chase Wallace 41.7 6.0 4.5 1.3 10.9% 14.5% .293 82 84 5.51 121 -0.4

Pitchers – Top Near-Age Comps
Player Pit Comp 1 Pit Comp 2 Pit Comp 3
Cole Ragans Fernando Valenzuela Gary Peters David Price
Seth Lugo Ervin Santana Al Gettel Chris Carpenter
Michael Wacha Bartolo Colon Ervin Santana Tom Candiotti
Noah Cameron Rich Pratt Adam Pettyjohn Mike Sodders
Kris Bubic Chris Narveson Cory Luebke Daniel Norris
Michael Lorenzen Chase Anderson Jake Arrieta Edinson Volquez
Daniel Lynch IV Bob Knepper Allen Watson Patrick Corbin
Kyle Wright Denny Galehouse Jason Hammel Carl Willey
Alec Marsh Jharel Cotton James Baldwin Ed Rakow
Steven Zobac Pablo Lopez Josue Matos Mike McCardell
Hunter Harvey Bobby Jenks Tommy Hunter Tom Gorman
Chandler Champlain Matt Wisler Tyler Mahle Daniel Mengden
Angel Zerpa Ed Vande Berg Carmen Pignatiello Rick Palma
Lucas Erceg Gerry Pirtle Don Robinson Steve Blateric
John Schreiber Jerry Dipoto Luis Aponte Todd Frohwirth
Dinelson Lamet Bill Kelso Jimmy Serrano Everett Stull
Andrew Hoffmann Paul Clemens Jeff Shaver Linty Ingram
James McArthur J.J. Trujillo Alan Busenitz John Brebbia
Jonathan Bowlan Hector Noesi Mike Wright Seth Lugo
Austin Cox Russ Swan Jake Woods Justin Hampson
Carlos Hernández J.C. Gutierrez Hansel Robles Phil Klein
Luinder Avila Michael Lorenzen Larry Tolliver Steve Monson
Cruz Noriega Scott Winchester Raul Alcantara Russell Henrichs
Sam Long Vic Lombardi Bob Shirley Dennis Kinney
Taylor Clarke Mike Lyons Bob Muncrief Pedro Ramos
Tyson Guerrero Ben Braymer Cody Forsythe Lance Schuermann
Evan Sisk Don Hood Danny Coulombe Jeremy Affeldt
Ben Kudrna Steve Staniland Curt Schilling Ron Schamp
Steven Cruz J.P. Feyereisen Jesus Colome Daniel Webb
Josh Taylor Jim Poole Fred Scherman Tom Hilgendorf
Ryan Brady Miles Mikolas Anthony Bass Brian Knoll
Eric Cerantola Ryan Helsley Zach Jackson Paul Demny
Tyler Duffey Matt Karchner Juan Acevedo Brian Boehringer
Chris Stratton Tom Hurd Tom Edens Bucky Brandon
Anthony Simonelli Kevin Hodge Steve Evans Jason Anderson
Zach Davies Andy Hawkins Armando Galarraga Chris Tillman
Will Smith Morrie Martin Bob McClure Al Holland
William Fleming Casey Delgado Gabe Ribas Alex Klonowski
Anderson Paulino Jason Jester Pat Currin Paul Quinzer
Beck Way Chris Bassitt Adam Harben Bill Melvin
Keylan Killgore Jake Benz Tom Funk Matt Yourkin
Jacob Wallace Jeff Nelson Eddie Gaillard Wes Littleton
Brandon Johnson Scott Schroeffel Ricardo Rodriguez Barry Armitage
Chase Wallace Michael Young Chip Winiarski Justin Garza

Pitchers – Splits and Percentiles
Player BA vs. L OBP vs. L SLG vs. L BA vs. R OBP vs. R SLG vs. R 80th WAR 20th WAR 80th ERA 20th ERA
Cole Ragans .256 .322 .394 .215 .290 .349 3.9 1.8 2.98 4.06
Seth Lugo .247 .311 .400 .252 .294 .399 3.4 1.6 3.32 4.33
Michael Wacha .230 .290 .369 .266 .317 .448 2.5 0.9 3.63 4.69
Noah Cameron .232 .298 .375 .263 .317 .436 1.8 0.3 3.85 5.07
Kris Bubic .262 .330 .440 .238 .304 .379 1.8 0.2 3.38 4.91
Michael Lorenzen .241 .333 .406 .246 .306 .403 1.7 0.3 4.01 5.06
Daniel Lynch IV .256 .323 .385 .262 .321 .440 1.7 0.1 4.05 5.18
Kyle Wright .264 .337 .466 .235 .303 .337 1.5 0.3 3.82 5.02
Alec Marsh .265 .339 .442 .223 .304 .368 1.8 0.0 3.99 5.23
Steven Zobac .279 .341 .452 .254 .300 .418 1.5 0.2 4.01 5.17
Hunter Harvey .234 .308 .362 .231 .283 .365 1.2 0.1 2.76 4.45
Chandler Champlain .272 .338 .446 .267 .324 .430 1.4 0.0 4.26 5.28
Angel Zerpa .253 .310 .374 .253 .320 .409 1.1 0.1 3.51 4.85
Lucas Erceg .237 .349 .366 .207 .294 .306 1.2 -0.1 2.82 4.35
John Schreiber .260 .339 .396 .216 .292 .310 1.1 -0.1 3.03 4.75
Dinelson Lamet .281 .365 .473 .240 .315 .387 0.9 0.0 4.22 5.30
Andrew Hoffmann .282 .369 .466 .242 .306 .382 0.9 -0.2 4.32 5.44
James McArthur .248 .325 .394 .252 .314 .402 0.9 -0.1 3.62 4.96
Jonathan Bowlan .259 .330 .431 .275 .335 .450 1.0 -0.3 4.22 5.42
Austin Cox .240 .315 .365 .263 .346 .431 0.9 -0.1 4.12 5.26
Carlos Hernández .216 .308 .368 .254 .327 .373 0.8 -0.2 3.75 5.00
Luinder Avila .260 .350 .409 .263 .346 .429 0.8 -0.2 4.60 5.47
Cruz Noriega .262 .324 .444 .282 .325 .456 0.6 -0.2 4.21 5.35
Sam Long .235 .300 .370 .252 .324 .426 0.7 -0.3 3.61 5.08
Taylor Clarke .267 .336 .446 .280 .328 .449 0.6 -0.3 4.09 5.60
Tyson Guerrero .271 .352 .421 .258 .344 .449 0.7 -0.5 4.60 5.72
Evan Sisk .205 .300 .282 .258 .359 .427 0.5 -0.4 3.66 5.11
Ben Kudrna .263 .338 .437 .279 .355 .470 0.7 -0.5 4.76 5.71
Steven Cruz .228 .327 .380 .248 .344 .389 0.4 -0.4 3.81 5.21
Josh Taylor .235 .297 .353 .277 .342 .462 0.3 -0.2 3.60 5.44
Ryan Brady .270 .346 .417 .268 .318 .430 0.5 -0.4 4.00 5.23
Eric Cerantola .212 .331 .365 .264 .373 .421 0.5 -0.6 4.36 5.95
Tyler Duffey .246 .342 .391 .247 .330 .424 0.3 -0.4 3.79 5.45
Chris Stratton .257 .356 .396 .241 .305 .388 0.3 -0.6 3.94 5.44
Anthony Simonelli .240 .319 .370 .265 .336 .449 0.4 -0.5 4.02 5.29
Zach Davies .259 .352 .443 .283 .345 .467 0.4 -0.7 4.91 6.14
Will Smith .246 .295 .404 .255 .333 .434 0.3 -0.6 3.91 5.90
William Fleming .308 .382 .473 .269 .333 .466 0.4 -0.6 4.92 5.92
Anderson Paulino .282 .359 .437 .264 .336 .424 0.1 -0.6 4.44 5.48
Beck Way .286 .404 .446 .226 .344 .380 0.1 -0.6 4.87 6.03
Keylan Killgore .246 .343 .344 .256 .347 .448 0.1 -0.6 4.32 5.64
Jacob Wallace .253 .361 .429 .230 .353 .354 0.1 -0.9 4.30 5.80
Brandon Johnson .266 .352 .447 .257 .333 .440 0.0 -0.8 4.50 5.76
Chase Wallace .316 .409 .539 .231 .324 .363 -0.2 -0.7 4.73 5.83

Players are listed with their most recent teams wherever possible. This includes players who are unsigned or have retired, players who will miss 2025 due to injury, and players who were released in 2024. So yes, if you see Joe Schmoe, who quit baseball back in August to form a Norwegian Ukulele Dixieland Jazz band that only covers songs by The Smiths, he’s still listed here intentionally. ZiPS is assuming a league with an ERA of 4.11.

Hitters are ranked by zWAR, which is to say, WAR values as calculated by me, Dan Szymborski, whose surname is spelled with a z. WAR values might differ slightly from those that appear in the full release of ZiPS. Finally, I will advise anyone against — and might karate chop anyone guilty of — merely adding up WAR totals on a depth chart to produce projected team WAR. It is important to remember that ZiPS is agnostic about playing time, and has no information about, for example, how quickly a team will call up a prospect or what veteran has fallen into disfavor.

As always, incorrect projections are either caused by misinformation, a non-pragmatic reality, or by the skillful sabotage of our friend and former editor. You can, however, still get mad at me on Twitter or on BlueSky.


JAWS and the 2025 Hall of Fame Ballot: Ben Zobrist

Kim Klement-USA TODAY Sports

The following article is part of Jay Jaffe’s ongoing look at the candidates on the BBWAA 2025 Hall of Fame ballot. For a detailed introduction to this year’s ballot, and other candidates in the series, use the tool above; an introduction to JAWS can be found here. For a tentative schedule, see here. All WAR figures refer to the Baseball Reference version unless otherwise indicated.

2025 BBWAA Candidate: Ben Zobrist
Player Pos Career WAR Peak WAR JAWS H HR SB AVG/OBP/SLG OPS+
Ben Zobrist 2B 44.5 39.7 42.1 1,566 167 116 .266/.357/.426 113
SOURCE: Baseball Reference

Calling Ben Zobrist a utility player — or even a superutility player, given that he could play the outfield as well as the infield — is like calling Citizen Kane a movie about a sled. Unrecruited out of high school, and later unheralded as a prospect due to his age, he seemingly came out of nowhere to emerge as a star for the upstart Tampa Bay Rays, and in doing so removed the stigma of moving between positions on a regular basis. On the offensive side, “Zorilla” was a switch-hitter with elite plate discipline, mid-range power, and a minimal platoon split. As a defender, he provided average-or-better defense at second base and the outfield corners, and could play passably at a few other positions as well. Thanks to that combination, he helped change the way teams thought about roster construction, giving the more creative ones the flexibility to cobble together multiposition platoons.

Zobrist made only three All-Star teams in his 14-year career, but he helped his clubs reach the postseason eight times in an 11-year span (2008–18). From 2009–14, he ranked among the game’s most valuable players by WAR, and in the years adjacent to that stretch, he helped the Rays (2008), Royals (2015), and Cubs (2016) reach the World Series. He was the World Series MVP in the last of those seasons, when the Cubs won their first title in 108 years, and even got a breakfast cereal named after him, Zorilla Crunch! If not for his late start — he didn’t get more than 250 plate appearances in a season until age 28 — he might have had a real shot at making noise on this Hall of Fame ballot instead of going one-and-done. Read the rest of this entry »


Michael Lorenzen Is a Royal Again, This Time by Choice

Peter Aiken-Imagn Images

Michael Lorenzen is finally staying put. After signing one-year deals ahead of the last three seasons, and after getting traded at the deadline in each of the last two, the right-hander has played for six teams in four years. All that stops now. On Monday, a day when the temperature in Kansas City peaked at a balmy five degrees Fahrenheit, Lorenzen decided that the City of Fountains was a fine place to spend at least another half of a baseball season, agreeing to sign with the Royals on yet another one-year deal. For the first time since 2021, he’ll get to start a season in the same city where he ended the previous one. The deal is for $5.5 million plus performance escalators, and because of a $12 million mutual option for 2026 with a $1.5 million buyout clause, the guaranteed value comes to $7 million.

Despite a hamstring strain that cost him a month, Lorenzen excelled after being traded to the Royals at the 2024 deadline. In six starts and one relief appearance, he ran a 1.57 ERA over 28 2/3 innings. However, his peripherals were roughly the same before and after the move, and he mostly benefitted from the classic culprits of an unsustainable bounce: a .213 BABIP, an 89% strand rate, and a 6% HR/FB rate. The only notable change he made in Kansas City was ditching his regular slider entirely in favor of his sweeper. Over that short sample size, the move worked: The slider ran a 24% whiff rate in Texas, while the sweeper was at 41% in Kansas City.

I’m afraid I’m not done raining on Lorenzen’s parade just yet, because I have to tell you that this move terrifies me a bit. Between Texas and Kansas City, Lorenzen ran a 3.31 ERA, his best mark since 2019, when he put up a 2.92 mark as a reliever with the Reds. However, the underlying metrics were downright scary. Lorenzen’s 4.58 xERA, 4.89 FIP, and 4.95 xFIP were all his worst marks since his rookie season in 2015. The stuff models didn’t love him either: We have stuff numbers going back to 2020, and Lorenzen’s 5.10 predicted ERA from Pitching Bot and his 95 Stuff+ score were both the worst they’ve been over those five seasons. His 23.9% chase rate was the lowest of his career. His strikeout rate ticked up a tiny bit from 2023, but both it and his walk rate were among the worst of his career. Lorenzen’s four-seamer performed well, but it lost half a tick and a bit of movement. After his sinker spent the 2023 season flirting with the dead zone, in 2024 it decided to move in. Name a stat – other than BABIP, HR/FB, or strand rate – and Lorenzen was worse than his career average.

I’m sorry. That was a lot of negativity. I don’t necessarily think that Lorenzen is a lost cause, and a reunion with the Royals makes a lot of sense. They needed someone to replace the innings they lost by trading Brady Singer to Cincinnati. Also, even when he was at his best, Lorenzen routinely outperformed his peripherals. He was much more of a contact manager than a strikeout pitcher, and there’s no place better for such an approach than Kauffman Stadium. Entering his age-33 season, he no longer has above-average fastball velocity, but he throws the kitchen sink – four-seamer, sinker, changeup, cutter, slider, sweeper, curveball – and he’s still figuring out how to optimize the mix. In 2024, he brought back the cutter and curve, which he’d previously abandoned; the curve worked well and the slider didn’t. That’s useful information. He could keep throwing the sweeper more. He could stand to throw his changeup, which ran a 37% whiff rate, more as well. He also brings versatility, as he’s spent his career hopping between the rotation and the bullpen.

Speaking of versatility, there’s also the odd circumstance of Lorenzen’s two-way ambitions. He came up both a pitcher and a hitter after posting an .869 OPS with 41 home runs at Cal State Fullerton, and he has 147 major league plate appearances under his belt. A few weeks ago, Ken Rosenthal detailed a plan hatched by Lorenzen and his agent. Lorenzen would take a kitchen sink approach to free agency as well, pitching himself as a candidate to qualify as a two-way player, thereby giving his team (or, more likely, the team that trades for him at the deadline) an extra roster spot for a pitcher.

While it’s fun, the gambit was always a bit farfetched, and now that Lorenzen is returning to the Royals, it seems extremely unlikely to happen. In order to qualify, Lorenzen would need to get at least three PAs as a DH or a position player in at least 20 games. Lorenzen ran a .640 OPS in the minors, he has a career wRC+ of 84 in the majors, and he’s taken just two plate appearances over the past five seasons. Even when he was hitting, he never made it to 60 PAs in a season. The Royals just made it to the ALDS last season, and they are, in their own way, showing every indication that they intend to return to the playoffs in 2025. It’s hard to see them giving 60 PAs to a guy whose last hit came in 2019.

This is not a particularly risky move either for Lorenzen or the Royals. He’s back on a one-year contract, back in a pitcher-friendly park, and back playing for a team with which he had some success last season. The worst-case scenario is that the Royals don’t return to playoff contention and Lorenzen doesn’t pitch well enough (or hit enough, period) to get traded to his seventh team in five years. The best-case scenario involves Lorenzen throwing a couple more no-hitters and launching a couple more bombs. Of course, that worst-case scenario is far more likely than the best one, but either way, the possible benefits of this reunion far outweigh the potential pitfalls.


Sunday Notes: Garrett Crochet Changes Sox, Pitch Usage Conversation To Come

When addressing his team’s acquisition of Garrett Crochet at the Winter Meetings, Craig Breslow said that the 25-year-old southpaw’s relationship with the Red Sox’ analytics group will be important, so that he “can continue to understand how he can get the best out of his stuff.” I subsequently asked Boston’s Chief Baseball Officer if, based on their pre-trade homework, they have identified any specific adjustments Crochet might want to make, or if they plan to mostly just let him keep doing what he does.

“I think the answer is probably both,” replied Breslow. “Right? We want to lean into what he does particularly well, and he does a lot of things really, really well. You look at the strikeouts, and especially the strikeouts relative to the walks; that’s a pretty good underpinning for a really successful starting pitcher. Once we have a chance to get to know him, have conversations with him, we’ll lean on [pitching coach Andrew Bailey] and the rest of the group. But it’s probably not fair to talk about what adjustments we might make before we’ve had a chance to have that conversation with him.”

Crochet is looking forward to the conversation. He expects it to take place in the coming week, and he’ll go into it with thoughts he’s been formulating since last summer. When I talked to Crochet in late August, he spoke of usage percentages and how he’d begun tinkering with a sinker. I reminded him of that earlier exchange when he met with the Boston media over Zoom on Friday, then proceeded to ask about his forthcoming discussions with the Red Sox pitching department. Read the rest of this entry »


JAWS and the 2025 Hall of Fame Ballot: Carlos Beltrán

Robert Deutsch-Imagn Content Services, LLC

The following article is part of Jay Jaffe’s ongoing look at the candidates on the BBWAA 2025 Hall of Fame ballot. For a detailed introduction to this year’s ballot, and other candidates in the series, use the tool above; an introduction to JAWS can be found here. For a tentative schedule, and a chance to fill out a Hall of Fame ballot for our crowdsourcing project, see here. All WAR figures refer to the Baseball-Reference version unless otherwise indicated.

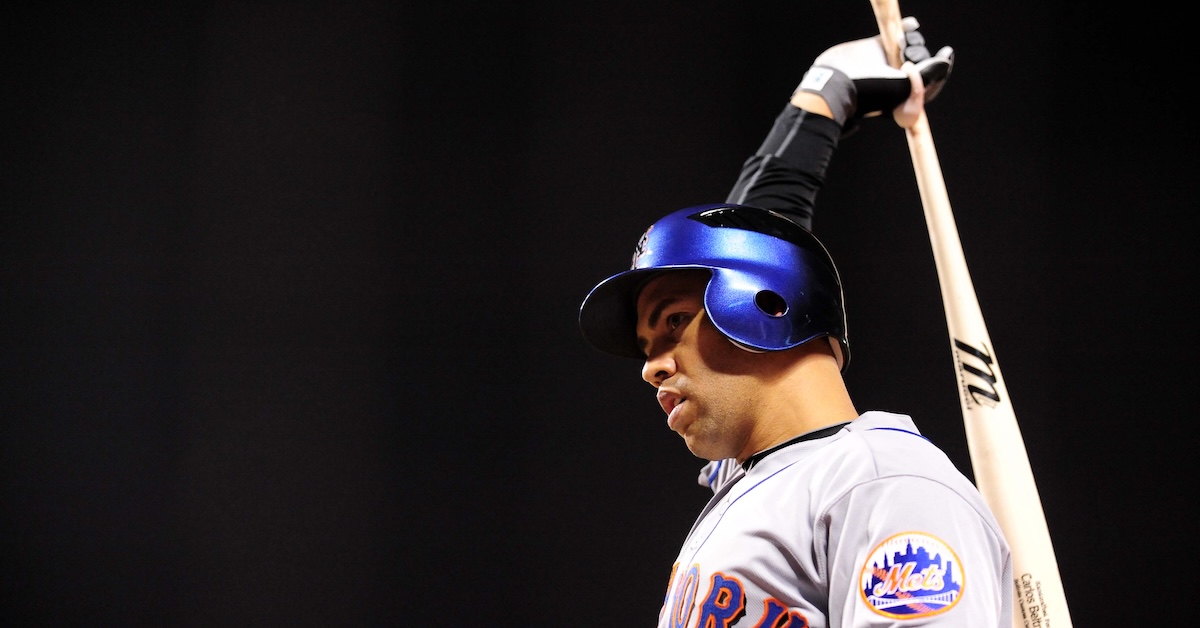
Carlos Beltrán was the quintessential five-tool player, a switch-hitting center fielder who harnessed his physical talents and became a superstar. Aided by a high baseball IQ that was essentially his sixth tool, he spent 20 seasons in the majors, making nine All-Star teams, winning three Gold Gloves, helping five different franchises reach the playoffs, and putting together some of the most dominant stretches in postseason history once he got there. At the end of his career, he helped the Astros win a championship.

Drafted out of Puerto Rico by the Royals, Beltrán didn’t truly thrive until he was traded away. He spent the heart of his career in New York, first with the Mets — on what was at the time the largest free-agent contract in team history — and later the Yankees. He endured his ups and downs in the Big Apple and elsewhere, including his share of injuries. Had he not missed substantial portions of three seasons, he might well have reached 3,000 hits, but even as it is, he put up impressive, Cooperstown-caliber career numbers. Not only is he one of just eight players with 300 home runs and 300 stolen bases, but he also owns the highest stolen base success rate (86.4%) of any player with at least 200 attempts.

Alas, two years after Beltrán’s career ended, he was identified as the player at the center of the biggest baseball scandal in a generation: the Astros’ illegal use of video replay to steal opponents’ signs in 2017 and ’18. He was “the godfather of the whole program” in the words of Tom Koch-Weser, the team’s director of advance information, and the only player identified in commissioner Rob Manfred’s January 2020 report. But between that report and additional reporting by the Wall Street Journal, it seems apparent that the whole team, including manager A.J. Hinch and general manager Jeff Luhnow, was well aware of the system and didn’t stop him or his co-conspirators. In that light, it’s worth wondering about the easy narrative that has left Beltrán holding the bag; Hinch hardly had to break stride in getting another managerial job once his suspension ended. While Beltrán was not disciplined by the league, the fallout cost him his job as manager of the Mets before he could even oversee a game, and he has yet to get another opportunity.

Will Beltrán’s involvement in sign stealing cost him a berth in Cooperstown, the way allegations concerning performance-enhancing drugs have for a handful of players with otherwise Hall-worthy numbers? At the very least it kept him from first-ballot election, as he received 46.5% on the 2023 ballot — a share that has typically portended eventual election for less complicated candidates. His 10.6-percentage point gain last year (to 57.1%) was the largest of any returning candidate, suggesting that he’s got a real shot at election someday, though I don’t expect him to jump to 75% this year. Read the rest of this entry »


Reds Trade Jonathan India for a Song Singer

Thomas Shea and Katie Stratman-Imagn Images

Last offseason, the Reds assembled a frankly confusing amount of infield depth. With the emergence of Elly De La Cruz, Matt McLain, and Noelvi Marte, there weren’t many spaces available to start with. They signed Jeimer Candelario, and already had Christian Encarnacion-Strand as an option at first. Spencer Steer moonlights in the infield too. That left Jonathan India as an odd man out, and he seemed like a clear trade candidate merely waiting for a good home.

In 2024, that good home turned out to be Cincinnati. McLain missed the entire year after shoulder surgery. Encarnacion-Strand got hurt in May and didn’t return. Marte got suspended for PED use. When all was said and done, the Reds ended up trading for infield depth in Santiago Espinal. India played in 151 games and supplied his usual OBP-heavy offense.

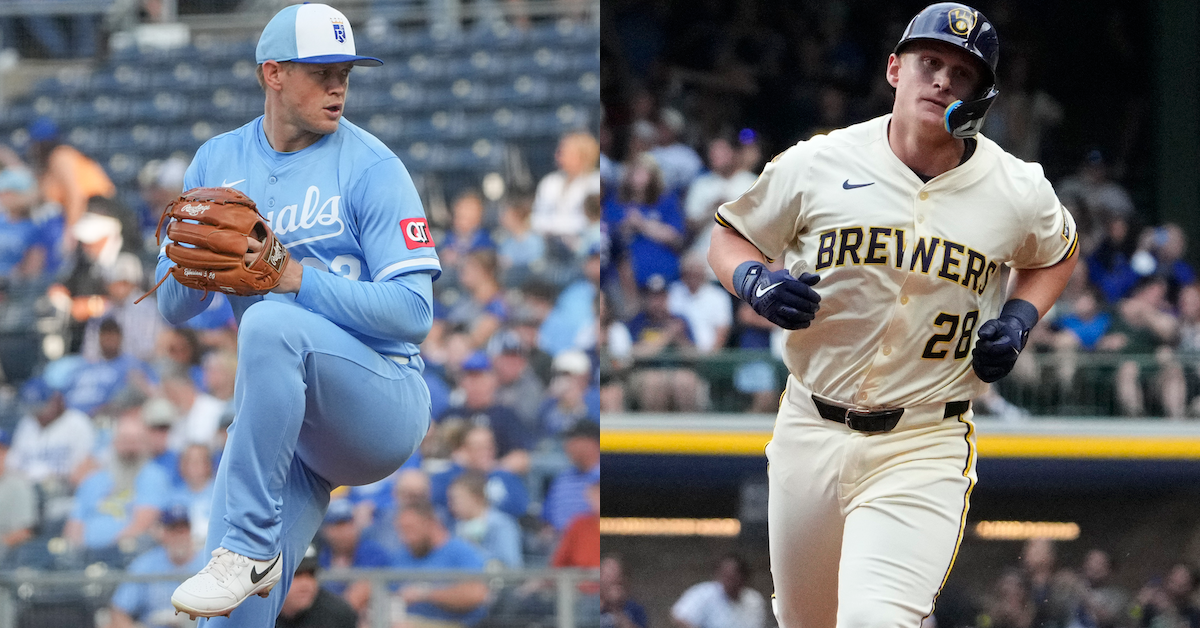
Holding onto India worked out for the Reds last year, but there’s no way they could’ve tried the same plan again. That would’ve been just too many resources committed to one subset of the team, and Cincinnati has needs across the roster. So after many months, the trade we’ve all been expecting for roughly a year has come to pass. The Reds traded India and outfielder Joey Wiemer to the Royals in exchange for righty starter Brady Singer.

At first blush, this trade feels strange from the Reds’ standpoint. India might be a luxury good for their team, but he’s a legitimately good hitter with two years of reasonably priced team control remaining. He was their third-best hitter by WAR, and the Reds need people on base to take advantage of their homer-friendly stadium. Singer was Kansas City’s fourth starter, and 700 innings into his career, he’s not exactly a mystery box: He’ll give you a 4-ish ERA if you can put a good defense behind him. Not only that, but the Reds had to throw in Wiemer just to get things done. What gives?
Read the rest of this entry »


Sunday Notes: Dispatches From the GM Meetings in San Antonio

When I talked to him at last year’s GM meetings, J.J. Picollo told me that an offseason priority was to add “guys with experience” to a Kansas City Royals roster that was long on promising young talent but short on veteran presence. Picollo did just that — Seth Lugo, Hunter Renfroe, Will Smith, and Michael Wacha were among those brought on board — and while the additions only told part of the story, the end result was a best seller. One year after winning just 56 games, the 2024 Royals went 86-76 and played October baseball for the first time in a decade.

What does the AL Central club’s Executive Vice President/General Manager see as the top priority going into next season?

“We need to be a little more dynamic offensively, and by that I mean we need to get on base at a higher rate than we did this year,” Picollo told me earlier this week in San Antonio. “We’re trying to target players we can lengthen out our lineup with, whether it’s someone at the top, in the middle, or toward the back end. Our identity is more pitching and defense, base running, and situational hitting, so how can we add some guys that can complement what we already have that will allow us to score more runs?”

The Royals crossed the plate 735 times in 2024, the sixth-highest total in the American League. Their .306 on-base percentage was ninth-highest, while their .403 slugging percentage and their 170 home runs ranked sixth and tenth respectively. As power obviously helps provide more runs, I asked Picollo if OBP is indeed the priority. Read the rest of this entry »