
Let’s Judge Midseason Trades Now
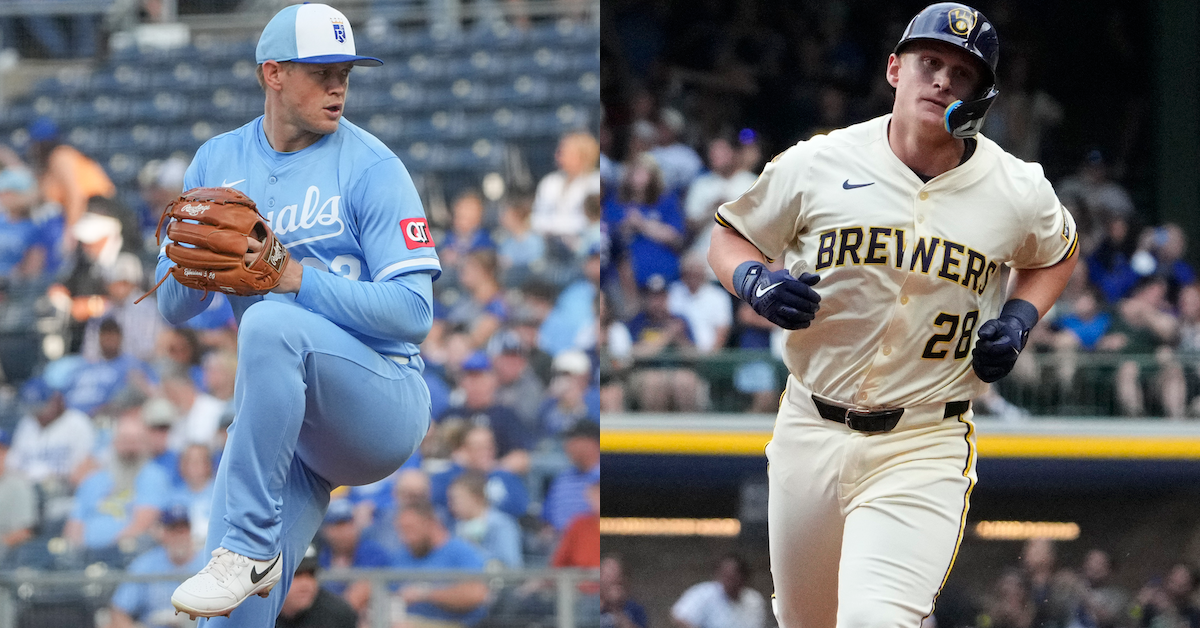
“Don’t grade trades on deadline day,” said the wise man. It takes months to find out if Jhoan Duran will put the Phillies over the top, years to learn how Carlos Correa’s second stint in Houston will go, and perhaps as much as a decade to learn exactly how much the Padres might eventually regret trading Leo De Vries.
At least, so says the wise man. “Hogwash,” says I. Let’s grade the midseason trades now.
According to RosterResource, 391 players have been traded since the end of last year’s World Series. Or at least, there have been 391 discrete player trade movements; a few of these guys have moved more than once. I’m only interested in midseason trades, which I’m defining as trades that took place after the general MLB Opening Day, March 27. Apologies to South Jersey legend Tyler Phillips, who’s been weirdly good (and weirdly aggro) since joining the Marlins; you were traded two days too early.
That leaves us with 264 player movements by trade since the day after Opening Day. I pared that list down to only include players who appeared in at least one game with the team that traded for them. So, goodbye long-term prospects like De Vries and Eduardo Tait. Goodbye injured vets like Jordan Montgomery. Goodbye maturing prospects or fringe major leaguers like Blade Tidwell, who appeared in the majors before they got traded, but not after.
That’s a subset of 147 player movements, involving 62 position players and 82 pitchers. (Scott Blewett, Michael Petersen, and Rafael Montero got traded twice and made major league contributions to multiple new teams this year.)
By having the most liberal possible definition of the word “midseason,” I’ve avoided having to make a judgment call on when the trade deadline actually starts. Though that does cause other problems, as you’ll see on this list of the most productive post-trade players.
| Date | Team | Name | Position | WAR | WPA |
|---|---|---|---|---|---|
| 6/13/2025 | MIL | Andrew Vaughn | 1B | 1.9 | 1.02 |
| 4/7/2025 | MIL | Quinn Priester | SP | 1.7 | 1.60 |
| 4/26/2025 | MIN | Kody Clemens | UTIL | 1.6 | 0.71 |
| 7/25/2025 | SEA | Josh Naylor | 1B | 1.5 | 0.80 |
| 7/31/2025 | PHI | Harrison Bader | OF | 1.5 | 0.64 |
| 7/31/2025 | HOU | Carlos Correa | INF | 1.4 | 0.29 |
| 7/6/2025 | BAL | Alex Jackson | C | 1.1 | -0.07 |
| 7/31/2025 | NYY | José Caballero | UTIL | 1.1 | 0.77 |
| 5/27/2025 | ATH | Sean Newcomb | RP | 1.0 | 1.89 |
| 7/31/2025 | KCR | Stephen Kolek | SP | 1.0 | 0.86 |
The Brewers top this list twice not just because Vaughn and Priester have been good, but because they got their business done super early. (A cynic might argue that because the Vaughn and Priester trades were so successful, we should cut the Brewers some slack for their somnambulant deadline season.) That’s why the most valuable player involved in a Phillies-Twins trade this year was not Duran, nor the white-hot Bader, but Kody Clemens.
The Phillies, inundated with left-handed platoon bats and with guys who can theoretically play second base but really ought to be in left field, had no use for Clemens, who was unlucky enough to fit both categories. They sent him to Minnesota for cash in late April, and since then Clemens has been solid enough, playing six defensive positions and posting a 101 wRC+. But his placement here is an artifact of his having played 107 games since the trade, 21 more than any other eligible player.
Good for Clemens, who’s now an everyday player for the first time in his major league career at age 29, but he’s not the kind of player we’re talking about. Let’s limit the sample to players who got traded during the month of July.
| Team | Name | POS | WAR | WPA |
|---|---|---|---|---|
| SEA | Josh Naylor | 1B | 1.5 | 0.80 |
| PHI | Harrison Bader | OF | 1.5 | 0.64 |
| HOU | Carlos Correa | INF | 1.4 | 0.29 |
| BAL | Alex Jackson | C | 1.1 | -0.07 |
| NYY | José Caballero | UTIL | 1.1 | 0.77 |
| KCR | Stephen Kolek | SP | 1.0 | 0.86 |
| SDP | Mason Miller | RP | 0.8 | 1.18 |
| PHI | Jhoan Duran | RP | 0.8 | 0.22 |
| KCR | Mike Yastrzemski | OF | 0.8 | -0.51 |
| TEX | Merrill Kelly | SP | 0.8 | 0.1 |
That’s more like it. This list includes some of the biggest names who moved at or near the deadline. Even the Royals’ pickups came from the Freddy Fermin challenge trade and a win-now move for Yastrzemski. Now, if you’re trading the second-best Dominican pitcher named Yunior Marte for a 34-year-old Yastrzemski, I don’t know if you’re trying especially hard to win now, but it’s still a deadline addition for a team that had playoff aspirations at the time.
Jackson is the only player here who wasn’t added to assist a playoff push. The by-then-obviously-doomed Orioles picked Jackson up from the Yankees because if you don’t put someone behind home plate the ball is going to go to the backstop on every pitch. Still, he’s been quite good since arriving in Baltimore.
On this short a timeline, WAR might not be the best metric for judging trades. Deadline acquisitions don’t just compile stats, they’re intended to drive in a run or get an out at a key moment. So who’s done the best job by win probability?
| Team | Name | Position | WAR | WPA |
|---|---|---|---|---|
| DET | Kyle Finnegan | RP | 0.5 | 1.51 |
| NYY | David Bednar | RP | 0.7 | 1.28 |
| SDP | Mason Miller | RP | 0.8 | 1.18 |
| BAL | Dietrich Enns | RP | 0.2 | 1.13 |
| CHC | Andrew Kittredge | RP | 0.5 | 0.90 |
| KCR | Stephen Kolek | SP | 1.0 | 0.86 |
| SEA | Josh Naylor | 1B | 1.5 | 0.80 |
| CIN | Miguel Andujar | DH | 0.6 | 0.77 |
| NYY | José Caballero | UTIL | 1.1 | 0.77 |
| TOR | Seranthony Domínguez | RP | 0.3 | 0.66 |
It’s probably appropriate that this list is dominated by relief pitchers, who moved in huge numbers, and in a few cases, for huge returns. Plus Miguel Andujar, who I keep forgetting is still in the league. But in just 29 games with the Reds, he’s been not only productive but apparently also clutch: He has 30 hits in a Reds uniform, and five of those have either tied the game or given Cincinnati the lead.
In the process of compiling this information, it became clear to me that — the heroics of Andujar notwithstanding — one individual trade isn’t going to swing a pennant race. No season-tilting superstar changed employers at the deadline; the biggest names to move were either closers or stars of the late 2010s, like Correa and Shane Bieber.
Of the 144 players who were traded this season and went on to make a contribution to their new teams, only 15 — or about one in 10 — has improved his team’s chances by as much as a win, either by WAR or WPA. Nobody’s broken the two-win threshold.
But several teams have acquired packages of reinforcements who have made a big difference as a group: The Mariners with Naylor and Eugenio Suárez; the Phillies with Duran and Bader; the Brewers with Priester and Vaughn. So let’s end by looking at each team’s trade performance in the aggregate.
| Team | New Players | WAR | WPA | Key Addition(s) |
|---|---|---|---|---|
| ARI | 3 | -1.3 | -1.89 | Tyler Locklear, Andrew Hoffman |
| ATH | 3 | 1.2 | 1.68 | Sean Newcomb |
| ATL | 8 | -0.8 | -1.43 | Erick Fedde, Rafael Montero |
| BAL | 4 | 0.9 | 0.00 | Alex Jackson, Dietrich Enns |
| BOS | 6 | -0.4 | -1.15 | Dustin May, Jordan Hicks, Kyle Harrison |
| CHC | 6 | 0.4 | -0.11 | Andrew Kittredge, Drew Pomeranz |
| CHW | 5 | 0.1 | -1.35 | Aaron Civale |
| CIN | 4 | 1.0 | -0.56 | Miguel Andujar, Ke’Bryan Hayes, Zack Littell |
| CLE | 2 | 0.8 | -0.16 | Matt Festa |
| COL | 1 | -0.4 | -0.77 | Alan Trejo |
| DET | 7 | 0.3 | -0.12 | Kyle Finnegan, Charlie Morton |
| HOU | 4 | 1.5 | -1.08 | Carlos Correa, Jesús Sánchez |
| KCR | 6 | 2.6 | -0.43 | Stephen Kolek, Mike Yastrzemski, Adam Frazier |
| LAA | 5 | -0.1 | -0.91 | LaMonte Wade Jr., Andrew Chafin |
| LAD | 9 | 0.3 | -1.71 | Brock Stewart, Alex Call |
| MIA | 2 | -0.3 | -0.54 | Michael Petersen, Ryan Gusto |
| MIL | 8 | 3.6 | 1.46 | Andrew Vaughn, Quinn Priester |
| MIN | 7 | 0.7 | -3.51 | Kody Clemens, Taj Bradley |
| NYM | 6 | 0.9 | -3.77 | Tyler Rogers, Ryan Helsley, Cedric Mullins |
| NYY | 7 | 1.9 | -0.48 | José Caballero, David Bednar |
| PHI | 5 | 2.1 | 0.74 | Jhoan Duran, Harrison Bader |
| PIT | 5 | -0.5 | -1.98 | Cam Devanney, Alexander Canario |
| SDP | 8 | 2.5 | -0.36 | Mason Miller, Ramón Laureano, Ryan O’Hearn |
| SEA | 3 | 2.3 | 0.46 | Eugenio Suárez, Josh Naylor |
| SFG | 3 | 1.0 | -0.38 | Rafael Devers, Drew Gilbert |
| TBR | 11 | 0.7 | -0.67 | Griffin Jax, Adrian Houser |
| TEX | 3 | 1.0 | 0.13 | Merrill Kelly, Phil Maton |
| TOR | 5 | 1.1 | 0.40 | Shane Bieber, Seranthony Domínguez |
| WSN | 1 | 0.4 | 0.18 | Clayton Beeter |
The Cardinals are the only team that hasn’t added a major league player via trade this season. The Rockies, ever content to stand pat, came close. In April, they purchased Alan Trejo from the Rangers; Trejo had only left the Rockies organization in the first place 10 months prior. Trejo spent three weeks in the organization, during which time he appeared in 13 games, batted .175 with one walk and two doubles, and generate -0.4 WAR. The Rockies released him on May 18, and nine days after that he re-signed with the Rangers.
Technically, that counts as acquiring a big leaguer in a trade. Practically, not so much.
In this table, we see yet more evidence of the Rays, Dodgers, and Padres being inveterate fidgeters, along with confirmation that the Mariners’ deadline moves were worth the cost.
But I was mildly surprised to learn that the Royals were massive winners in this year’s midseason trade market. Kolek has generated a full win in just four starts, which I can’t get my head around given his modest strikeout rate. The third guy in the Fermin trade, Ryan Bergert, has also been decent in his eight starts. Yastrzemski has hit well, and even Adam Frazier, whose acquisition I mocked two months ago, is hitting .281 since his return to Kansas City.
Was that enough to put the Royals back in the playoff hunt? No, and it wasn’t especially close, even in the depressingly winnable AL Central. But J.J. Picollo had one of the best hit rates of any GM this deadline, so bully for him.
I’m sure that in time we’ll look back on the 2025 deadline and pick winners and losers based on how various prospects developed, or how various newcomers impacted this year’s postseason. But that’s the future’s problem. In the meantime, congratulations to the Brewers and Royals.
Michael is a writer at FanGraphs. Previously, he was a staff writer at The Ringer and D1Baseball, and his work has appeared at Grantland, Baseball Prospectus, The Atlantic, ESPN.com, and various ill-remembered Phillies blogs. Follow him on Twitter, if you must, @MichaelBaumann.
Drew Pomeranz was not a trade deadline addition for the Cubs. He’s been on the team since April.
Mid-season trades, not deadline.
He was acquired on April 21st. That’s hardly mid-season. He was also acquired via a purchase, not a trade. Matt Festa is another one. Purchased by the Guardians on April 30th.
The author spent about four paragraphs explaining what he meant by midseason (and the pros and cons of said approach).
Helps to read the article, probably.
I did.
But the definition makes no sense. If you’re going to include every acquisition (trade or non-trade) since the beginning of the season, then say that. Instead of (for example) titling the article “Let’s Judge Midseason Trades Now”. There’s simply no universe in which that title fits the analysis that was done.
BTW, just because someone spent 4 paragraphs explaining their decision, doesn’t mean it was a good decision.
Mid-season: during the season.
Maybe you could consider, in the future, knowing what your objection actually is, so you don’t first pretend like it wasn’t explained, and then, upon being informed that it was explained, saying the explanation was wrong, when it met the dictionary definition of the terms used. And then trying a fleeting little “but even if I WAS wrong, you’re also bad and wrong” jab, because even you know you’re wrong.
Approach matters. Try something like:
“Pomeranz was acquired a bit early relative to others, so I think he throws off an analysis based on post-trade accumulated stats like WAR and WPA. Maybe some adjustment factor is needed? Or just be aware of that when interpreting the results”
I would better dollars to donuts that would be received better and bring amount the discussion you’re aiming for.
Some might say using four paragraphs to explain a simple definition is indicative of at least a compositional blunder if not a poor strategic decision.
Some are also horribly tedious. I had fun.
Not related to this article, but I remember a few years ago Pomeranz has a 0.00 ERA going into the last day of the season, alas he ended with higher
The Tigers pu-pu platter of pickups looked bad at the time & look even worse now.
Finnegan was really good until getting hurt & has been bad in 2 games once coming back.
Rafael Montero has been mid & is also struggling lately.
Codi Heuer was a nothing burger, only pitched 3 1/3 with a 10.34 FIP.
Paul Sewald has barely pitched.(He was out til September when traded to them)
Charlie Morton was so bad he got released.
Chris Paddack was so bad he got banished to the bullpen on a team that only had 3 good starters plus Charlie Morton as SP 4.
Not sure who #7 even is?? Brewer Hicklen? Randy Dobnak? Either one didn’t do much, Dobnak didn’t even pitch for Detroit.
I think it’s Hicklen — acquired on 3/28.
EDIT: though he managed 0.2 WAR in his one game by going 2 for 3 with a BB.
Certainly was not a good trade deadline. But, evaluating the WPA added from the last table, it has not been as bad as it *feels*. And that is entirely due to Finnegan.
Dobnak was just a salary dump by the Twins. I doubt the Tigers ever expected him to pitch for them. All it meant was that they paid a lesser prospect to acquire Paddack.
Detroit really needed to bolster the staring rotation and had the prospects to do so. They lined up really well with Pittsburgh to make a splash. Alas, neither team did anything to help their current or future selves.
Which midseason acquisition for the yankees was so bad that they removed the 2 WPA from Bednar and Caballero?
Probably the other relievers who got shelled the day after the deadline.
Jake Bird and Camilio Doval. Bird, in only 2 appearances, managed a -0.44 WPA; Doval’s at -1.31 through 29 appearances.
It’s a good thing Bednar has been as advertised, because, otherwise, woof.
Ryan McMahon is also underwater, but given that WPA doesn’t really measure defense, that’s kinda expected.
Counter point – CC Sabathia and his 11 wins after being traded.
Counter counter point – Brewers finished second in the division
Another counter point – Doyle Alexander going 9-0 after being traded from the Braves to the Tigers in 1987. The Tigers won the division by a game but lost the pennant. Of course, the guy they traded for him, some kid named Smoltz, had an OK career.
Only a third starter in his own teams rotation
Good point. Raises a question: how many third starters in the HOF?
I knew without looking that the Mets would have the largest negative WPA.
Oh, when the process looks wise and the results are bad, complaining feels different–but man does this suck.
If you told me the Mets acquired players wpa uld was twice as bad as it is I’d believe you the horror is real. If they were just mediocre the Mets would have clinched already.
If you told me Ryan Helsley’s WPA for the Mets was negative one million, I’d believe you.
Actually, you can blame this not on the Mets’ front office, but on Fangraphs! On August 1, Fangraphs had the Mets at 93.1% to make the playoffs. The Mets accordingly didn’t think they needed to do much to improve the team, and they didn’t. It was all going fine for a while, on September 1, Fangraphs had them at 94.5% to make the playoffs. If they don’t make it today (and Fangraphs has them as a 2-1 dog to do so), that 20-1 shot will pass the finish line first. Amazin.
It obviously doesn’t matter now but I want to point out that this meant the Fangraphs odds were heavily favoring the Mets against the Reds, since the coin-flip odds would’ve been 3-1 against them.
Fangraphs believed in the Mets to the very end.
WAR in the final table is WAR of additions? Or is it WAR of Addition – WAR of Subtractions where subtractions is defined as MLB value of players traded away? How about WPA?
I wonder if a better, albeit more complicated and harder, measure of the WAR added would involve WAAR of additions – (at the time of trade) projWAR of the player said additions are replacing.
Addition only, I’m pretty sure.
I’m fascinated that there are so many instances in the final table of teams cumulatively getting positive WAR but negative WPA from their additions. Is this because so many of these additions are relievers who are presumably then thrust into high-leverage situations?
Isn’t a lot of it that WAR is based on replacement level and WPA would be relative to average?
I double checked this just to make sure and the Median team WAR is like 32 (18 from hitters, 14 from pitchers) and the Median Team WPA is 0 (-3 from hitters & +3 from pitchers).
WPA is Winning Percent above Average.
WAR is Wins Above Replacement.
I was going to make this same complaint, but checked the comments first.
WPA is a poor metric to use because many acquired players might be below average AND still helpful.
A player could be an improvement and still below average.
The cumulative aspect makes this discrepancy even more severe: the longer a below average player is on a team the more negative WPA the player will acquire, even though he may also be notably better than replacement value and thus an improvement.
Also WPA does not include defense. A major flaw.
And of course is highly situational, but I think that’s a plus in this specific exercise
Why would a team in the playoff picture want to trade for a below average, or below replacement level player ? Ostensibly they would have someone on the farm to do that for free.
No one would trade for at/below replacement value.
Average is significantly better than replacement value.
A player can be valuable, notably better than replacement, and still below average.
It’s a story statistic. Is a direct attribution of how games are won and lost. Far from perfect, but for the article it’s trying to explain how much a player increased team wins versus average.
WPA is win probability added, it has nothing to do with win percentage
ahhh, yes lol
A Guardians – Diamondbacks World Series would demonstrate that selling major league players for no short term value is the key to success
As a Scottsdale resident since 2001 from NE OH who only switched my allegiance from the Tribe (as they were then) in 2006, I have already made plans with my siblings and progeny to attend a game.
Quote in a group text from youngest brother 9/11. “We bought our first round playoff bundle yesterday. How’s that for cockeyed optimism?”
Middle brother “Impressive.”
You joke, but major sports GMs have shown time and again that their organizational philosophy is “do what the last champ did.”
If the Reds or the D’Backs shade the Mets for the last wild card spot they should send David Stearns a thank you note and give Ryan Helsley a playoff share.
At least the Red Sox were trying with their trades…
Not the Devers one
Yunior Marte is nowhere near as good as his older, Catalonian cousin, Thenior Marte.
I can’t stop laughing in spite of myself
That would be Castilian, not Catalonian.
It would also be if you spelled it with a C or a Z instead of an S, but why let a different Romance language and an additional typo get in the way of the yolk
I realized that after the edit window had passed, so I am going to maintain that “Catalonian” is simply a more funny word than “Castillian” and claim that I did it on purpose.
Also, it’s kind of spain wide since the major town in Andalusia is pronounced “the-vie-ya” by the locals.
Catalans would hate you for doing this and ban you from ever visiting BarcelonLocal-locals from Sevilla would call it “Sevilla” as one of the characterizing elements in their accent is the clear “S” sound (“seseo”) vs. the “th” sound from other accents within Spain (“ceceo”) 🙂 (standard Spanish would also be “S” as per the ‘distinción’)
This guy Spanishes
Giving you solo applause from my living room right now, that was truly inspired
A bit funny not to even mention how mediocre Rafael Devers has been
What is “mediocre” to you? Is it the solely the batting average or is it the 17 HR as well since the trade? He is currently at 97/34/107/.252 for the season… that certainly isn’t mediocre.
I think he’s actually missing from the first table? Fangraphs has him at 1.3 WAR with SF.
I think we need to account for the possibility that Andrew Vaughn is a bioweapon sent to Milwaukee by Chris Getz to destroy the Cubs’ hopes of winning the NL Central.
For the Rangers, i think it’s worth it to factor in Danny Coulombe into the WAR calculation. He was so good prior to deadline and then awful for us. Got put into the doghouse very quickly and rarely used.
Did you forget to include my boyfriend Willie Castro w the Cubs?? 😢😢
I was surprised that Priester’s has a relatively low fWAR given 152 IP and 3.25 ERA. Had to remind myself, fWAR uses FIP. Isn’t xFIP better? Seems to penalizes ground ball pitchers.
I’m not sure xFIP would penalize ground-ball pitchers; it normalized HR/FB, so ground-ball pitchers wouldn’t get charged with as many imputed HRs since they don’t give up as many FBs.
Of the ten pitchers with the highest GB% (>100 IP so as to catch Priester), four have an FIP higher than their xFIP and six lower.
Once we have postseason results, THEN we can use ChampWPA.
The one thing this proves is that this methodology is probably not a good way to evaluate trades. So what if KC added 2.6 WAR? They didn’t make the playoffs. The only value of that 2.6 WAR is to put it on some KC front office resumes. (Actually,the Royals probably did OK in these deals as Kolek and Berget may be promising, controllable arms. Of course, this year’s WAR doesn’t tell us that, nor what their WAR will be next season.) And what to make of the fact that the Dodgers are at 0.3 WAR, -1.71 WPA (and won the division) and the Giants are at 1.0 WAR, -0.38 WPA, (and have tee times next week)? Of course, the Giants have seven more seasons to get a return on Devers. And seven years plus deferrals to pay him another $250 million or so. The point being, if you’re going to judge mid-season trades based solely on performance over the remainder of the season, the only thing that matters is whether the trades help you mkae the playoffs. If you don’t make the playoffs that added WAR is as valuable to you as the 68 WR Ernie Banks delivered to th Cubs all those years. There was obviously a lot of wrok and thought that went into this, but I think the conclusion is that it is not worth the effort of doing it again. (And I might add that if one were to do it again, it probably makes sense to analyze net WAR. Sure Cody Clemens and the others added 0.7 WAR to the Twins, but how much value did the Twins lose with the players they traded away? That probably explains why a 0.7 WAR translates to a -3.51 WPA, so while WPA may be a better measure, using net WAR would likely reflect a better correlation with WPA and be a somewhat more accurate measurement.)
I can see this wall of text from outer space