Ben Clemens FanGraphs Chat – 3/23/26
by Ben Clemens


March 23, 2026
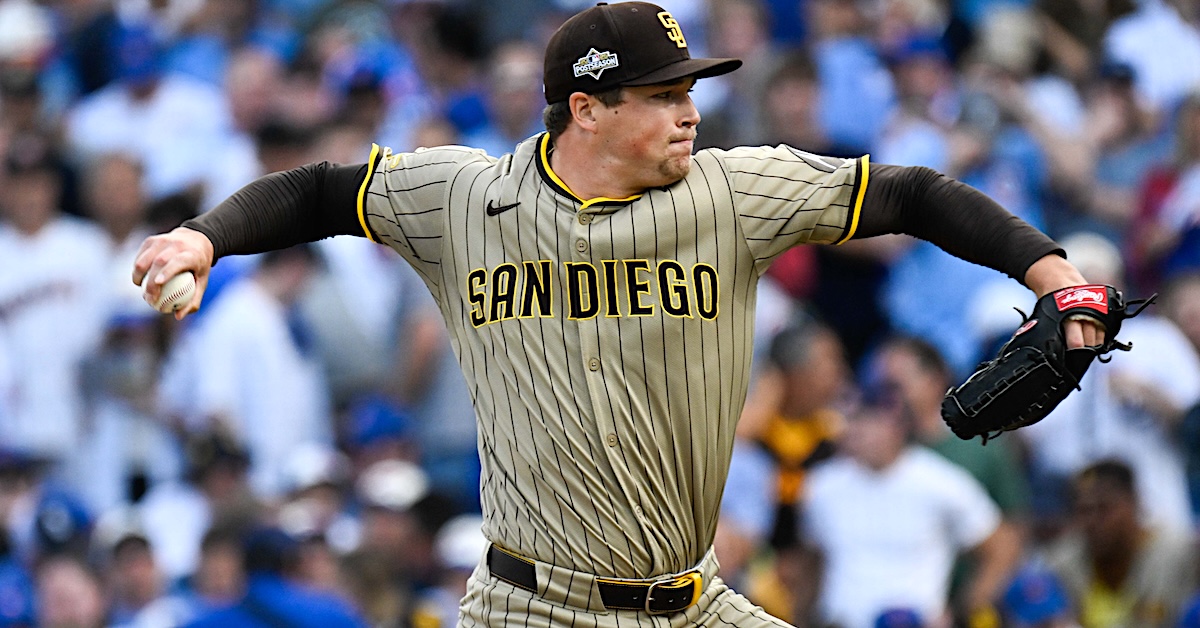
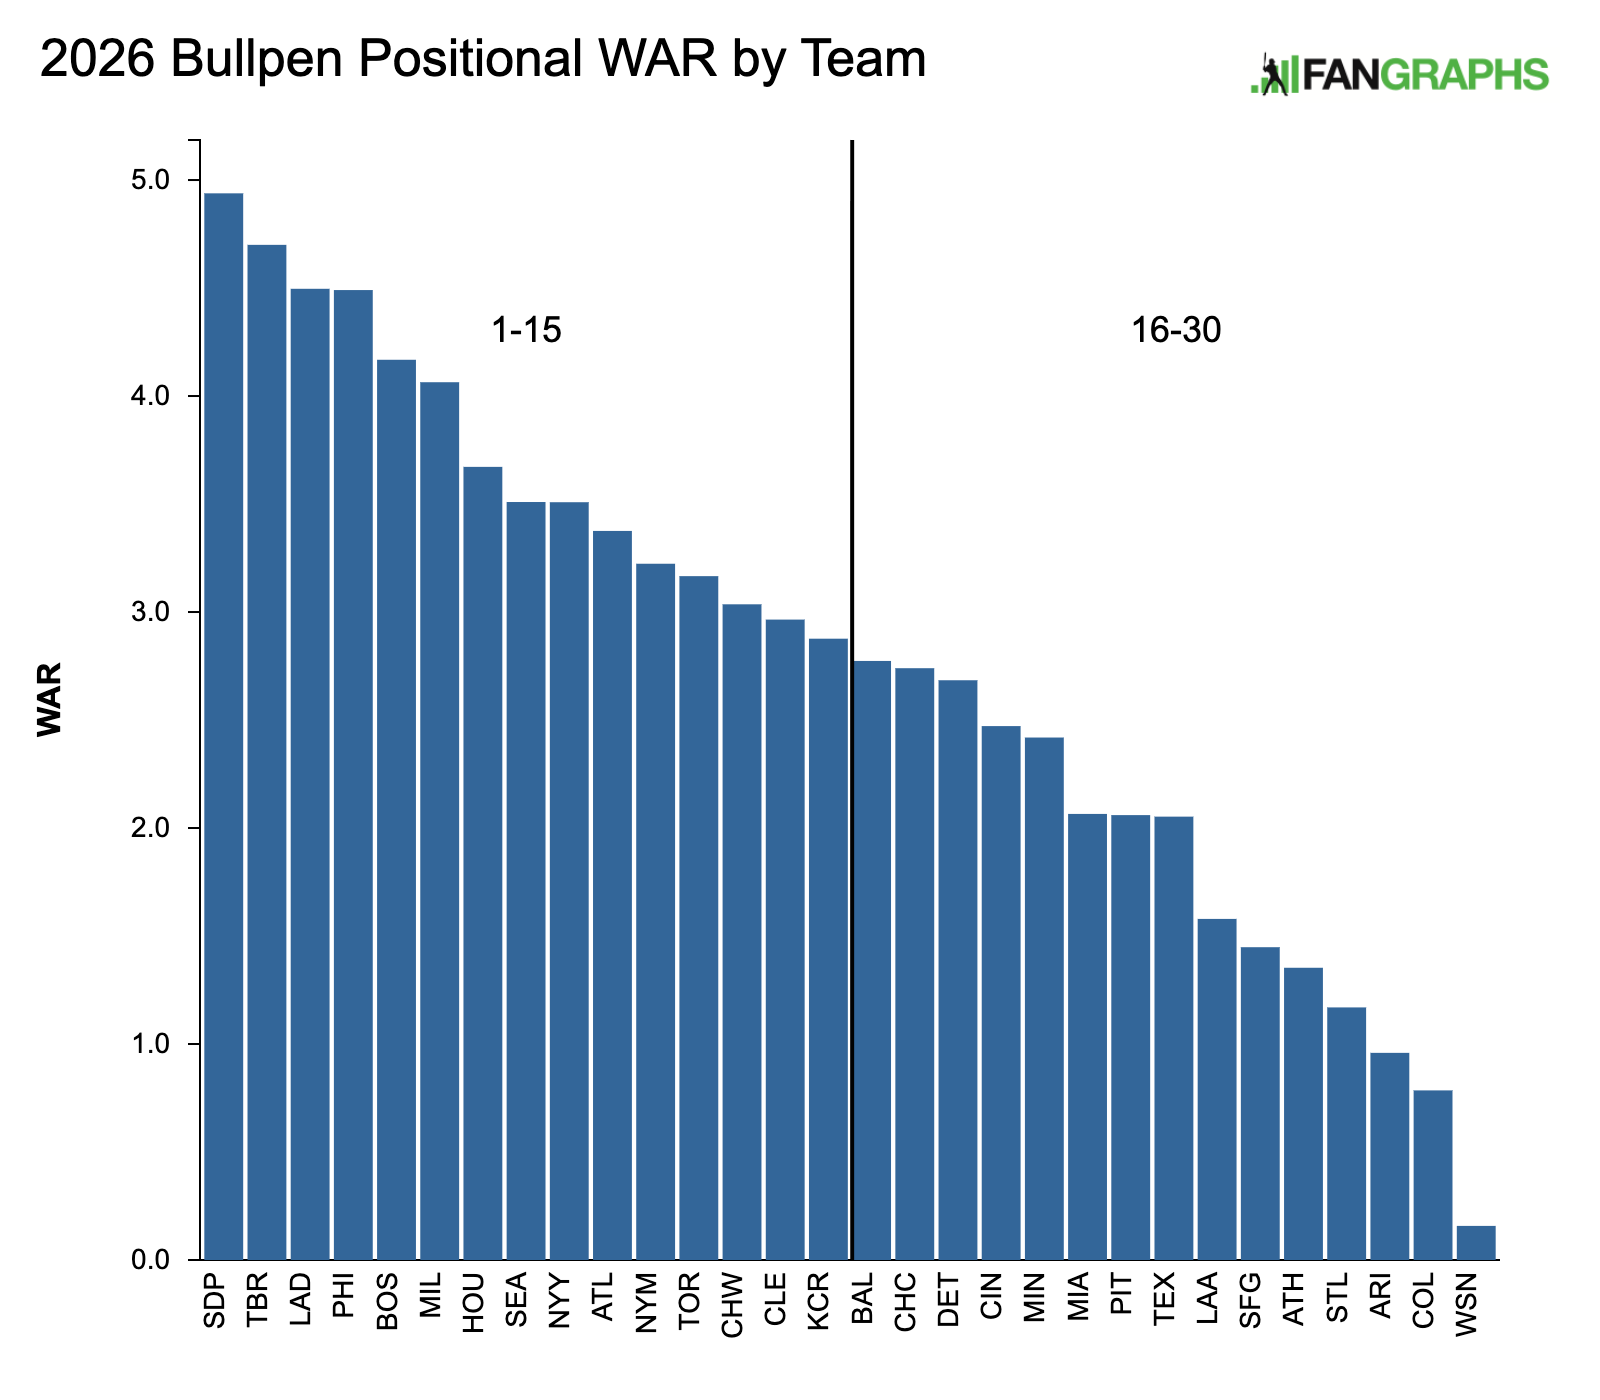
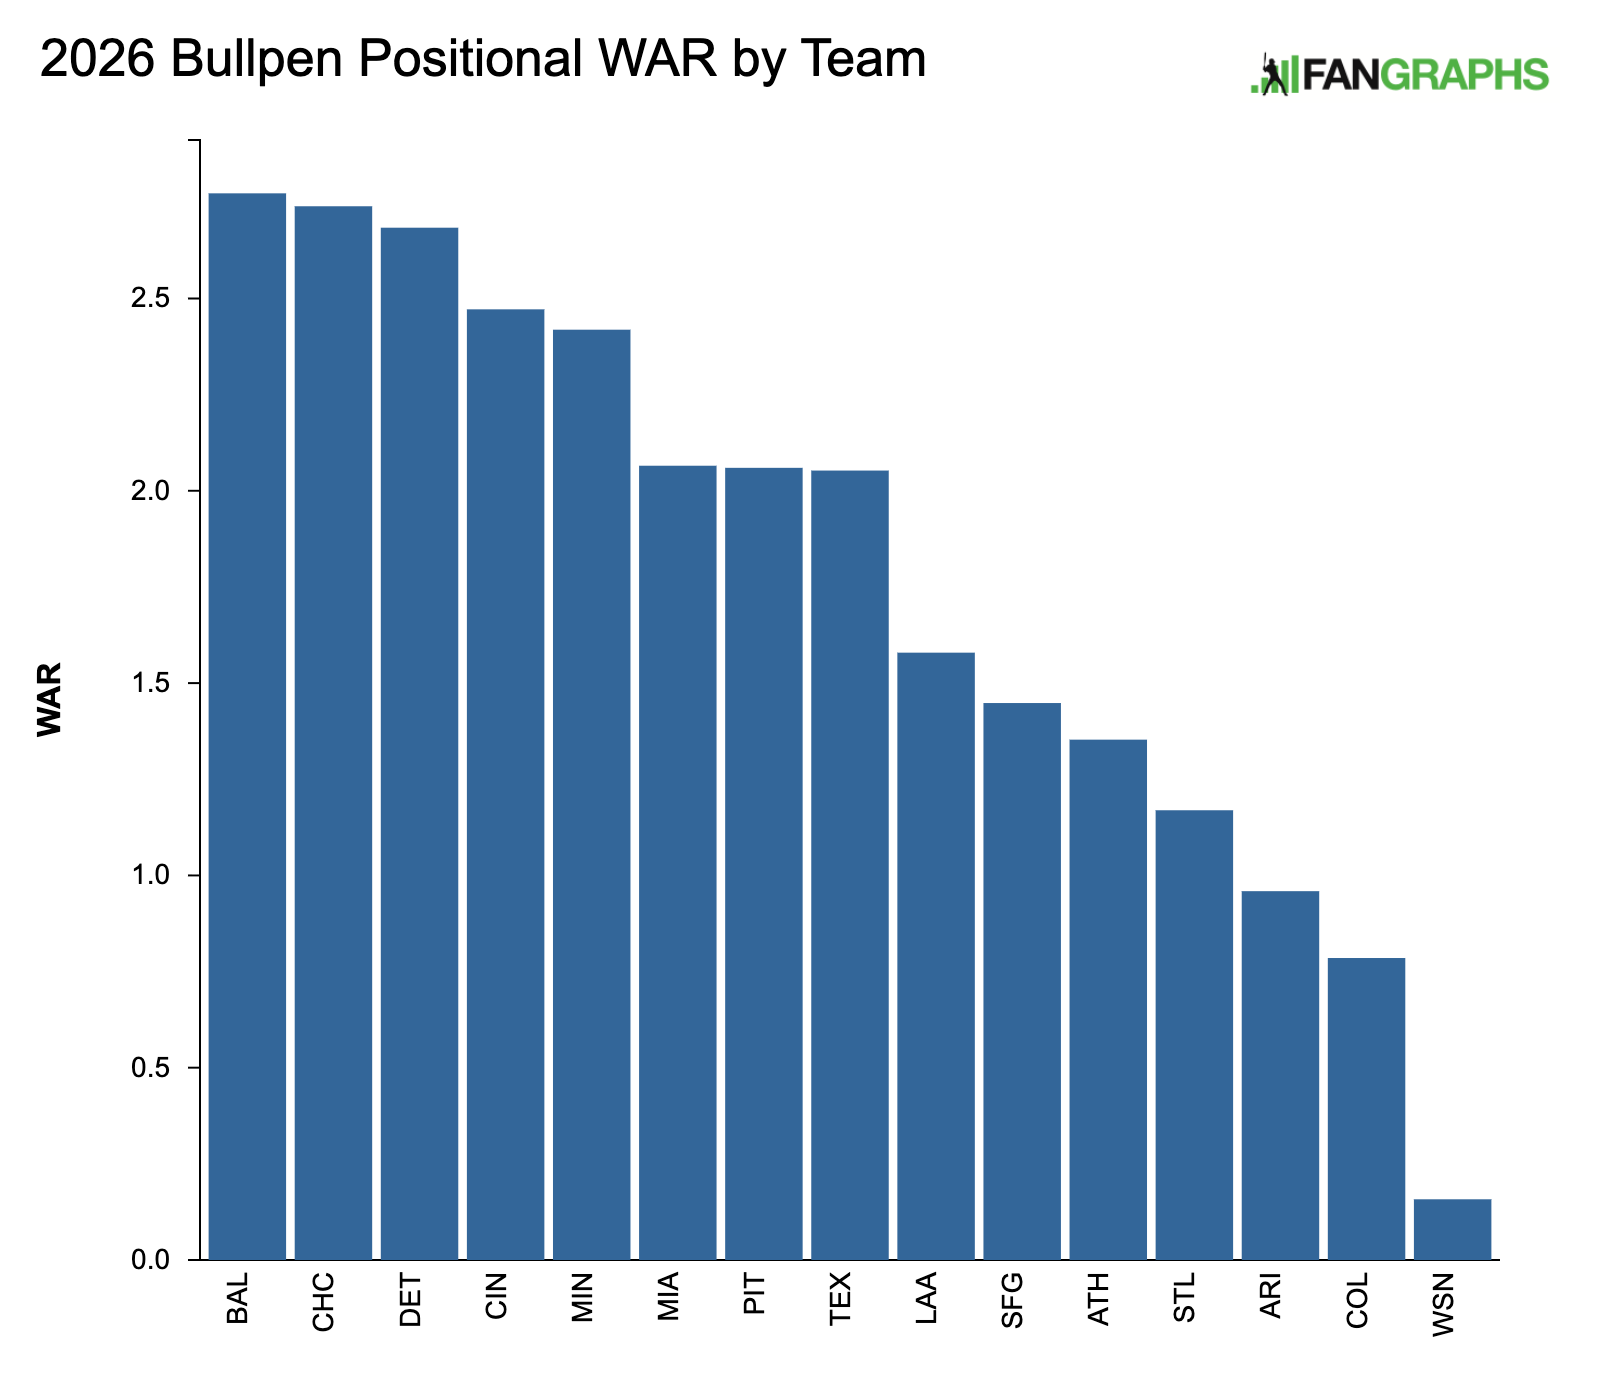
There are some positions for which a cleaner, wider gap exists between the top teams and the bottom, where we can more definitively say that some teams are better than others. For instance, the talent that the Dodgers and Astros have at DH separates their projections from the rest of baseball in a meaningful way. Relief pitching is not one of these positions. As you digest the forecasts and player details below, make sure to note how thin the margins tend to be from one team to the next. Also know that relief inning sample sizes are small enough that this is where WAR is the least good at properly calibrating impact and value, a dynamic heightened in the playoffs when the remaining bullpens are all turbocharged by the way the postseason schedule allows for rest, or for an elite starter to work an inning on his bullpen day. Things like coherent managerial usage, roster management, and good or bad health luck tend to play a huge role in the way bullpens perform throughout a season, and those are factors we can’t totally control for here. I felt free to point out the situations in which I think the projection is off base. Read the rest of this entry »
Cristopher Sánchez wasn’t going anywhere for awhile. He’s now not going anywhere for even longer. With Ranger Suarez in Boston, Zack Wheeler recovering from thoracic outlet surgery, and Aaron Nola looking his age, the 29-year-old left-hander is the ace of a Phillies starting rotation that led baseball in WAR in both 2025 and 2023 and hasn’t finished below fourth this decade. On Sunday, the Philadelphia signed Sánchez to a contract extension that will keep him around through the 2032 season, with a club option for 2033, when he’ll be 36. The move also comes less than two weeks after the team inked Jesús Luzardo to his own five-year, $135 million extension. Clearly, president of baseball operations Dave Dombrowski would like to maintain the status quo.
Robert Murray of FanSided broke the news of the deal. Matt Gelb of The Athletic reported that the contract is worth a guaranteed $107 million, and Francys Romero of Beisbol FR reported that it included more than $13 million in incentives. The club option for 2033, if it’s picked up, would add another $32.5 million. This may well sound familiar. In June 2024, the Phillies signed Sánchez to a four-year extension that contained two more club options for 2029 and 2030. Those first four years bought out all of his arbitration years for $22.5 million. If picked up, the two club options (along with Cy Young incentives) could have increased the maximum value to $56.6 million.
We’ll get back into the mechanics of the deal and what they mean soon. We’re not going to spend more than a few paragraphs on why the Phillies decided Sánchez was worth all this. That part should be obvious. Sánchez is quite simply one of the best pitchers in the world. He finished 10th in the National League Cy Young voting in 2024 and second in 2025. He has a career ERA of 3.24 and a FIP of 3.15. By any standard, the lefty found an entirely new level in 2025, running a career-high 26% strikeout rate. His 2.55 FIP was nearly half a run better than his previous career best, and his 63 DRA- was nearly 20 points lower than his previous best. Read the rest of this entry »
I love relievers. Sure, starters are the belles of the ball, making the big bucks and responsibly scaling back their velocity and throwing six pitches. They’ve got it all together. Not relievers. Relievers are freaky. They’ll throw it crazy-style. They’ll spam a million breaking balls. They’ll have 20-grade command, or an 85-mph fastball, or a pitch you’ve never seen in your entire life. They will burn bright and fast, and then you’ll never see them again.
These are not the best bullpens in baseball. In fact, they are the worst. But every single one has something fascinating going on inside of it. Usually, it’s more than one something. So come along with me on a journey into the deep, dark wilderness of baseball’s mediocre bullpens. This one is for the sickos. Read the rest of this entry »
During the championship game of the World Baseball Classic, a Nolan McLean sweeper made me jump off of my couch. It wasn’t even a strike; it just moved so much from such an innocuous starting point that I reacted instinctively. I clearly wasn’t alone; Davy Andrews wrote about how nasty McLean’s pitches look last week. “Dang,” I thought to myself after I’d calmed down. “It’s too bad someone hasn’t gotten PitchingBot to take a look at that one.”
Then I thought about that slightly longer and chuckled. That someone is me. PitchingBot lives in the cloud, but I have a duplicate copy isolated in a sandbox on my computer. MLB records Statcast data for WBC games. I have a machine that ingests Statcast data and turns it into pitch modeling grades. This wasn’t rocket science (give or take how you feel about the machine learning algorithms powering the model) – I took the data, fed it into the machine, and tinkered with the exact settings until I got model grades to come out.
The tournament features a wide variety of skill levels, from Paul Skenes down to semipros and high schoolers. Setting the population average equal to the average quality of WBC pitching would mean that the grades aren’t comparable to the ones we’re all used to looking at. Thus, I ran the PitchingBot model for every pitch in the WBC, but instead of using the WBC average to mean a 50 grade, I used the 2025 MLB average. That means the model is calibrated to how you’d expect the pitches thrown in the WBC to perform against average major league opposition. Read the rest of this entry »
Summary
The New York Mets are seeking an Applied AI Engineer to build and ship production-grade AI capabilities that improve decision-making and streamline workflows across Baseball Operations. This role sits at the intersection of Baseball Systems (software engineering), Data Engineering, Baseball Analytics, Performance Technology, and modern generative AI. You will develop reliable AI-powered applications such as retrieval-augmented generation (RAG), secure tool/data integrations (MCP-style patterns), and agentic workflows that can support deep work and research, while ensuring strong standards for quality, security, privacy, and operational excellence.
This is a hands-on role for an engineer who can translate ambiguous baseball operations and player development needs into working software, iterate quickly with stakeholders, and harden solutions into durable systems used daily by analysts, coaches, scouts, and baseball operations staff.
Note: This role will require extensive in-person collaboration and innovation alongside stakeholders, analysts, and engineers. Applicants must be local to NYC (or willing to relocate) and be able to travel to Citi Field regularly. Travel to Spring Training and affiliates may also be required.
Essential Duties & Responsibilities
Qualifications
he above information is intended to describe the general nature, type, and level of work to be performed. The information is not intended to be an exhaustive or complete list of all responsibilities, duties, and skills required for this position. Nothing in this job description restricts management’s right to assign or reassign duties and responsibilities to this job at any time. The individual selected may perform other related duties as assigned or requested.
The New York Mets value the unique qualities individuals with various backgrounds and experiences can offer the organization. Our continued success depends heavily on the quality of our workforce. The Organization is committed to providing employees with the opportunity to develop to their fullest potential.
Salary Range: $180,000 – $200,000
For technical reasons, we strongly advise to not use an .edu email address when applying. Thank you very much.
To Apply
To apply, please follow this link.
The content in this posting was created and provided solely by the New York Mets.
Trey Yesavage profiles as a strong Rookie of the Year candidate, but he won’t have a chance to begin building his case in the near term. The 22-year-old Toronto Blue Jays right-hander landed on the injured list due to shoulder impingement and won’t be ready when the season gets underway later this week. His return is expected to come sooner rather than later — fingers are crossed throughout Canada — but for now, Yesavage is on the shelf.
Five months ago he was turning heads in the World Series. With just six MLB outings under his belt — three in the regular season, and three across the ALDS and ALCS — Yesavage bedeviled LA batters with an array of high-riding heaters and diving splitters. He was especially dominant in Game 5, fanning a dozen Dodgers while allowing three baserunners and a lone run over seven frames.
His meteoric rise and eye-popping postseason performances raised his public persona, but the Pottstown, Pennsylvania native hasn’t otherwise changed since being drafted 22nd overall in 2024 out of East Carolina University. He’s still polite and unassuming, and his overpowering arsenal has remained in place.
“I’m pretty much the same dude,” Yesavage told me at Blue Jays camp last week. “The pitches are the same. The velocity and movement are the same. I also don’t look at [the metrics] all that much. Whenever Trackman is up on the board, all I really look at is the vert on my heater, and the velo. The only questions I’ll ask my pitching coach are to make sure that my most-used pitch is in line.”
That would be his four-seam fastball, which averaged 94.7 mph and 19.5 inches of induced vertical break across his smattering of regular season outings. Thrown at a 45.2% clip, the offering was augmenting by a slider (28.4%) and a splitter (26.4%), the last of those offerings being the righty’s most lethal weapon. A quintessential complement to his well-elevated heaters, Yesavage’s splitter induced a 57.1% whiff rate and a .111 BAA against big-league hitters.
He began tinkering with his signature pitch in the middle of his three collegiate seasons, but it wasn’t until his draft year that the efforts bore fruit. Read the rest of this entry »
It’s a great time to be a baseball fan. We just finished watching an exhilarating World Baseball Classic, which ended in a thrilling 3-2 Venezuela win over the United States, and we’re less than a week away from Opening Day. Part of the fun in the days leading up the start of the season is playing catchup with all the transactions that went down over the previous months. Sure, we all know that Kyle Tucker is a Dodger and Alex Bregman is a Cub, that Cody Bellinger returned to the Yankees and Pete Alonso joined the Orioles. We also don’t need to be told that Marcus Semien, Bo Bichette, and Luis Robert Jr. now play for the Mets, or that both Sonny Gray and Ranger Suarez slot in behind Garrett Crochet in the Red Sox rotation. But it can be hard to have a handle on how all these moves shape the outlook of teams across the league as we begin the season. The good news is that we at FanGraphs have been keeping tabs on everything throughout the offseason and spring training, so we’ve got you covered with everything you need to know about the coming year in baseball.
This week alone, we kicked off our annual Positional Power Rankings series, Dan Szymborski made his picks for the hitters who could boom and bust this season, and Ben Clemens looked into the importance of stars in the postseason. Michael Baumann analyzed the recent changes Walker Buehler has made as he looks to open the season in the Padres rotation, Ryan Blake examined the historically young White Sox catching tandem, and Brendan Gawlowski shared his latest notes from the Cactus League. Meanwhile, James Fegan ranked the top 30 prospects in the Astros system, and Eric Longenhagen reported on the experimental rule changes coming to the minor leagues this year. And if you haven’t read it yet, I encourage all of you to check out Davy Andrews’ excellent and revealing feature on the context of the recently installed Texas Ranger statue at Globe Life Field.
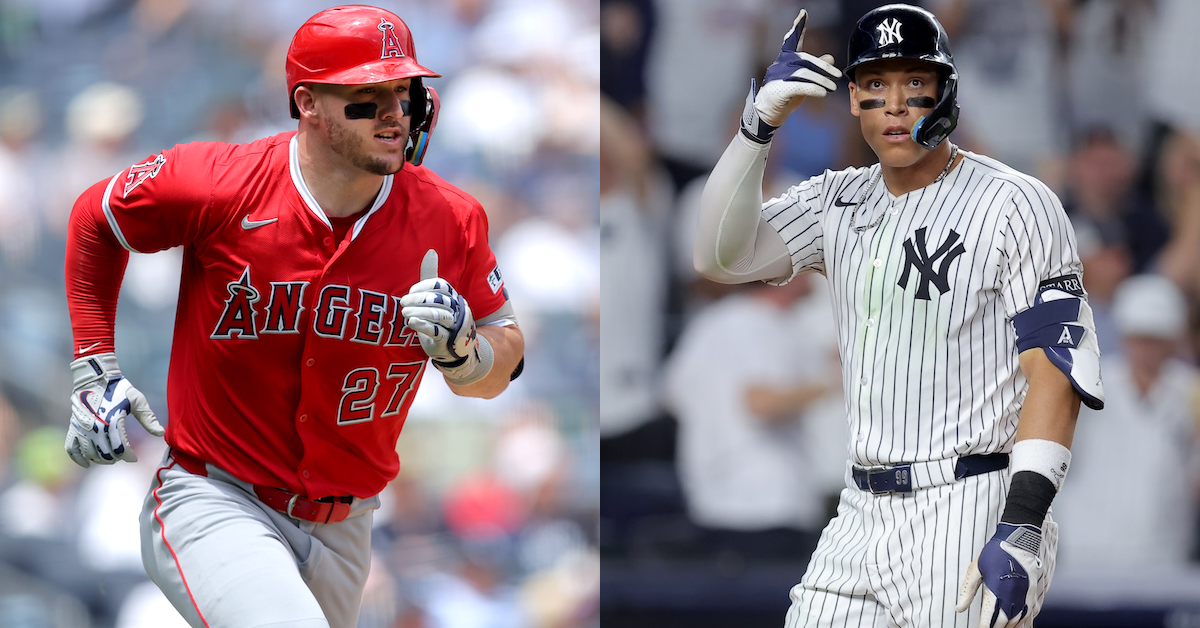
We won’t be talking about any of those topics in this week’s mailbag. Instead, we’ll answer your questions about whether Aaron Judge might finish with more career WAR than Mike Trout, where Juan Gonzalez’s 1996 season ranks among undeserving MVP wins, and which national soccer team would be the best at baseball. But first, I’d like to remind you that this mailbag is exclusive to FanGraphs Members. If you aren’t yet a Member and would like to keep reading, you can sign up for a Membership here. It’s the best way to both experience the site and support our staff, and it comes with a bunch of other great benefits. Also, if you’d like to ask a question for an upcoming mailbag, send me an email at mailbag@fangraphs.com. Read the rest of this entry »
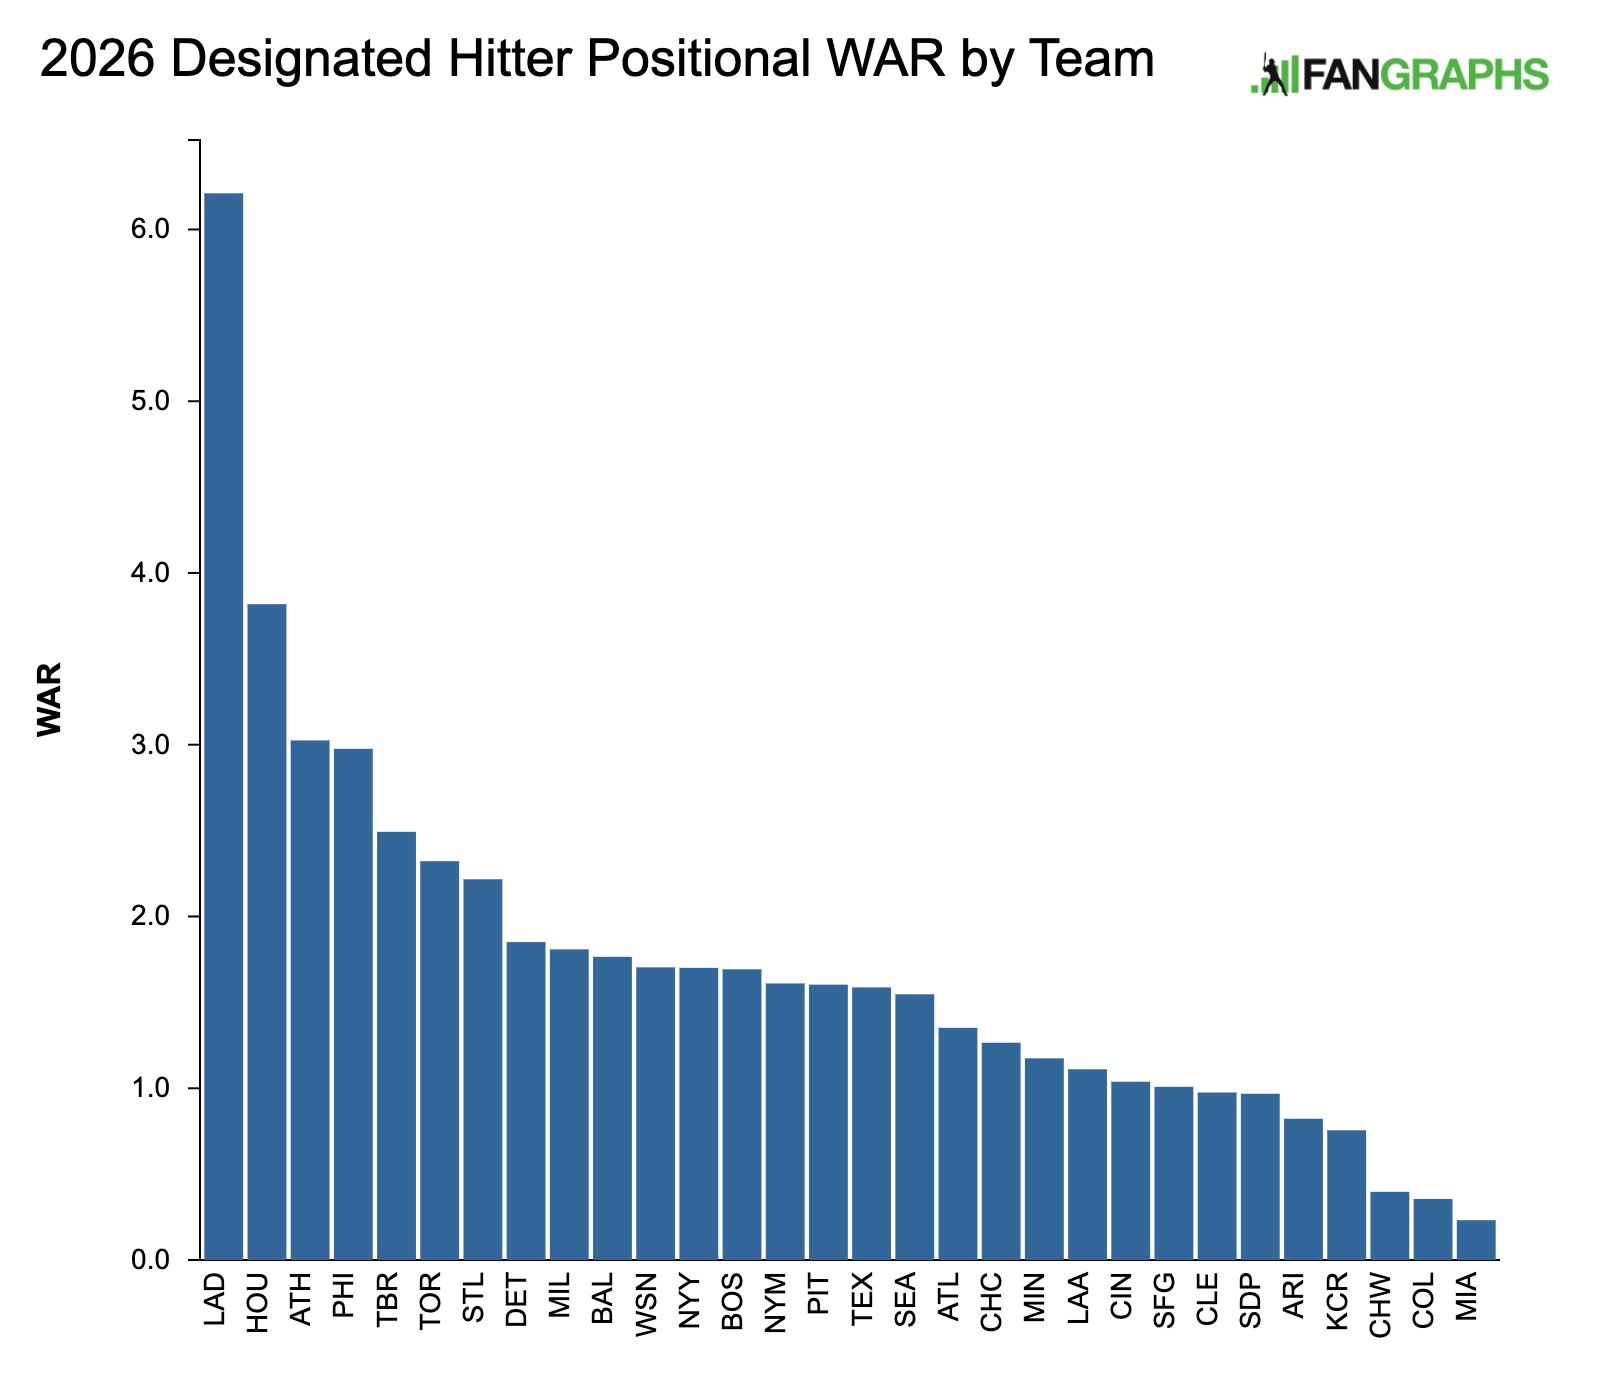
Sometimes, we fail to appreciate the vastness of the mysterious forces behind projections systems. The data speak to each other and sometimes combine in unexpected ways to form unexpected outcomes. Regarding the question of how to rank each team’s designated hitters, what you see here is based not only on projections about player performances but well-informed speculation about how each team will line up. Put it all into the kettle and, well, shock of shocks, there’s an unexpected upset at no. 1 on this list.
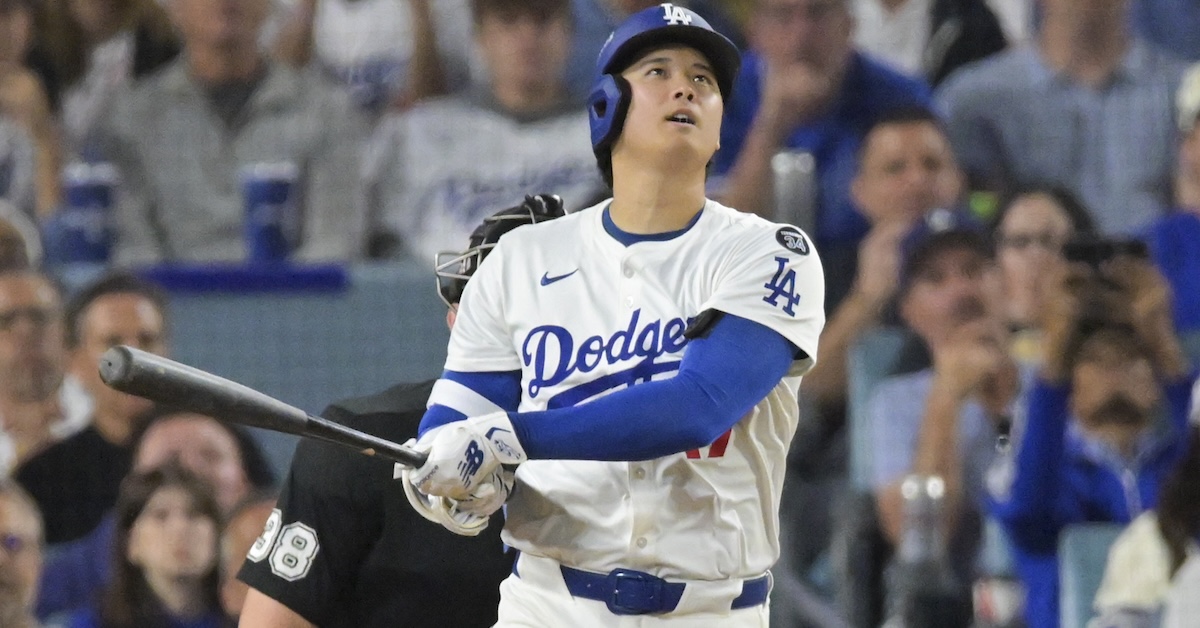
Actually, no, it’s Shohei Ohtani and the Dodgers again, by more than two wins. I don’t even know why I bothered setting up that gag, no one believed me, even for a second. Read the rest of this entry »
I love the spring training leaderboards. Anything can happen in spring training. Did you know that Trevor Story, who is 33 years old and has spent a significant portion of his adult life on the injured list, is tied for the spring lead with three triples? Story hasn’t hit a regular-season triple since he quit working at the triples factory knows as Coors Field, but here he is atop the leaderboard because it’s spring training. Did you know that Luis Matos leads the world with four hit-by-pitches? He’s been plunked just three times during the regular season, but here he is in spring training with an HBP rate higher than his career walk rate. None of this means anything, but that’s part of the fun.
Shea Langeliers and Matt McLain are tied at the top with six home runs. Langeliers is certainly not a surprise. He’s a genuine power hitter with 60 combined homers over the past two years. McLain’s got plenty of power, but only once before has he hit six in a span of 15 games. This is at the very least a notable outcome for him, and as I went down the leaderboard, I found some seriously surprising names. How does 33-year-old Ben Gamel, owner of 41 career homers in 723 career games, find himself tied for sixth in baseball with four spring-training homers in just 11 games? Today we’re hunting for players with even more extreme splits. We’re looking for guys who have hit more home runs in spring training than in the regular season. We’ve got spring stats going back to 2006, so I pulled them along with major league stats going back to the 1990s. Let’s find some guys who peak really early.
We need to ask our question more specifically, though, because plenty of players who didn’t stick in the majors (or who haven’t yet stuck in the majors) will have more plate appearances in spring training, and thus more home runs during spring training, than in the regular season. Bryce Brentz is the runaway leader in this category. Brentz was a power-hitting outfielder who played parts of the 2014 and 2016 seasons with the Red Sox. He launched 161 homers across 10 minor league seasons and another 12 across nine different spring trainings. But he only got into 34 major league games and hit just one home run. That’s a differential of 11 home runs! The top of the leaderboard is all players like Brentz who hit more homers during spring training because they played more during spring training. It’s great to recognize them, but it’s not quite what we’re asking. Read the rest of this entry »