Willians Astudillo and Shooting for History

Some of you might not realize that, if you hover over the search bar up there, you’ll see which player pages have recently been the most popular. Let’s give it a spin, shall we?

Willians Astudillo. Between Astudillo and Vlad, I don’t know which has been more popular, but I strongly suspect it’s the former, and it’s definitely the former among major-league players. People have been losing their minds over Astudillo of late. Now, I did write about him last week. Playing winter ball down in Venezuela, Astudillo has performed like a deserving MVP candidate. But also, there’s a clip that’s been making the rounds. Willians Astudillo hit a home run.

Read the rest of this entry »


Somebody Go Get Will Smith

The Giants don’t project to be a good baseball team in 2019. That doesn’t mean they won’t be a good baseball team in 2019, but the odds are against them. They’re unlikely to be as good as the Dodgers. They’re unlikely to be as good as the Rockies. They might’ve been passed by the Padres, and they might still be worse than the Diamondbacks. With a farm system that’s in similarly mediocre shape, something had to change, and indeed, the Giants are now under new management. Farhan Zaidi and the rest of his front office are in the process of figuring out their next steps.

Some form of rebuild or step back seems inevitable. And the player who’s drawn the most public attention is Madison Bumgarner, on account of his having become a household name. Bumgarner could be traded, but then again, there are certain incentives pushing the Giants to giving him a few months to build up his value. It would also be difficult for Zaidi to make dealing Bumgarner one of his first major decisions. Something that could and should happen sooner is a trade of Tony Watson, and/or a trade of Will Smith. Both of them are veteran lefty relievers. I’m here to advocate for Smith. He’s the one any contender should want to get.

Read the rest of this entry »


JAWS and the 2019 Hall of Fame Ballot: Loose Ends

The following article is part of Jay Jaffe’s ongoing look at the candidates on the BBWAA 2019 Hall of Fame ballot. For a detailed introduction to this year’s ballot, and other candidates in the series, use the tool above; an introduction to JAWS can be found here. For a tentative schedule and a chance to fill out a Hall of Fame ballot for our crowdsourcing project, see here. All WAR figures refer to the Baseball-Reference version unless otherwise indicated.

Over the course of delivering a novel’s worth of words, sentences, and paragraphs about this year’s Hall of Fame ballot, including revisions to 15 candidate profiles previously published at SI.com, inevitably, I’ve let various tidbits — some more pertinent to their cases than others — slip through the cracks. Sometimes, I learned new information about the player in question after those profiles’ publication, remembered something that slipped my mind, or decided that a tangent would lengthen an already-long piece. Other times, a reader or fellow writer called my attention to a detail that I’d missed.

In the interest of Getting It Right, I’ve been keeping notes on those things, and figured I’d share them in one catch-all post, which will serve the additional purpose of prompting me to include some of these items in the candidates’ respective profiles next time around.

Working alphabetically…

Barry Bonds

As anyone who follows Hall of Fame voting knows, ever since Bonds and Roger Clemens became eligible in 2013, both players have received far less support than their accomplishments would otherwise merit due to allegations connecting them to performance-enhancing drugs. While voters have treated the pair similarly, Clemens has received more votes than Bonds on every ballot thus far, by a margin ranging from one vote (2017) to eight (2013); last year, it was four. I’ve read and heard myriad explanations for that gap, ranging from race to longstanding sportswriter grudges to the perception that the drugs had a greater effect on the slugger’s career (insofar as they aided him in breaking the single-season and all-time home run records) to Bonds’ roundabout admission under oath that he used the drugs, pitted against Clemens’ vehement denials.

A recent Twitter conversation between colleague Dan Szymborski and ESPN’s T.J. Quinn offered an additional explanation that touches upon an issue I had failed to include in my writeup. In 2007, Quinn (then at the New York Daily News) broke the story that Bonds had failed an MLB-administered test for amphetamines during the 2006 season; Bonds initially blamed it on a substance taken from the locker of teammate Mark Sweeney. While amphetamines and other banned stimulants such as Adderall are considered PEDs under MLB’s drug policy — some of them are allowed for legitimate medical reasons, so long as a player gets a therapeutic use exemption (a possibility Bonds later explored) — a player is not publicly identified and suspended for stimulant use until a second offense (à la Miguel Tejada). A player testing positive for the first time is instead referred for treatment and counseling, and is subject to additional testing. Quinn reported that Bonds subsequently passed six tests in six months.

Thus, if Quinn’s reporting is correct — and there’s no reason to believe it is not, given his stellar track record — Bonds did actually fail an MLB-administered test, where Clemens (so far as we know) did not. For voters interested in splitting hairs, well, there’s one to split.

Todd Helton

At the recent Winter Meetings in Las Vegas, two writers who covered Helton during his career with the Rockies, MLB.com’s Thomas Harding and the Denver Post’s Patrick Saunders, offered a couple of notes regarding my profile, one concerning Helton’s brief college football career at the University of Tennessee — and specifically my assertion that he had won the starting job as a junior — and the other noting a potential trade later in his career that I had long forgotten about.

Entering the 1994 season, Helton’s junior year, Jerry Colquitt was Tennessee’s starting quarterback, succeeding the NFL-bound Heath Shuler. On the seventh play of the season-opening game at UCLA, Colquitt tore his left ACL. Helton, freshmen Peyton Manning, and Branndon Stewart all played QB during that game, as coach Phillip Fulmer tried to “get a competition started.” Helton rallied the Volunteers for 23 fourth-quarter points, but Tennessee lost, 25-23. He started Tennessee’s next three games (a win over Georgia, and losses to Florida and Mississippi State) but injured a knee in the last of those games and yielded to Manning, who took over the job and went on to fame and fortune. Helton likely would have stopped playing football after the season anyway to focus on baseball; he was chosen with the eighth overall pick by the Rockies the following spring.

As for that potential trade, in January 2007, the Rockies talked to the Red Sox about a possible deal that would have sent Helton — who had waived his no-trade clause and still had $90.1 million remaining on his $141.5 million contract — to Boston, with third baseman Mike Lowell, pitcher Julian Tavarez, and prospects heading to Colorado. The Red Sox did not want to include the two relief prospects the Rockies wanted in the deal, namely Craig Hansen and Manny Delcarmen, while Colorado didn’t want to include more than $36.1 million of Helton’s remaining salary. The talks broke down. Later that year, of course, the two teams met in the World Series.

Andruw Jones

It’s no secret that the foundation of Jones’ candidacy rests upon his defense. He won 10 consecutive Gold Gloves (1998-2007) and based on the combination of Total Zone and Defensive Runs Saved used at Baseball-Reference, his 235 fielding runs ranks first among all center fielders. Thanks to that glovework, he’s 11th in JAWS at the position.

Of course, there’s room to quibble when it comes to defensive metrics, particularly at the extremes. On the one hand, it’s worth noting that UZR values Jones’ defense more highly than DRS does; for the years 2003-2012, for which we have both metrics, his 111 UZR is well beyond his 66 DRS. One system, however, takes a very different view: RED (Runs Effectively Defended), a forerunner to other batted ball data-based metrics such as DRS and UZR that was created by Chris Dial. RED is not currently published anywhere (hopefully, that will change), but it is included among the alphabet soup of metrics in the SABR Defensive Index, which has accounted for 25% of the Gold Gloves voting since 2013.

“By every metric available in the late 1990s – Baseball Reference Total Zone, Michael Humphries’ DRA, and RED, which is based on STATS Zone Rating batted ball data — Andruw’s defense was outstanding,” wrote Dial in a data-heavy email to me (which he gave permission to share). In Dial’s assertion, Jones came back to the pack in the early 2000s, and fell below average defensively from 2003 onward, more or less. Here’s his table comparing the various metrics:

Andruw Jones’ Defensive Metrics, 1997-2008
Season Weight Speed RED TZ DRA UZR DRS SDI
1997 170 4.8 7.8 14.2 10.1 10.2
1998 170 7.5 22.2 35.3 41.0 30.9
1999 185 5.7 14.6 35.7 58.9 32.4
2000 185 6.2 1.4 25.0 30.6 15.8
2001 210 4.8 3.3 26.6 43.7 20.7
2002 210 3.1 -1.4 19.2 33.8 15.7 14.3
2003 210 3.6 -8.5 18.6 20.7 17.3 14.0 10.7
2004 210 3.8 -3.3 17.3 16.8 24.4 8.0 11.2
2005 210 3.5 0.7 18.5 -5.9 26.2 15.9 11.3
2006 210 3.1 -7.7 18.8 1.9 12.8 12.0 6.7
2007 210 3.8 -8.6 12.0 10.1 23.2 19.0 10.6
2008 210 2.9 -1.6 -7.5 1.7 0.3 -6.0 -2.7
Total 18.9 233.7 263.4 120.0 62.9 172.1
SOURCE: Chris Dial
SDI = SABR Defensive Index (weighted average of the included metrics: RED & DRS 25%, UZR 20%, TZ & DRA 15%). Speed = Bill James Speed Score; see https://library.fangraphs.com/offense/spd/
Weights via Topps baseball cards, “which are likely conservative,” according to Dial. “Their 2009 card lists him at 240 pounds, which is closer.”

Where the weighted SDI supports’ Jones’ claim on 10 Gold Gloves, Dial’s RED-driven view suggests he should have won only three (1997-1999). According to Dial, the other metrics, both before the arrival of batted ball data and after, aren’t sensitive to the way Jones’ fielding numbers are propped up by discretionary plays, routine ones where more than one player could have caught the ball. “Jones just took all the discretionary plays from the left fielder and continued to do so after he had lost his range. That’s not talent, it’s Kelly Leak,” referring to the ball-hogging star of the Bad News Bears. UZR and DRS “weight plays made by percentage for a position – when Andruw takes a discretionary play, he gets too much extra credit in those systems. Everything else tells us Andruw lost a step or three. His zone ratings (percentage of balls caught), his extra weight, his speed scores, his range factors. How the other metrics miss this, I cannot say.” Dial wrote. Another table:

Average fielding chances for Braves Outfielders
Postion Pre-Jones (1989-1993) Prime Jones (1997-2003) Old Jones (2004-2007)
Center field 477 481 462
Left field 361 290 348
Right field 378 368 356
SOURCE: Chris Dial

Dial has excluded the shortened 1994 and ’95 seasons as well as Jones’ cup-of-coffee 1996 season from the table. Note the big dip in left field chances for 1997-2003, which rebounds to a number on par with the right fielders’ total because, according to Dial, the older Jones could no longer get to as many balls, and also because the team upgraded from less capable left fielders such as Ryan Klesko (alongside Jones in 1997 and ’98) and Chipper Jones (2002 and ’03).

I’m not sure I buy that last part; if the discretionary plays disappeared, why are his 2004-2007 metrics via other systems still so strong? Nonetheless, Dial has provided a compelling alternative view that at the very least is in line with the voters’ general consensus regarding Jones, who has received just 8.0% from among the 162 ballots published thus far after getting 7.3% last year.

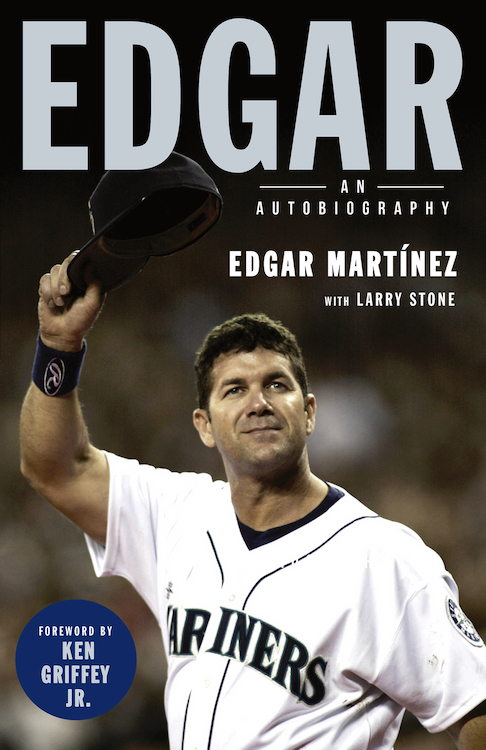
Edgar Martinez

Between Craig Biggio (74.8% in 2014), Jeff Bagwell (71.6% in 2016), Vladimir Guerrero (71.7% in 2017), Trevor Hoffman (74.0% in 2017) and Martinez (70.4% in 2018), we’ve had an unusually large number of near-misses in recent elections — players getting between 70 and 74.9% — and that’s not even counting Mike Piazza (69.9% in 2015) or Tim Raines (69.8% in 2016). Thus, I’ve often hauled out a bit of research that, as updated for Martinez’s 2019 profile, read like this: “Since 1966, 19 out of 20 candidates who received at least 70% of the vote and had eligibility remaining were elected the following year, with Jim Bunning the lone exception; he received 70.0% in 1987 (his 11th year), then 74.2% in 1988 before slipping to 63.3% in 1989. Ultimately, he was elected by the Veterans Committee…”

Left unexplained is exactly how Bunning missed out, and what caused him to fall further. To the first point, as it turns out, in 1988, nine voters — including Bill Madden and Phil Pepe of the New York Daily News, Moss Klein of the Newark Star-Ledger, and at least four other New York-area voters submitted blank ballots as a general protest against what they believed to be the erosion of Hall of Fame standards. “Maybe my standards are higher than most people,” Pepe said. “But I think the Hall of Fame is too crowded … I think to go in alongside Ruth, DiMaggio, Williams, Aaron, Cy Young, you have to be the cream of the cream.”

Had the blank ballots — which are counted in the total, and therefore each require three “yes” votes to offset for a candidate to maintain a 75% share — not come in, Bunning would have received 317 votes out of 418 (75.8%) instead of 317 out of 427 (74.2%). As for Bunning’s support plummeting the next year, to the point that he missed election by 53 votes, it probably owed something to the flood of strong first-time candidates. Both Johnny Bench (who received 96.4% of the vote) and Carl Yastrzemski (94.6%) were slam-dunk first-ballot guys, and some voters may have simply kept their ballots short, leaving off even 314-game winner Gaylord Perry, who had the next-highest share of the vote (68.0%). In head-to-head comparisons, Perry’s win and strikeout numbers dwarf Bunning’s, as do those of Ferguson Jenkins (52.3%); by the next year, the latter overtook Bunning in the voting as well.

Alas, I uncovered one tantalizing Bunning-related lead that turned out to be a dead end. In a 2011 Baseball Prospectus interview with current FanGraphs contributor David Laurila, BBWAA secretary-treasurer Jack O’Connell suggested that the Bunning-bumping blanks were in protest of the Veterans Committee election of catcher Rick Ferrell (the lowest-ranked Hall of Famer at the position according to JAWS). But since Ferrell’s oft-mocked election was in 1984, that theory appears farfetched.

Mike Mussina

Maybe it was because I’d already included a GIF from Rob Friedman (@PitchingNinja) showing Mussina’s knuckle curve in action that I chose to leave this one out, but more likely, I just plumb forgot.

Gotta love Joe Torre’s reaction. Given the score bug atop the GIF, a bit of Play Index sleuthing reveals that this encounter was from the ninth inning of Mussina’s May 31, 2006 start against the Tigers. Up 6-0, he allowed a two-out RBI single to Magglio Ordonez, who brought home Placido Polanco, who had reached on an Alex Rodriguez throwing error. Mussina finished the job by striking out Carlos Guillen, capping the last of his 57 career complete games.


Kiley McDaniel FanGraphs Chat – 1/9/19

12:21

Kiley McDaniel: Hello everyone! After a quick technical issues, we’re off and running

12:22

Kiley McDaniel: The weather is now solid in ATL and I might go outside and rake some leaves later. Red Sox list is finalized and Eric and I are writing up the capsules today

12:23

Harris: Very surprising to only see Matt Vierling in the honorable mentions on the Phillies list. Could he make his way on by mid season?

12:23

Kiley McDaniel: Most 5th rounders don’t make the list the summer after they sign. There’s some tools there, so if he performs again, he’ll be on there

12:23

Larry: What do you expect from Amed Rosario this year? O/U 2 WAR?

12:23

Kiley McDaniel: Over, still big tools and made some 2nd half progress

Read the rest of this entry »


A’s Revenue Sharing Money Heads Back to the Yankees

A lot of time and words are spent here and elsewhere on the split of baseball revenue between players and owners; we spend less time comparing revenue between franchises. Sure, we make distinctions between small-market teams and large-market teams, putting the Yankees and Red Sox in one corner and Cleveland, Kansas City, and Pittsburgh in another. But we don’t spend a lot of time talking about what that actually means. There are a few good reasons for that. One is that we don’t have access to much of the data that would make meaningful analysis possible. But I suspect the main reason is probably that fights between billionaires who don’t take the field aren’t that interesting to a lot of fans. Add in rising revenues and $50 million windfalls from MLBAM, and for some, exactly how much money owners have isn’t all that important when we just know that they have a lot.

Many fans don’t even care about the fight between millionaires and billionaires. That’s their prerogative, but it’s important to consider these things carefully. The latest CBA wasn’t just a loser for the players for the obvious reasons, those were multiple: a competitive balance tax that barely increased, tax penalties that get progressively worse, small minimum salary increases, no universal designated hitter, only minor changes to free agent compensation, no concessions when it comes arbitration, no additional roster spots, hard international spending limits, and no help at all for the minor leaguers. The CBA also hurt the players when it comes to revenue sharing.

Wendy Thurm’s post from 2012 does a good job explaining the system under the old CBA and it is worth revisiting, but in sum: Teams took 34% of their net local revenue (local revenue minus stadium expenses), pooled it together, and divvied it up equally among all the teams. This was the base plan, and as is probably obvious, teams like the Yankees paid more into the pool than they received as part of it. There was also a supplemental plan. A pool of 14% of total net local revenue is created, with revenue taken from big-market teams like the Yankees and Red Sox and given to small-market teams like Pittsburgh and Tampa Bay. The supplemental plan worked to take a greater percentage away from high-revenue teams like the Yankees, and give it in higher percentages to the small-market teams.

Here’a a hypothetical under the old system.

  • Total Local Net Revenue is $3 billion, averaging $100 million per team.
  • Yankees Local Net Revenue is $400 million
  • A’s Local Net Revenue is $50 million

Under the old system, 34% of the *total* local net revenue is $34 million per team. For the Yankees, 34% of their local net revenue is $136 million; they end up making a net payment to the pool of $102 million once their distribution is taken into account, bringing other clubs up to $34 million. For the A’s, 34% of local net revenue is around $17 million; they end up receiving around $17 million in revenue sharing from the pool. Under the supplemental plan, 14% of $3 billion is $420 million. The Yankees pay about a quarter of that total with the Red Sox, Dodgers, Cubs, and Mets paying another 50%, so the Yankees put another $105 million in the pool. The A’s receive around 8% of the supplemental pool, so they get another $34 million to up their total to around $51 million. The Yankees end up with $193 million in net local revenue minus revenue sharing and the A’s end up with $101 million in net local revenue plus revenue sharing. These numbers are meant to be illustrative and provide a rough example of how revenue sharing worked.

The current CBA is much simpler, with a single 48% pool divided equally so that the same percentage of revenue is shared, but it is distributed differently. It takes less money away from the richest teams by eliminating the supplemental pool. In the example above, every team gets $48 million from the pool. The Yankees 48% figure comes to $192 million, so that they pay in $144 million. The A’s 48% figure is $24 million, so they receive $24 million. In this scenario, the Yankees get to keep a lot more of their money and the A’s get less. While we don’t know what the actual numbers are, the A’s did receive more than $30 million in 2015 and 2016, and at one time expected their 2019 payment to be greater than $40 million. The A’s won’t be getting that $40 million, however, as they will receive just a fraction of that amount. Most of that $40 million will stay with the Yankees, Cubs, Red Sox, and Dodgers.

In the last CBA, which went from 2012-2016, MLB phased in restrictions on teams receiving revenue sharing payments. All teams started on equal footing, able to receive revenue sharing based solely on their local net revenue numbers. (The Marlins were treated slightly differently, essentially unable to collect in 2012 after refusing to spend any money prior to 2012, resulting in a threatened grievance by the players.) The CBA phased in restrictions so that larger-market teams could only collect a portion of the revenue sharing owed to them, and by the time the new CBA rolled around, none of the large-market teams were allowed to collect revenue sharing money if their revenue was low except for the A’s, who despite their famously spendthrift ways and decaying ballpark, signed a billion dollar local TV deal in 2009. They’re low-revenue due to their stadium issues, but not quite small-market. The A’s were given an exception under the previous CBA, so that the restrictions didn’t apply until the team got a new ballpark. The new CBA removed those restrictions and began phasing in reduced revenue sharing payments for the A’s. Per the CBA:

Notwithstanding the foregoing, the revenue sharing disqualification of the Oakland Athletics shall be phased in as follows: 25% disqualified in the 2017 Revenue Sharing Year; 50% disqualified in the 2018 Revenue Sharing Year; 75% disqualified in the 2019 Revenue Sharing Year; and fully disqualified in the 2020 and 2021 Revenue Sharing Years.

This means that if, for example, the A’s had received $40 million in revenue sharing in 2016, they would only have received $30 million in 2017, then $20 million last year, $10 million this year, and then would get nothing in 2020 and 2021. So who gets the A’s money? The teams paying into revenue sharing receive it, but there’s a catch: teams get more money if they don’t go over the competitive balance tax.

Let’s say the Yankees pay about 20% of the money in revenue sharing that goes to other teams. That means that for next season, they will receive $6 million more dollars than they would have because the A’s can’t receive revenue sharing. The Dodgers will get something less than that. The Cubs, too. The Red Sox will receive 75% of their potential share because they will have gone over the tax threshold two years in a row next season. In 2020 and 2021, the clubs stand to gain even more money. Even If the Yankees go above the tax threshold the next two seasons, they might end up holding on to around $15 million that would have gone to the A’s in the previous CBA. That money might make its way to players, but given the incentives here and the teams publicly stated desires to stay under the threshold, there’s cause to be skeptical.

The amounts we are dealing with aren’t huge sums, but they are an added benefit to keeping spending low despite having to pay significantly less in revenue sharing. These aren’t speculative amounts if some big market team have lower revenues. We know where Oakland will be the next few years. And it isn’t just Oakland that ends up with less money, though they certainly bear the brunt of the losses. All of the lowest-revenue, smaller-market teams are likely receiving less money from revenue sharing than they used to under prior CBAs. It’s not an excuse for Cleveland to cut payroll given the increases in national television money, but it is likely that the have-mores are taking a bigger piece of the revenue pie than the have-a-decent-amounts.

Ahead of the last round of CBA negotiations, I thought there would be a fight among the owners over revenue sharing. Likely because the players didn’t demand enough concessions, that fight never took place. Small-market teams were willing to take less revenue sharing because negotiations with the players were too easy, and national revenues from television deals and money from MLBAM were good enough at the time. It’s not a big part of the player loss in the last CBA, but it doesn’t help when the teams with more money refuse to spend it. Revenue sharing might not seem like an important issue for the players, but spreading money around might have yielded a bit more spending at the bottom of the league.


The 2019 Ken Phelps All-Star Team: Pitchers

Let’s continue the 2019 search for free talent with the pitching staff for the Ken Phelps All-Stars. The position players, split into two parts, can be found here and here.

Starting Pitcher 1: Justin Haley

A couple of years ago, David Laurila, in one of his fantastic Sunday notes columns, talked to Haley about his unique delivery.

Haley sets up on the third base side of the rubber, with his other foot straddling the rubber. With the ball in his glove raised in front of his face, he looks in for the sign with his pitching hand cocked at his waist, fingers dancing back and forth like Wyatt Earp ready to draw.

Haley is 27, right-handed, and despite being listed at 6-foot-5 and 220 pounds, is a relative soft-tosser with a fastball that struggles to top 90 mph consistently. Soft tossing, fastball-heavy righties aren’t exactly a hot commodity, and that explains why he’s yet to establish himself in the majors. If you remember him, it’s probably because he was a Rule 5 draft pick back in 2017; he spent all of 18 big league innings with the Twins before being shipped back to Boston. But there’s probably more here than you might think.

First of all, Haley has a very good curveball.

And Haley’s repertoire – slow fastball, curveball, and pinpoint command – is reminiscent of another big, soft-tossing righty who didn’t establish himself until his late 20s.

In fact, Haley actually led the International League in xFIP in 2018 (just ahead of Michael Kopech), finishing fourth in FIP, K-BB%, and K/BB, and with the eighth-best BB% in the league. Haley, in other words, had good command and missed bats (14th in the league in SwStr%) without really walking anybody, and that’s a really good combination.

Unfortunately for Haley, pitchers who can’t break a pane of glass with their fastballs aren’t often really prospects, despite his gaudy Triple-A numbers. As a result, Haley ended up signing with the KBO’s Samsung Lions this offseason. I wouldn’t be terribly surprised if he ended up coming back.

Starting pitcher 2: Drew Gagnon

After years of struggling to control his low-nineties fastball and power breaking balls, Gagnon quietly broke out last year in – of all places – Triple-A Las Vegas, where pitching prospects go to die. He’d always had the ability – see, for example, his Adam Wainwright-like curveball.

But Gagnon walked more than 8.5% of the hitters he faced at every minor league assignment he had between 2014 and 2017 (including three stops with double-digit walk rates), torpedoing his value. Picked up by the Mets before the 2018 season, the 28-year-old former third rounder walked far fewer batters in Las Vegas, giving out free passes to just 6.7% of the batters he faced, while still striking out more than a quarter of opponents. All of a sudden, Gagnon had a 19.2% K-BB% and a 3.88 K/BB, with the latter being the best figure of Gagnon’s career. As a result, Gagnon shot up the Triple-A leaderboards, finishing fourth among all Triple-A pitchers (IL and PCL) in K%, 14th in BB%, and second in K-BB%. The showing was enough to land a brief cameo in Flushing, during which he didn’t distinguish himself.

Still, Gagnon’s progress is such that it’s worth seeing if he has actually turned a corner. In real life, he’s probably best suited for a middle-relief slot, and if his gains are for real, he could probably help a bullpen-needy team like the Angels. For us, we’ll see if he can consolidate his gains in the rotation, where he made 27 starts last year at Triple-A. For what it’s worth, Steamer loves Gagnon, projecting a mid-3’s ERA and FIP and better than a strikeout per inning.

Starting Pitcher 3: Onelki Garcia

Garcia might be the single most fascinating player on this list. Not only is he left-handed and breathing, he was once a prized prospect in the Dodgers’ system, with a deep arsenal and bright future. This is what Mike Newman said about Garcia back in 2012:

Listed at six-foot-three, the big-bodied Garcia boasts a power arsenal. The Cuban pitcher’s deception comes from staying tall in his delivery with a high release point. . . . Garcia features a 91-93 mph fastball, only with more consistent sinking action. In this appearance, he was wild in the zone which kept Jackson hitters off-balance. . . . Garcia’s primary off-speed pitch was an 83-85 mph “slurve” with 1 to 7 break. The pitch is a swing-and-miss offering at present — Flashing plus when down in the zone. His changeup also flashes potential and supports a starter profile should Garcia’s durability return after a long layoff.

It didn’t work out, of course; Garcia battled injuries – a bone spur in his elbow, meniscus tears in both knees – which limited him to just 162 innings across four seasons between 2013 and 2016, but he still flashed the plus stuff that had made him such a blue-chip prospect. But by the time he returned to the mound for good in 2017 in the Royals’ system, his effectiveness had cratered due to increasing command issues and a diminished arsenal; a 5.04 ERA for the Royals’ Triple-A affiliate in 2017 and disastrous six innings for the varsity club sealed Garcia’s fate, and he spent 2018 in Japan.

But once again healthy, Garcia found himself in NPB, tossing 168.2 innings for the Chuinichi Dragons – more than he’d thrown between 2013 and 2016 combined – en route to a 2.99 ERA while limiting both homers and hard contact. His command remained an enigma, as he walked an unacceptably high 73 hitters against 132 strikeouts. But the tantalizing stuff returned, with Garcia making multiple no-hit bids over the course of the season.

The Hanshin Tigers signed Garcia this offseason, but it was just a one-year deal, as the lefty still wants a shot at the big leagues. If Garcia could get his walks under control, it will be fascinating to see if a major league team takes a chance on him next offseason.

Starting Pitcher 3: Jake Paulson

If there were an exact baseball opposite to Onelki Garcia, Paulson is probably it. Unlike the power lefty, Paulson makes his hay with a heavy sinking fastball that he uses to induce ground balls. The sinkerballer induced grounders at a rate of at least 52% every year in the minors, including two stops above 60%, and has yet to allow even thirty percent of balls in play against him to be hit in the air to the outfield. More intriguingly, Paulson may have a skill inducing pop-ups, with a double-digit IFFB% every year since 2016.

Paulson achieves soft contact with his sinker, a fastball with ridiculous movement. Movement like this:

We’ve seen sinkerballers be effective mid-rotation starters before – Justin Masterson, Jake Westbrook, and Chien-Ming Wang come to mind. And like Wang, some sinkerballers can be late bloomers. So why is Paulson in the minors? For one thing, being a sinkerballer means relying on your defense – and in the minors, that can be a risky proposition. In 2016, he posted a 6.40 ERA despite a 3.38 FIP and 3.59 xFIP, and, owing to all the ground balls not fielded by his defenders, his LOB% didn’t even eclipse 70% until this year. In other words, Paulson got ground balls and his infield just didn’t field them, making the righty look worse than he actually was.

On the other hand, though Paulson was dominant for the Indians’ Double-A affiliate this year, he was supposed to dominate there; after all, he is already 26. And his sinker produced fewer ground balls this year; while still above 50%, he was routinely running ground ball rates above 60% in Hi-A.

Still, what evidence we have suggests that Paulson is closer to the pitcher he was at Double-A in terms of true talent and results. Paulson has consistently shown he can get ground balls without walking people, and that makes him interesting. He’ll probably struggle against lefties like many sinkerballers do, but that doesn’t mean he isn’t big league material. Also interesting is that his two-seam/curveball combination and 6-foot-7 build are reminiscent of early-career Charlie Morton.

Starting Pitcher 4: Enderson Franco

Franco, 26, has gone from interesting prospect to enigma to forgotten. Way back in 2014, right after Franco had been picked up by Tampa Bay from Houston in the minor league Rule 5 draft, Kiley McDaniel wrote that the youngster “has impressed, likely fitting in pen due to below average curveball, but with a fastball that sits 92-95, hitting 96 mph and a solid average changeup.” Since then, Franco has pitched in the minors for the Rays, Marlins, and Braves, flashing the same stuff that made him touted in 2014 but without the results to match.

Until, that is, 2018, when Franco impressed in his first taste of Double-A. Across 127.2 innings, Franco struck out better than a batter per inning (23.7% of hitters overall), on the back of that fastball.

More notably, Franco kept his walk rate to a manageable if not amazing 7.7%, good for a K/BB rate better than three to one and a K-BB% of 16.1%. And Franco kept one trait which he’s showed at every level: despite being a fly ball pitcher – his ground ball rate hasn’t been even 45% since A-ball – he kept the ball in the park, giving up less than a homer per nine for the eighth straight year, and generated pop-ups at a rate of 18%, a feat he’s accomplished or bettered every year since 2012.

Missing bats and generating pop-ups is an intriguing skill set for a starter, and he’s shown that he can withstand a starter’s workload. Franco is also relatively young; though he’s been laboring in obscurity for the past few years, he just turned 26. It makes sense to use those mid-90s bullets in the big leagues and see what Franco can do.

Starting Pitcher 5: William Cuevas

Cuevas, 28, has pitched for the Red Sox, Marlins, and Tigers organizations, but has seen just 22.1 innings at the big league level. In the minors, he’s functioned as organizational depth and a veteran innings eater, bouncing between the rotation and the bullpen depending on what “real” prospects that team had. But being in the rotation seems to agree with Cuevas; he’s flashed the ability to miss a few bats and limit walks and hard contact.

Cuevas does not throw hard – his fastball barely breaks 90 mph – but he features a cutter, sinker, changeup, and slider, and he’s shown an uncanny ability to paint the corners for strikes.

So what are Cuevas’ strengths? He generates weak contact, especially pop-ups; his IFFB% was a whopping 34.8% this year at Triple-A, and has never been below 17% at any level where he threw more than five innings. He has that fastball that he can run and sink. He’s not an ace, and probably never will be more than a depth starter. But he deserves a spot on a big league roster after the Red Sox released him this offseason, even if it’s as a middle reliever.

Relief Pitcher 1: Victor Payano

Victor Payano is a lefty with electric stuff. He can do this:

And then he can come back and do this:

Oh, by the way, that was his 13th strikeout of the night. In 2017, in the Marlins’ system, Payano struck out 38.2% of hitters he faced at Double-A (14.92 K/9), and 26.7% of hitters he faced at Triple-A (10.08 K/9). In 2018 in the Reds’ system, Payano struck out 32.1% of all hitters he faced at Double-A (12.66 K/9). Since 2016, at four minor league stops, his batting average against has looked like this: .175, .156, .197, .198. In other words, Payano is a strikeout machine who doesn’t give up hits.

So why is the big 6-foot-5 lefty still in the minors at 26? Because most nights, he really has no clue where the ball is going, and never has. In 2016, he walked 14% of hitters. In 2017 at Double-A, he walked 18.2% of hitters. In 2017 at Triple-A, he walked 14.5% of hitters. And in 2018 at Double-A, he walked 16.4% of hitters. Payano doesn’t give up hits and his swinging strike rate is fantastic, but he walks the world while he’s doing it.

The Marlins and Reds have spent the last couple of years bouncing him between the rotation and bullpen, but we’re going to put him in the bullpen full-time. We can do worse as a lefty specialist, and he may very well grow into more. Payano might be a left-handed Dellin Betances – he’ll always fight his mechanics and he’ll never have good command, but when you’re striking out 35% of the batters you’re facing, that becomes less important. At least you can guarantee he’ll never be a comfortable at-bat.

Reliever 2: D.J. Johnson

Johnson has a classic reliever’s profile: a high-octane, mid-90s fastball and a power breaking ball. He misses bats, striking out 35.7% of all hitters he faced this year for Triple-A Albuquerque and a third of all hitters he faced during a brief 6-inning cup of coffee with the Rockies. But like many relievers with this profile, he’s on this list because of longstanding struggles with control, walking more than 10% of all hitters he faced at Double-A between 2015 and 2016.

Quietly, though, Johnson flipped the script as Albuquerque’s closer last year. He walked just 6.4% of hitters he faced across 55.1 innings for the Isotopes, and appeared, at least, to keep those gains in his tiny big league cameo. He was also effective despite an altitude and PCL-driven .390 BABIP in 2018; the newfound lack of walks meant all those extra hits didn’t hurt him as much.

Johnson is another pitcher who generates lots of popups off of his fastball, and weak flyballs and swinging strikes are a good combination for a reliever. If Johnson’s command gains are real, he could have closer potential. If not, he’s still too good of a pitcher to be striking out minor leaguers by the bushel. He’s a perfect fit for the new era of power-driven bullpens.

Reliever 3: Brendan McCurry

If McCurry’s name is familiar, that’s because the Athletics traded him to the Astros for Jed Lowrie a few years back. At the time, Chris Mitchell took a look at McCurry and said this:

An undersized reliever, McCurry fell all the way to the 22nd round in 2014’s amateur draft, but his minor league performance has since lifted him to fringe prospect status. McCurry worked in relief at High-A and Double-A last season, where he pitched exceptionally well. He struck out 32% of his batters faced last season, and finished up with a 2.44 ERA.

McCurry’s numbers are excellent, but plenty of minor league relievers put up excellent numbers, especially in the lower levels. Throw in that he’s nearly 24, and he’s about as fringy as they come.

The thing is that nobody told McCurry that he was so fringy. Despite a relatively small stature – just 5-foot-10 and 170 pounds – the 26-year-old righty has spent the last three years obliterating minor league hitters. He’s yet to strike out fewer than 23% of all hitters he’s faced at any level, and he’s been above 26% the last two years. Each of the last two years, he’s posted a K-BB% of 20% or better and a K/BB of better than 4. Even in this extremely bad video, you can see the kind of off-balance swings he generates.

The Astros’ bullpen has no room for McCurry right now, but if Brad Peacock or Colin McHugh end up in the rotation, suddenly there might be room for a power reliever, regardless of size. McCurry is big-league ready and probably better than several members of the Angels’ and Orioles’ bullpens right now. It simply remains to be seen if he’ll get an opportunity, but we’ll make sure he gets one with us.

Relief Pitcher 4: Joe Broussard

Broussard, at least, looks the part of a late-inning reliever in the Dodgers’ organization; squint, and you might think you’re seeing Jonathan Broxton. But Broussard yet to see the mound for the big club, even after dominating the upper minors and leading some Dodgers fans to clamor for a call-up for the big righty. Broussard hasn’t struck out less than a batter per inning since A-ball; in 2018, he whiffed 26% of hitters he faced for the second year in a row and posted a K-BB% of 18% for the second year in a row, all in the hitter-friendly Pacific Coast League. In Double-A, he was even better, striking out nearly a third of all hitters with a K/BB better than 4 with a nasty fastball-curveball combination.

Broussard is buried by the Dodgers’ deep bullpen, but the big righty is ready for the Show.

Next time, we’ll project how this team might actually do if assembled.


Effectively Wild Episode 1319: Scott, Bore Us

EWFI
Ben Lindbergh and Jeff Sullivan banter about Oliver Drake‘s new (and also old) team, the Mets, Brodie Van Wagenen, and Keon Broxton, the Yankees signing Zach Britton, how data and technology have helped some free agents and hurt others, the state of free-agent spending and baseball’s economic past, present, and future, Scott Boras’s latest linguistic crime, the White Sox acquiring the friends and family of Manny Machado, Jonny Gomes getting hired as an unlikely coach, and Willians Astudillo’s winter league playoff performance, then answer listener emails about choosing which way to run the bases, televising winter leagues, scoring on defense, and the worst things for players to be the best at, plus a Stat Blast about the least and most consistent team winning percentages.

Audio intro: Nat King Cole, "Thou Swell"
Audio outro: Neil Young, "Sample and Hold"

Link to Drake interview
Link to Jeff’s post on Britton
Link to dolphin story
Link to Sam on Harrison’s pickle powers
Link to Ben’s article on the FA market

 iTunes Feed (Please rate and review us!)
 Sponsor Us on Patreon
 Facebook Group
 Effectively Wild Wiki
 Twitter Account
 Get Our Merch!
 Email Us: podcast@fangraphs.com


By the Way, Jose Alvarado Was Impossible

Let me explain how I landed on Jose Alvarado. Alvarado is a reliever for the Rays. I actually wrote about him last June, but not because of his pitching.

Right. So why Alvarado, on today of all days? It’s not like he’s been showing up in trade rumors. Here’s the explanation: I’m a guy who loves looking at bullpens. I was also looking at the Twins last night, considering them as a possible sleeper. One guy they should be getting back is Michael Pineda. Another guy they already got back is Trevor May. May is going to pitch out of the Minnesota bullpen, and when he returned in 2018, he put up some encouraging numbers. I went into the leaderboards, to see how his numbers stacked up. That’s where I came across Alvarado. That’s what prompted all of this work.

Almost completely off the radar, Alvarado broke out late in the season. There’s no need to be complicated here. This is a very simple table:

2018, August and September
Pitcher K%
Corey Knebel 48.0%
Jose Alvarado 46.7%
Edwin Diaz 46.3%
Kirby Yates 44.6%
Josh Hader 41.1%
Ryan Pressly 40.8%
Dellin Betances 39.6%
Justin Verlander 39.2%
Blake Snell 38.5%
Brad Hand 37.1%
minimum 20 innings

That’s a list of some talented pitchers. Down the stretch, Alvarado struck out almost literally half of his opponents. He struck out the same rate of opponents as Edwin Diaz. I’ve written before about Ryan Pressly’s breakout. I’ve written before about Jose Leclerc’s breakout. What happened with Alvarado? Did anything happen with Alvarado? The answer is yes. He changed on the fly, and became something dominant.

Read the rest of this entry »


The Missing Free Agents

This year’s free agent class was supposed to be historic, but with Clayton Kershaw pitching only really well, Josh Donaldson and Andrew Miller hurt, David Price and Jason Heyward not performing well enough to opt out of their deals, and Matt Harvey taking a nosedive, this class only turned out to be pretty good. Manny Machado and Bryce Harper are two superstars hitting free agency in their mid-20s. Having one of the two would make for a great headliner; signing both would provide multiple teams with the opportunity to transform their franchise. After those two, we’ve seen starting pitchers do pretty well so far, and a bunch of relievers sign solid deals, but the talk of a slow offseason has returned.

Some of last winter’s slowness was mitigated by star players receiving contracts close to expectations. Yu Darvish, Eric Hosmer, J.D. Martinez, and Lorenzo Cain all signed deals that seemed fair as spring approached. Jake Arrieta didn’t come that far off when we consider his opt-out. Machado and Harper are still likely to sign very big contracts, while some in the middle might end up getting squeezed. But with this free agent class the supposed justification for teams saving their money on the heels of MLB payrolls going down despite soaring revenues, another slow winter is cause for concern for the players.

In examining the slow market, Ken Rosenthal recently called the system broken and floated some differing perspectives on the causes, effects, and solutions. One paragraph, in particular, caught my eye. Read the rest of this entry »


Meg Rowley FanGraphs Chat – 1/8/19

2:00
Meg Rowley: Hello everyone, and welcome to my first chat of 2019.

2:00
Meg Rowley: Happy New Year to all!

2:00
Jim: What will the White Sox get from Boston for Kelvin Herrera in 2 weeks?

2:01
Meg Rowley: I don’t think it’ll be that quick of a move, but barring a bevy of other signings, I wouldn’t expect him to be in a White Sox uniform come the end of July if he’s at all decent.

2:01
Meg Rowley: (prepares to see immediate trade news break)

2:01
Wade: Hi Meg, can something please happen

Read the rest of this entry »