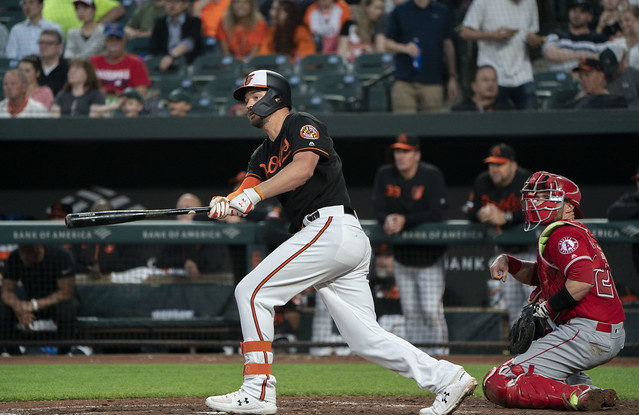
Trey Mancini’s rebound was one of the few highlights in a grim, if still productive, Orioles season. (Photo:
Keith Allison)
“Continuous improvement is better than delayed perfection.” – Mark Twain
While you may have thought that the Orioles were officially eliminated sometime back in February, they actually lasted five months dangling in the aether between the realities of implausibility and impossibility. The Orioles don’t have as strong a claim to being the worst team in baseball as the Tigers do, given that the O’s had an easier path to their tragic number thanks to a division with two of the best teams in baseball and last year’s World Series winner. Camden Yards hosted a terrible team in 2019, but that’s alright and perhaps even a bit awesome.
The Setup
For the Orioles, there were no delusions about what 2019 would bring. While many teams should be faulted for not spending last winter, keeping their wallet shut as if they were method-acting in a local production of A Christmas Carol, the Orioles don’t bear that blame. In this case, there really was no reason to spend money. This wasn’t a team with any 2019 upside; the best thing that could have happened in Baltimore would have been Chris Davis retiring to be a professional juggler, medicine-show salesman, or Fortnite streamer. But short of that or another winter miracle, the O’s were going to fly the L flag frequently.
If someone in the organization had appointed me benevolent dictator of the team, I probably would have traded Mychal Givens in the offseason, given the rather short shelf life of non-Mariano relief pitchers. The Orioles either chose to go a different way or simply felt that the offers they received weren’t tempting enough. The team’s approach wasn’t necessarily wrong; Givens wasn’t predestined to struggle in the early months of 2019, and given that he’s not a free agent until after the 2021 season, the O’s will have other opportunities to trade him, perhaps during or after a stronger 2020.
In the end, there weren’t really that many big picture moves to make over the winter, as the team had already traded off most of their veterans with any kind of significant value. Trey Mancini and Andrew Cashner didn’t have much trade value going into last offseason; Mancini had a rather lousy 2018 season and Cashner was apparently only really fit for a team looking for guys who could pass as extras in a Civil War film.
Without much to trade or much reason to spend, Baltimore had a busy waiver and minor-league signing year, picking up some players in the Rule 5 draft, some catchers so that every pitch didn’t go right to the backstop, and frightening me with the signing of Alcides Escobar to a minor-league contract. None of the prospects the O’s acquired were obviously pushing for major league jobs in 2019 and it was too soon in the rebuilding process for them to have developed a stable of interesting fringe prospects to play with, so the team went with whatever mildly fascinating player they could dig up for free, and gave them every chance to stick in the lineup.
The Projection
Like every other projection system, analyst, beat writer, fan, or person foggily aware of the existence of baseball who hadn’t just gotten back from a sojourn in Brigadoon, ZiPS did not think the 2019 Orioles were going to be a particularly good baseball team. The amusing thing is that the bleak projection, a 59-103 record and playoff odds in the one-in-thousands, was actually significantly better than 2018’s final record. ZiPS projected a 12-game improvement in 2019, one of the largest bumps in the majors. Rather than hope, this was really just Bill James’s Plexiglass Principle in action, as the O’s weren’t just a lousy team in 2018 but a rather unfortunate one as well.
The Orioles had two jobs in 2019: find out useful baseball things about the various players who fell into the organization over the winter, and keep fan morale high enough to at least outdraw the Miami Marlins.
The Results
The Orioles allow home runs. I’d say all the home runs, but Dan Straily couldn’t pitch 1400 innings this season. The team made their bid for statistical infamy by setting the record for most home runs ever allowed by a pitching staff, accomplishing the feat with six weeks remaining in the season, but is that really so bad? Baseball is a nostalgic game, and the grossly inept seem to be remembered in the same treacly sepia tones as the greats. The 1962 Mets were a dreadful team that lost a ton of games, with a roster mainly consisting of The Wrong Frank Thomas, old Richie Ashburn, and the first two dozen fans to show up when they opened the gates in the season debut. What they weren’t is forgotten, and losers in baseball tend to be lovable when the memories of them don’t fade. How much did the Cubs wring out of not being able to win the World Series for over a century? If you’re going to be lousy, be amazing at it. Don’t be like the 90s Royals, who were actually trying and failing.
More importantly, the O’s did use the season to find out things about their players. They resisted doing anything that would obviously stand in the way of that exercise; Alcides Escobar didn’t make the team, and the organization resisted the bad idea of bringing back Adam Jones after he failed to sign a contract. Baltimore played pretty much all of their halfway-interesting role players to assess what they could do to help the team in the next four to eight years. And while they didn’t find any actual stars, they did find players who have some utility to a future team. Hanser Alberto, who had a near-.800 OPS for Triple-A Round Rock in 2018, showed tremendous versatility and a hit tool good enough to perhaps be Homer Bush for a while. John Means ought to be at least an innings-eater for the next six years, and a total of 16 pitchers have gotten starts for Baltimore this season. Mancini has shown he is more the 2017 version of himself than the 2018 one, and Chris Davis is conclusively not having a bounce back. The catching situation is likely tolerable already, unlike most of the rest of the team, and will get better thanks to a certain draft pick.
The farm system’s improvement continued; the organization’s ranking has jumped to 12th THE BOARD. That’s not Padres, Rays, or Dodgers territory, but the team entered the season ranked 26th, and while McDongenhagen didn’t explicitly rank the farm systems in the preceding years, the team’s system was…worse. They now have 11 players with a 45 FV or better and while we haven’t seen big power from No. 1 pick Adley Rutschman yet, he’s about as highly polished a hitter as you’ll find in the low minors.
The Baltimore Orioles are in a much better position than they were a year ago and a phenomenally improved one from 18 months ago. They know more about the players in the system, they’re developing talent, and while attendance is hardly promising, at least there aren’t dumpsters full of Boog’s pit beef hanging around on Russell St.
What Comes Next?
This was never going to be an easy rebuild, with the team opting not to retool before the situation became dire, something that helped the Brewers make a quick turnaround a couple of years ago. This was a total, full-on, tear-down-the-entire-termite-infested-house project, completely new construction on a barren plot of land. I’m still hopeful they trade Jonathan Villar this winter, as the team’s roster is filling out enough that they don’t need Villar quite as much to complete a roster card. It’s also time to release Chris Davis. The money is gone, and it’s much better to pay Davis not to play baseball for your team than to pay him an identical sum to be on the roster.
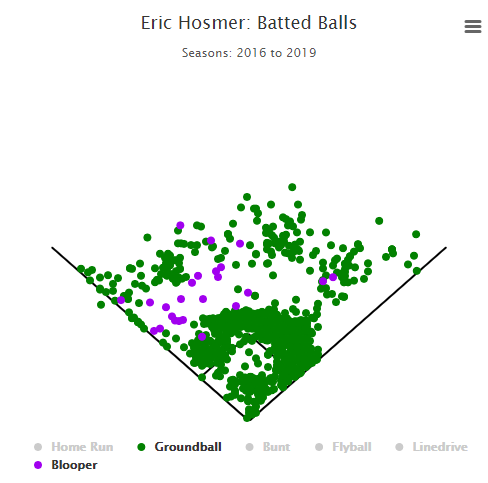
While I’m hopeful the Mike Elias/Sig Mejdal braintrust would avoid such a signing anyway, I’m crossing my fingers that the Orioles losing in the latest MASN drama will keep them from getting any bright ideas about an Eric Hosmer-esque signing to “jumpstart” the competitive cycle. The team still isn’t close and they once again need to look for lottery tickets; the odds are long but it’s infinitely better to have tickets for tomorrow’s lottery than losing tickets from yesterday’s.
There was a bit of a bloodbath in the scouting department this past week, but I think people overreacted to the news. The team isn’t banning scouting — even the most saber-friendly teams spend a ton on scouting — but the front office almost certainly wants scouts who speak the same language they do. From scouting to player development to (hopefully) eventual promotion to the majors, there’s a lot of non-statistical information that needs to be conveyed and it helps if everyone’s speaking the same language. There has been a lot written in the local press about the years of expertise lost, but when it comes down to it, that expertise didn’t prevent the Orioles from having one of basebll’s worst farm systems for years. Think of it as the scouting equivalent of the Moneyball movie quote: If he’s a good hitter, why doesn’t he hit good?
The Absitively, Posilutely, Way-Too-Early ZiPS Projection – Trey Mancini
ZiPS Projection – Trey Mancini
| Year |
BA |
OBP |
SLG |
AB |
R |
H |
2B |
3B |
HR |
RBI |
BB |
SO |
SB |
OPS+ |
DR |
WAR |
| 2020 |
.265 |
.328 |
.473 |
584 |
81 |
155 |
28 |
3 |
29 |
81 |
50 |
150 |
1 |
113 |
0 |
2.0 |
| 2021 |
.264 |
.327 |
.477 |
549 |
77 |
145 |
28 |
4 |
27 |
76 |
48 |
140 |
1 |
114 |
0 |
1.9 |
| 2022 |
.263 |
.327 |
.476 |
532 |
74 |
140 |
26 |
3 |
27 |
74 |
47 |
132 |
1 |
114 |
-1 |
1.9 |
The team could theoretically trade Trey Mancini, who has largely rehabilitated his value from 2018, but I’m not sure they need to, considering that there are three additional seasons until he hits free agency, and that 1B/corner OF/DH types are simply not valued as highly in baseball as they once were, perhaps to the point that they’re currently undervalued (see the Edwin Encarnación trade).
ZiPS still isn’t buying into Mancini completely (he was really awful in 2018), but his projection is now back in the league-average player territory. League-average players have value, else we’d use WAA instead of WAR for everything! I’m slightly more optimistic than ZiPS is as Mancini’s plate discipline has been slowly but steadily improving on a yearly basis, and one of the elements of his big 2017 — a BABIP that wasn’t supported by his peripheral numbers — isn’t present in the system. Of course, ZiPS takes that stuff into consideration as well, but I think given my history, nobody would accuse me of wearing black-and-orange colored glasses! Mancini’s a regular ol’ good player and there’s nothing wrong with that, apart from his outfield play, where he’s likely a win worse every year. It’s yet another reason to release Davis; any time you’re playing Davis at first, you’re likely sticking Mancini in the outfield, where his lousiness has been proven beyond a reasonable doubt.