The Best Team Defenses of 2025 (So Far)

Kevin Jairaj and John E. Sokolowski – Imagn Images

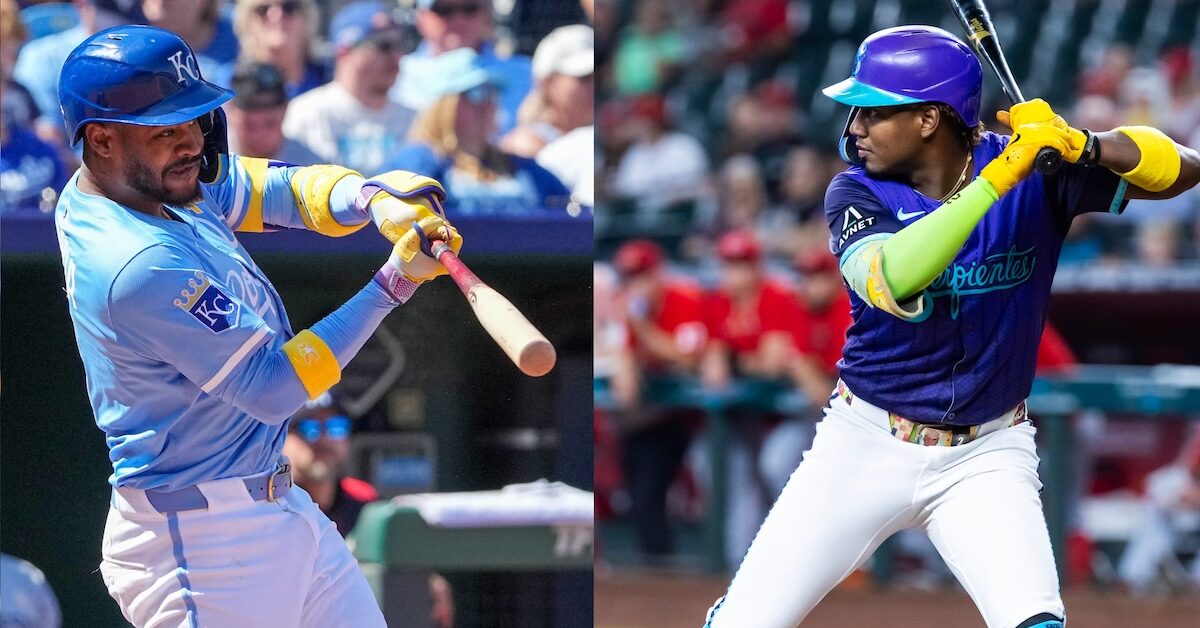
Coming into 2025, you might not have expected Alejandro Kirk and Ernie Clement to play central roles on a playoff contender. Neither player was an above-average hitter last season; in fact, each hit for a 93 wRC+ while playing regularly for a team that won just 74 games. Yet the pair rank first and second in position player WAR on the Blue Jays, thanks not only to improved offense but exceptional glovework, with Kirk battling the Giants’ Patrick Bailey for the top spot in two catching metrics, and Clement ranking among the best third basemen while also posting strong metrics in limited duty at the three other infield positions. The pair have not only helped the Blue Jays to a 47-38 record and the top AL Wild Card position, but also the top ranking in my annual midseason defensive breakdown.

Kirk and Clement aren’t Toronto’s only defensive stalwarts. Second baseman Andrés Giménez and center fielder Myles Straw, a pair of light-hitting glove whizzes acquired from the Guardians in separate trades this past winter, have been strong at their respective positions, with the latter helping to cover for the absences of Daulton Varsho. A Gold Glove winner last year, Varsho missed the first month of this season recovering from right rotator cuff surgery, and returned to the injured list on June 1 due to a strained left hamstring. Even in limited duty, Straw, Varsho, and Giménez — who missed about four weeks due to a quad strain, with Clement filling in at second for most of that time — have all rated as three to five runs above average according to Statcast’s Fielding Runs Value (FRV), and five to eight above average according to Defensive Runs Saved (DRS). Clement has totaled 12 DRS and 10 FRV at the four infield spots; in 359.2 innings at third, he’s second in the majors in both DRS (7) and FRV (5).

This is the third year in a row I’ve taken a midseason dip into the alphabet soup of defensive metrics, including Defensive Runs Saved (DRS), Statcast’s Fielding Run Value (FRV), and our own catcher framing metric (hereafter abbreviated as FRM, as it is on our stat pages). One longtime standby, Ultimate Zone Rating (UZR), has been retired, which required me to adjust my methodology. Read the rest of this entry »


If Junior Caminero Had Any More GDPs He’d Be Macroeconomics

Mark J. Rebilas-Imagn Images

Junior Caminero has, as of this writing, grounded into 22 double plays in 333 plate appearances this year. The first year both the AL and NL counted double plays was 1939; since then, there have been some 9,295 individual player seasons of 300 or more plate appearances. Caminero’s current campaign is already in the top 300 in double plays.

Two months ago, Leo Morgenstern wrote an article titled “Carlos Correa Is Keeping the GIDP Alive,” which conceded, right in the lede, that even though Correa had grounded into an appalling six double plays in April alone, Caminero was leading the league. The Rays third baseman has only expanded that gap; Jacob Wilson is second with 15 double plays. Read the rest of this entry »


Effectively Wild Episode 2342: The Extension Extension

EWFI
Ben Lindbergh and Meg Rowley banter about the return of Richard Lovelady, the MLB season debut of knuckleballer Matt Waldron, the superlative Zack Wheeler, how other knuckleballers in baseball are faring, Rich Hill’s wait for a call-up, Shohei Ohtani vs. Vinnie Pasquantino, Jacob Misiorowski and the leaguewide rise in pitcher extension, James Wood’s four intentional walks in one game (and the Angels’ outlier IBB total), MLB’s strikeout plateau (or reversal), Luis Arraez’s pursuit of contact history, historic events involving Wilyer Abreu, Trevor Rogers, and Jack Leiter, a serial fan interferer, the biggest team attendance climbs and declines, and how MLB’s minor league parks have played.

Audio intro: Philip Tapley and Michael Stokes, “Effectively Wild Theme
Audio outro: Justin Peters, “Effectively Wild Theme

Link to MLBTR on Lovelady
Link to uniforms changes
Link to best pitchers in June
Link to Posnanski on Wheeler
Link to AARP patch
Link to Pasquantino tweet
Link to extension leaderboard
Link to leaguewide extension
Link to leaguewide four-seam extension
Link to leaguewide four-seam velo
Link to velo leaders
Link to perceived velo leaders
Link to extension mailbag
Link to Ben on pitching distance
Link to Whitley on Wood
Link to Andrews on Wood
Link to four-IBB club
Link to 2025 team IBB
Link to IBB difference spreadsheet
Link to Bonds/Rays IBB post
Link to Rays IBB
Link to 2025 K%+ keaders
Link to all-time K%+ spreadsheet
Link to Dan S. on Arraez
Link to Rob on strikeouts
Link to MLB K rate by year
Link to non-pitcher K rate by year
Link to Abreu fun fact
Link to Rogers/Leiter fun fact
Link to Arizona fan story
Link to Arizona fan story 2
Link to Arizona fan tweet
Link to Hang Up episode
Link to attendance changes
Link to park factors
Link to Severino story 1
Link to Severino story 2
Link to Manfred quotes
Link to leaguewide TTO%
Link to player TTO%
Link to Marte update

 Sponsor Us on Patreon
 Give a Gift Subscription
 Email Us: podcast@fangraphs.com
 EW Subreddit
 Effectively Wild Wiki
 iTunes Feed (Please rate and review us!)
 Spotify Feed
 Facebook Group
 Bluesky Account
 Twitter Account
 Get Our Merch!


So You’ve Intentionally Walked James Wood. What Now?

Gary A. Vasquez-Imagn Images

On Sunday, the Angels made 22-year-old James Wood the first player to receive four intentional walks in a single game since Barry Bonds in 2004. You could argue the plan worked, too, as Wood came up with at least one runner in scoring position all four times, and the only one of those runners to score did so on a bizarre, inning-ending double play. If the Angels’ goal was to avoid the big inning, then they nailed it. If their goal was to win the game, well, hope springs eternal; the Nationals won, 7-4, in 11 innings. The obvious takeaway is the 6’7” Wood is a terrifying talent, but just as obvious is how out of step with current baseball thinking – or really any baseball thinking – this move was.

Wood is having an incredible season, launching 22 home runs, walking 14.5% of the time, and batting .283. His 156 wRC+ makes him the eighth-best hitter in the game this season and a genuine contender for the National League MVP. However, it’s impossible to argue that he’s in Bonds territory. Bonds earned four IBBs four different times that year. He was in the midst of his fifth straight 45-homer season and 13th straight 30-homer campaign. He held the single-season home run record and was closing in on the all-time one. He put up a 233 wRC+ en route to an absurd 11.9 WAR in 2004. He was in his own league. Moreover, the game has progressed in its thinking since 2004, and it’s now widely understood that an intentional walk is rarely the smart move.

Stathead, which uses Retrosheet data from back before intentional walks were an official stat, lists 12 instances in which a player received at least four intentional walks in a game. This John Schwartz article from the 1980 Baseball Research Journal can teach you even more about the earlier history of the IBB, including the contention that Mel Ott received five intentional passes during the second game of a doubleheader on October 5, 1929 (though Retrosheet only lists three of Ott’s five walks that day as intentional). So this is an extraordinarily rare feat, and fully a third of the times it has happened in baseball history, it was specifically happening to Bonds in 2004. Read the rest of this entry »


St. Louis Cardinals Top 41 Prospects

JJ Wetherholt Photo: Rich Storry-Imagn Images

Below is an analysis of the prospects in the farm system of the St. Louis Cardinals. Scouting reports were compiled with information provided by industry sources as well as our own observations. This is the fifth year we’re delineating between two anticipated relief roles, the abbreviations for which you’ll see in the “position” column below: MIRP for multi-inning relief pitchers, and SIRP for single-inning relief pitchers. The ETAs listed generally correspond to the year a player has to be added to the 40-man roster to avoid being made eligible for the Rule 5 draft. Manual adjustments are made where they seem appropriate, but we use that as a rule of thumb.

A quick overview of what FV (Future Value) means can be found here. A much deeper overview can be found here.

All of the ranked prospects below also appear on The Board, a resource the site offers featuring sortable scouting information for every organization. It has more details (and updated TrackMan data from various sources) than this article and integrates every team’s list so readers can compare prospects across farm systems. It can be found here. Read the rest of this entry »


Jay Jaffe FanGraphs Chat – 7/1/25

12:01
Avatar Jay Jaffe: Good afternoon, folk! Greetings from Wellfleet, where I’m on my annual family (semi) vacation

12:02
Avatar Jay Jaffe: This is my working week up here, which kicked off with my tribute to the late Dave Parker, who sadly passed away less than a month before his Hall of Fame induction https://blogs.fangraphs.com/remembering-the-cobra-dave-parker-1951-202…

12:04
Avatar Jay Jaffe: I don’t think you have to be a strong proponent of Parker’s HOF case to feel the sadness that comes with the timing of his death. I’m glad he experienced the outpouring of joy, appreciation and love that came with the news of his election.

12:04
Avatar Jay Jaffe: I’m working on my annual midseason look at the best team defenses, and will have something on Clayton Kershaw’s run for 3,000 strikeouts later this week as well.

12:05
Avatar Jay Jaffe: Planning to take in a Cape Cod League game sometime after the 4th

12:05
Avatar Jay Jaffe: anyway, on with the show

Read the rest of this entry »


Checking in on ZiPS zStats for Hitters at the Halfway Mark

Joe Nicholson-Imagn Images

Love ’em or hate ’em, the class of “expected” stats has utility when we’re talking about predicting the future. The data certainly have mixed feelings among fans, but they perform an important task of linking the things that Statcast and similar non-traditional metrics say to performance on the field. A hard-hit rate of X% or a launch angle of Y degrees doesn’t really mean anything by itself, without the context of what’s happens in baseball games.

I’ve been doing projections now for nearly half (!) my life, so outside of my normal curiosity, I have a vested interest in using this kind of information productively in projections. Like the Statcast estimates (preceded with an x, as in xBA, xSLG, etc.), ZiPS has its own version, very creatively using a z instead.

It’s important to remember these aren’t predictions in themselves. ZiPS certainly doesn’t just look at a pitcher’s zSO from the last year and say, “Cool, brah, we’ll just go with that.” But the data contextualize how events come to pass, and are more stable than the actual stats are for individual players. That allows the model to shade the projections in one direction or the other. Sometimes that’s extremely important, such as in the case of homers allowed for pitchers. Of the fielding-neutral stats, homers are easily the most volatile, and home run estimators for pitchers are much more predictive of future homers than are actual homers allowed. Also, the longer a hitter “underachieves” or “overachieves” in a specific stat, the more ZiPS believes the actual performance rather than the expected one. More information on accuracy and construction can be found here. Read the rest of this entry »


Where Has the Old Ozzie Albies Gone?

Dale Zanine-Imagn Images

When Ozzie Albies signed his current contract, I decried it in such terms that, well, “decried” was an accurate description. This 22-year-old middle infielder, coming off a season of 24 home runs and 4.0 WAR, had signed away his prime earning years to the Braves for seven years at an average of $5 million per. Two option years could keep him in Atlanta through 2027 without increasing the contract’s AAV. It was an all-time swindle, I wrote. Esau got a better deal when he sold his inheritance for a bowl of stew.

Six years later, I sit here contemplating a question that once would’ve seemed unfathomable: Should the Braves pick up those option years?

Through his first 83 games, Albies is hitting .223/.297/.321, which is a wRC+ of 74. He has never before hit under .259, nor slugged under .450, nor posted a wRC+ under 100 in any previous healthy season. There’s probably a little bad batted ball luck in there, and some malaise from Atlanta’s comprehensively frustrating, injury-riddled season to date. Read the rest of this entry »


Where Do We Draw the Line Drive?

Vincent Carchietta-Imagn Images

I still remember the first time I wondered, What if the colors I see aren’t the same ones that other people see? What if the color I perceive as red looks the same as what you perceive as yellow? I was 10 years old, and I felt like a budding scientist or philosopher, or perhaps a poet. Whichever one, I was already preparing my Nobel Prize acceptance speech.

I’ve since come to realize that my 10-year-old brain wasn’t asking anything that every stoned college freshman hadn’t asked before. I sounded less like a Nobel Laureate and more like John Kruk taking his role as the Phillies’ color commentator a bit too literally. That said, the idea that different human beings perceive colors in different ways isn’t just pot-fueled postulation or Krukian wisdom – it’s the truth. It would have blown my 10-year-old mind to learn the colors I see aren’t necessarily the colors everyone else sees, and it’s not just about rods, cones, and intrinsically photosensitive retinal ganglion cells. Sometimes, it’s a matter of language.

Take a look at the four swatches below. Think about what colors they are. And no, the answers aren’t Steven Kwan’s whiff rate, arm strength, bat speed, and sprint speed: Read the rest of this entry »


FanGraphs Power Rankings: June 23–29

As the calendar turns to July, the AL is a bit of a mess. The six teams that currently hold playoff berths are the only ones with winning records. The opposite is true in the NL, where there are nine teams over .500. That landscape should make for a very interesting trade deadline.

Last year, we revamped our power rankings using a modified Elo rating system. If you’re familiar with chess rankings or FiveThirtyEight’s defunct sports section, you’ll know that Elo is an elegant solution that measures teams’ relative strength and is very reactive to recent performance. To avoid overweighting recent results during the season, we weigh each team’s raw Elo rank using our coin flip playoff odds (specifically, we regress the playoff odds by 50% and weigh those against the raw Elo ranking, increasing in weight as the season progresses to a maximum of 25%). The weighted Elo ranks are then displayed as “Power Score” in the tables below. As the best and worst teams sort themselves out throughout the season, they’ll filter to the top and bottom of the rankings, while the exercise will remain reactive to hot streaks or cold snaps.

First up are the full rankings, presented in a sortable table. Below that, I’ve grouped the teams into tiers with comments on a handful of clubs. You’ll notice that the official ordinal rankings don’t always match the tiers — there are times where I take editorial liberties when grouping teams together — but generally, the ordering is consistent. One thing to note: The playoff odds listed in the tables below are our standard Depth Charts odds, not the coin flip odds that are used in the ranking formula.

Complete Power Rankings
Rank Team Record Elo Opponent Elo Playoff Odds Power Score Δ
1 Dodgers 53-32 1591 1500 99.8% 1607 0
2 Astros 50-34 1585 1497 96.5% 1601 2
3 Tigers 53-32 1559 1488 99.0% 1582 0
4 Rays 47-37 1563 1506 79.0% 1572 2
5 Phillies 49-35 1546 1496 89.8% 1559 -3
6 Cubs 49-35 1545 1510 83.6% 1558 -1
7 Yankees 48-35 1536 1498 95.9% 1553 0
8 Brewers 47-37 1545 1485 57.3% 1547 0
9 Cardinals 47-38 1548 1508 48.7% 1547 3
10 Blue Jays 45-38 1539 1506 63.3% 1543 0
11 Reds 44-40 1530 1498 16.5% 1516 4
12 Mets 48-37 1499 1485 77.4% 1512 -3
13 Mariners 43-40 1505 1498 61.3% 1503 3
14 Padres 45-38 1503 1497 42.3% 1502 0
15 Angels 41-42 1499 1496 6.6% 1486 4
16 Giants 45-39 1482 1490 41.8% 1481 -5
17 Red Sox 41-44 1493 1500 14.7% 1475 -4
18 Rangers 41-43 1487 1498 20.0% 1473 2
19 Diamondbacks 41-42 1482 1497 18.1% 1464 -1
20 Marlins 37-45 1490 1507 0.2% 1463 6
21 Orioles 36-47 1489 1502 3.5% 1462 3
22 Guardians 40-42 1472 1505 21.9% 1461 -5
23 Braves 38-45 1484 1494 24.3% 1458 -1
24 Twins 40-44 1475 1495 26.3% 1458 -1
25 Pirates 35-50 1482 1512 0.1% 1452 0
26 Royals 39-45 1459 1498 11.8% 1441 -5
27 Athletics 34-52 1431 1506 0.3% 1408 0
28 Nationals 35-49 1429 1502 0.0% 1407 0
29 White Sox 28-56 1401 1504 0.0% 1382 0
30 Rockies 19-65 1348 1524 0.0% 1335 0

Tier 1 – The Best of the Best
Team Record Elo Opponent Elo Playoff Odds Power Score
Dodgers 53-32 1591 1500 99.8% 1607
Astros 50-34 1585 1497 96.5% 1601

After wrapping up a 5-1 week with a series win over the Royals, the Dodgers have now won 15 of their last 20 games. That little swoon they toiled through toward the end of May is firmly in the rearview mirror. No one in the lineup is hotter than Max Muncy, who finished June with a .333/.459/.654 slash line, seven home runs and a 205 wRC+. The real turning point for Muncy came on April 30, when he started wearing glasses. Since then, he has a 178 wRC+ across 51 games, after posting a woeful wRC+ of 58 through his first 28 games of the season.

The Astros also went 5-1 last week, though they did it against two of NL’s top teams, the Phillies and the Cubs. Since Yordan Alvarez injured his hand on May 2, Houston has the best record in baseball, 34-19, and has built a huge 6 1/2-game lead in the AL West. The Astros can thank three guys for carrying the load for the offense while Alvarez has been sidelined: Jeremy Peña (162 wRC+ since May 2), Isaac Paredes (151), and Cam Smith (145). As for Alvarez, he’s ramping up his rehab and will begin to face live pitching this week.

Tier 2 – On the Cusp of Greatness
Team Record Elo Opponent Elo Playoff Odds Power Score
Tigers 53-32 1559 1488 99.0% 1582
Rays 47-37 1563 1506 79.0% 1572

The Tigers won their weekend series against the Twins with two emphatic wins on Saturday and Sunday. In their 10-5 victory on Saturday, Riley Greene and Zach McKinstry were the standouts, each collecting a home run and three hits. Tarik Skubal took center stage on Sunday, firing seven shutout innings with 13 punchouts while allowing just two baserunners.

The Rays had a wild weekend in Baltimore; they were on the wrong end of a 22-8 blowout on Friday, turned things around with an 11-3 victory on Saturday, and finally lost the series with a relatively tame 5-1 loss on Sunday. Despite the small setback, Tampa Bay still leads the AL Wild Card race and has closed the gap in the AL East to just 1 1/2 games.

Tier 3 – Solid Contenders
Team Record Elo Opponent Elo Playoff Odds Power Score
Phillies 49-35 1546 1496 89.8% 1559
Cubs 49-35 1545 1510 83.6% 1558
Yankees 48-35 1536 1498 95.9% 1553
Brewers 47-37 1545 1485 57.3% 1547
Cardinals 47-38 1548 1508 48.7% 1547
Blue Jays 45-38 1539 1506 63.3% 1543

Although the Cubs have led the NL Central for nearly the entire season, a .500 record in June has thrown the door open for the Brewers and Cardinals to make it true three-team race for the division. Chicago was 6 1/2 games ahead as recently as June 17, but that lead has now dwindled to two games. Milwaukee and St. Louis deserve credit for taking advantage of this month-long slump from the Cubs. Before a frustrating extra-innings loss on Sunday, the Brew Crew had won 22 of their previous 30 games, while the Cards are in the midst of an 11-4 stretch.

Last week, the Phillies were swept in Houston despite allowing just five runs during the three-game series because they scored just one of their own. They enjoyed a 13-run outburst in Atlanta on Friday, but then combined for three runs during the final two games of the series. That was enough to take two of three from the Braves thanks to another phenomenal outing from Ranger Suárez on Sunday, who tossed seven innings of one-run ball while striking out eight. He’s allowed a total of 10 runs across his last 10 starts. The good news is Bryce Harper is on track to return from the IL at some point this week when Philadelphia returns home to face the Padres and Reds.

The Yankees earned a much-needed weekend series win over the Athletics to bring their June record to 13-13, a stretch that has seriously loosened their grip on the AL East. After leading by as many as 6 1/2 games during the first week of this month, they enter the final day of June with just a 1 1/2-game cushion over the Rays. New York’s bats have gone cold as the weather has warmed up. Since June 1, the Yankees are running a 103 wRC+, down from their best-in-baseball 128 wRC+ over the first two months of the season. They begin this week with a huge four-game set on the road against the third-place Blue Jays, who are 19-11 over their last 30 games and just three games behind New York in the standings.

Tier 4 – The NL Melee
Team Record Elo Opponent Elo Playoff Odds Power Score
Reds 44-40 1530 1498 16.5% 1516
Mets 48-37 1499 1485 77.4% 1512
Padres 45-38 1503 1497 42.3% 1502
Giants 45-39 1482 1490 41.8% 1481

The Mets are in a full tailspin after their nightmarish weekend in Pittsburgh, where they were swept by the putrid Pirates and allowed 30 runs across the three-game set. With a 12-1 drubbing on Sunday, New York has now dropped 13 of its last 16 games. The starting rotation was already down three members when Griffin Canning ruptured his Achilles’ tendon on Thursday. The lone bright spot for the Mets this month has been Juan Soto’s continued resurgence; he blasted three home runs last week to bring his June total up to 11.

Ignore the Reds at your own peril. Chase Burns made his debut last week, striking out eight Yankees and flashing the electric stuff that made him Cincinnati’s top prospect. Then, on Sunday, Elly De La Cruz sparked an exciting ninth-inning comeback to secure a huge series win over the Padres and continue his scorcher of a month; he’s slashing .348/.429/.674 for a 195 wRC+ with one more game to play in June. The Reds are lurking in both the NL Central (five games back) and in the NL Wild Card race (2 1/2 games back), and all that young talent looks like it’s finally driving some success at the big league level.

The Rafael Devers trade hasn’t sparked a turnaround for the Giants offense. Quite the opposite, in fact; they’re 4-8 since acquiring him two weeks ago, and he’s slashing .217/.333/.391 with his new team. Last week was especially brutal, as San Francisco went 1-5 against the Marlins and White Sox to fall to 1 1/2 games out in the NL Wild Card standings. The Giants enter this week with a four-game series against the Diamondbacks in Arizona.

Tier 5 – The AL Melee
Team Record Elo Opponent Elo Playoff Odds Power Score
Mariners 43-40 1505 1498 61.3% 1503
Angels 41-42 1499 1496 6.6% 1486
Red Sox 41-44 1493 1500 14.7% 1475
Rangers 41-43 1487 1498 20.0% 1473

The Mariners took two of three from the Rangers in Texas this weekend, with every game going into extra innings — the first time that’s happened in any three-game series since 2015. Seattle hosts the Royals and Pirates this week before closing out the first half on the road against the Yankees and Tigers. Meanwhile, despite boasting the best pitching staff in baseball, the Rangers are fourth in the AL West standings because their lineup has continued to struggle. On the bright side, Corey Seager is showing some signs of life. The Texas shortstop bashed three home runs against the Mariners and has a 163 wRC+ over his last 14 games.

Prior to their 15-run outburst on Saturday, the Red Sox had scored just 2.8 runs per game in the 10 games since trading away Rafael Devers. Neither Roman Anthony (87 wRC+) nor Marcelo Mayer (84 wRC+) has had much success against big league pitching thus far, and the lineup looks particularly punchless without Devers anchoring it. Masataka Yoshida is expected to begin a rehab assignment this week and Alex Bregman ramped up his baseball activities over the weekend, but those reinforcements likely won’t return until after the All-Star break. By then it could be too late for them to make a significant impact on Boston’s plans ahead of the trade deadline.

Tier 6 – No Man’s Land
Team Record Elo Opponent Elo Playoff Odds Power Score
Diamondbacks 41-42 1482 1497 18.1% 1464
Marlins 37-45 1490 1507 0.2% 1463
Orioles 36-47 1489 1502 3.5% 1462
Guardians 40-42 1472 1505 21.9% 1461
Braves 38-45 1484 1494 24.3% 1458
Twins 40-44 1475 1495 26.3% 1458
Pirates 35-50 1482 1512 0.1% 1452
Royals 39-45 1459 1498 11.8% 1441

The injuries just keep coming for the Diamondbacks, most recently last Monday when they placed Corbin Carroll on the IL with a fractured wrist. They had been managing to stay afloat despite losing Corbin Burnes at the start of the month, but it might be too much to do so while also being without Carroll. The Snakes slipped back below .500 after getting swept by the Marlins last weekend. Eight of Arizona’s final 14 games before the All-Star break come against the Giants and Padres.

The Marlins are riding a seven-game winning streak — their longest since 2022 — into this week after sweeping both the Giants and Diamondbacks and taking their series finale against the Braves to cap the week before. It’s been an up-and-down season for Miami, but the offense has been clicking during this hot streak. Otto Lopez (10-game hitting streak), Agustín Ramírez (11 hits last week), and Kyle Stowers (three home runs during the winning streak) have been the standouts, and they’re getting clutch hits in all the big spots. On Sunday, Lopez hit the go-ahead two-run single in the eighth inning, and Stowers followed up with a three-run double to seal the victory.

With their impressive series win over the Rays last weekend, the Orioles have compiled a 15-11 record in June. That’s much better than their abysmal first two months of the season but not good enough to get them back into the playoff race. To make matters worse, injuries have continued to plague the roster; Adley Rutschman hit the IL for the first time in his career with an oblique injury, and Zach Eflin left his start Saturday after just a single inning. It’s probably time to throw in the towel and start looking forward to 2026 and beyond.

The Royals snapped a six-game losing streak with a win on Saturday — their first win at home since May 31. They are in the midst of a 6-15 stretch that’s dropped them from three games over .500 to six below. The pitching staff is doing its job; Kansas City has allowed more than five runs just four times in the past 21 games and the second-fewest total in the AL during that span. The lineup remains the problem, as the Royals have the fourth-worst offense (83 wRC+) in the majors this season.

Tier 7 – Hope Deferred
Team Record Elo Opponent Elo Playoff Odds Power Score
Athletics 34-52 1431 1506 0.3% 1408
Nationals 35-49 1429 1502 0.0% 1407
White Sox 28-56 1401 1504 0.0% 1382
Rockies 19-65 1348 1524 0.0% 1335

The White Sox have a 19-24 record at home following their series win over the Giants last weekend. That’s respectable — especially after their historically bad season last year. Unfortunately, they are 9-32 on the road, which is where they’ll be again this week when they travel to play the Dodgers and Rockies. Amazingly enough, the Rockies have won fewer home games than the White Sox have won on the road. It’ll be a battle between the two worst ballclubs in baseball in the launching pad of Coors Field. Sounds fun!