At first glance, Josh Rojas and Derek Zoolander don’t have a lot in common. Rojas is a third baseman, while Zoolander is a fictional male model. Rojas is from Arizona, while Zoolander is from an unnamed coal mining town in Appalachia. They have different jobs, different lives, and again, one is a fictional character. But one thing unites the two: Their careers took off when they learned how to go left.
In 2022, Rojas settled into a role as an everyday third baseman after years of bouncing between positions. Just one problem: He was one of the worst defenders in the major leagues at the hot corner. That was the consensus of scouts when he was a prospect, and defensive metrics bore it out. He particularly struggled ranging towards second base. Statcast breaks defensive opportunities up based on which direction a player has to move to make the play. When Rojas was moving to his right, forward, or backward, he was one run above average defensively. When he went left, he was seven runs below average. Read the rest of this entry »
Welcome back to Top of the Order, where every Tuesday and Friday I’ll be starting your baseball day with some news, notes, and thoughts about the game we love.
No division race is tighter than the AL East, with the Yankees leading the Orioles by just 1.5 games ahead of their three-game matchup that begins tonight in the Bronx. Both teams are virtual locks to make the playoffs, but securing the division title is crucial because of the almost-certain bye that would come with it. This is a fierce race that looks like it’ll go down to the wire, but these head-to-head games might not be as important for their divisional hopes as their off-the-field showdown leading up to the trade deadline.
While the Orioles and Yankees won’t have much overlap in terms of trade needs — and as such won’t be competing for many of the same players — they’re obviously competing to get better and build more complete rosters so they can outlast the other and make a deep October run. The thing is, considering there are only five teams right now that are out of the playoff picture — the White Sox, Marlins, Athletics, Rockies, and Angels — actual upgrades available on the trading block might be in short supply. That means the Yankees and Orioles will need to capitalize on whatever improvements they can make. This environment could set the stage for New York and Baltimore to be among the most active teams over the next month and a half.
The Yankees have arguably the two best hitters in the entire league in Aaron Judge and Juan Soto, and though the rest of the lineup is good, it doesn’t inspire nearly as much confidence. Anthony Volpe’s flattened swing path has helped him cut down on his strikeout rate and spray more hits to the opposite field, but this month his strikeout rate is back up to 27% and he hasn’t walked since May 30. Alex Verdugo has been solidly above average and stabilized left field, which had a cavalcade of players come through last year, and Giancarlo Stanton’s streakiness has worked itself out to a 121 wRC+ and 17 homers, even though his on-base percentage is below .300. The catching duo of Jose Trevino and Austin Wells has come around too, though Trevino’s throwing issues were firmly on display on Sunday, when the Red Sox stole nine (!) bases against him.
And then there’s the triumvirate of underperforming infielders: Anthony Rizzo, Gleyber Torres, and DJ LeMahieu. I’d be shocked if Torres didn’t keep his job; after an anemic start, his bat has started to come around (112 wRC+ since May 12). But LeMahieu hasn’t hit much at all since signing his six-year deal before the 2021 season, and Rizzo has struggled for a full calendar year now, though at least some of his 2023 woes can be attributed to the post-concussion syndrome that caused him to miss the final two months of last season. Further complicating matters is Rizzo’s latest injury, a fractured right arm that won’t require surgery but will keep him out for an estimated four to six weeks, according to The Athletic. In the short-term, the Yankees are expected to play Oswaldo Cabrera at third and LeMahieu at first, with catcher/first baseman Ben Rice likely to replace Rizzo on the roster. A bat like Rockies third baseman Ryan McMahon would go a long way toward lengthening the lineup while also improving the defense.
The Orioles, on the other hand, have gotten strong production up and down the lineup, with the exception of Cedric Mullins, who has made up for his offensive struggles with excellent defense. But their pitching — widely viewed as a strength coming into the offseason — has been hammered by injuries.
The Yankees weathered the loss of Gerrit Cole with aplomb — so much so that I’m not sure they’ll need to be in the market for starting pitching, even as Clarke Schmidt is expected to be out for a while with a lat strain. Cole is slated to be activated and make his season debut tomorrow night. Meanwhile, the sheer quantity of Orioles starters on the IL all but necessitates making an acquisition on that front. Dean Kremer will be back soon from triceps tightness, but Tyler Wells and John Means are out for the year, and Kyle Bradish could be destined for the same fate. He recently landed on the IL for a second time this year with a sprained UCL in his elbow. That leaves AL Cy Young frontrunner Corbin Burnes, Grayson Rodriguez, and Kremer as the top three starters of a playoff rotation, with the revelatory Albert Suárez and Cole Irvin right behind and rookie Cade Povich potentially pushing for a spot as well.
There would certainly be worse playoff rotations around the league, but the O’s would be doing a disservice to their deep offense if they neglected to improve their starting pitching, especially after they failed to address last year’s rotation before the deadline and then were pounded by the Rangers and swept out of the ALDS. Their wealth of position player depth in the minor leagues should allow them to add at least one or two of the top available starters: Garrett Crochet, Erick Fedde, Tyler Anderson, Cal Quantrill, and Jesús Luzardo.
The one mutual need for the Yankees and Orioles is where all teams overlap at the deadline: the bullpen. Both teams have excellent back-end duos — Baltimore has Craig Kimbrel and Yennier Cano, while New York boasts Clay Holmes and Luke Weaver — but there’s a steep dropoff after that. The shallow seller’s market ought to create a lesser supply of available relief arms, which would likely inflate the cost that teams would ask for in return. This is where the strength of the New York and Baltimore farm systems (both of which are excellent) really come into play. These two organizations can afford to overpay for a third high-octane reliever — such as Carlos Estévez, Tanner Scott, Michael Kopech, and perhaps even Mason Miller — without sacrificing their long-term outlook.
The final distinction is the two teams’ disparate payroll situations. While it doesn’t appear as if the Yankees have any restrictions for this season — and the pursuit of keeping Soto surely will be unaffected — owner Hal Steinbrenner certainly sounds like a man who wants to decrease payroll from the $302 million it’s at this season. Next year’s payroll is already at $182 million, and that’s before factoring in arbitration raises to key players like Trevino, Schmidt, and Nestor Cortes — not to mention the exorbitant price that’ll be required to re-sign Soto. Torres and Verdugo are also set to hit free agency this offseason, and the current payroll figure for 2025 doesn’t include what it will cost either to bring them back or backfill their positions. That could make them less interested in trading for players on guaranteed contracts beyond this season, even those who would fit well, like McMahon.
On the flip side, the Orioles have an extraordinary amount of flexibility under new owner David Rubenstein, who hasn’t publicly commented on specific payroll plans but essentially can’t do anything but spend more than the Angelos family did in the last several years of its ownership. Huge raises are coming for Adley Rutschman, Gunnar Henderson, Ryan Mountcastle, Bradish, and others, but Baltimore has a paltry $2 million committed to next season. That should give GM Mike Elias carte blanche to acquire anyone he wants at the deadline no matter how many years of club control the player has remaining, provided he’s willing to give up the necessary prospects.
All of this will play out over the next six weeks before the deadline. In the meantime, the battle for the AL East begins in earnest tonight.
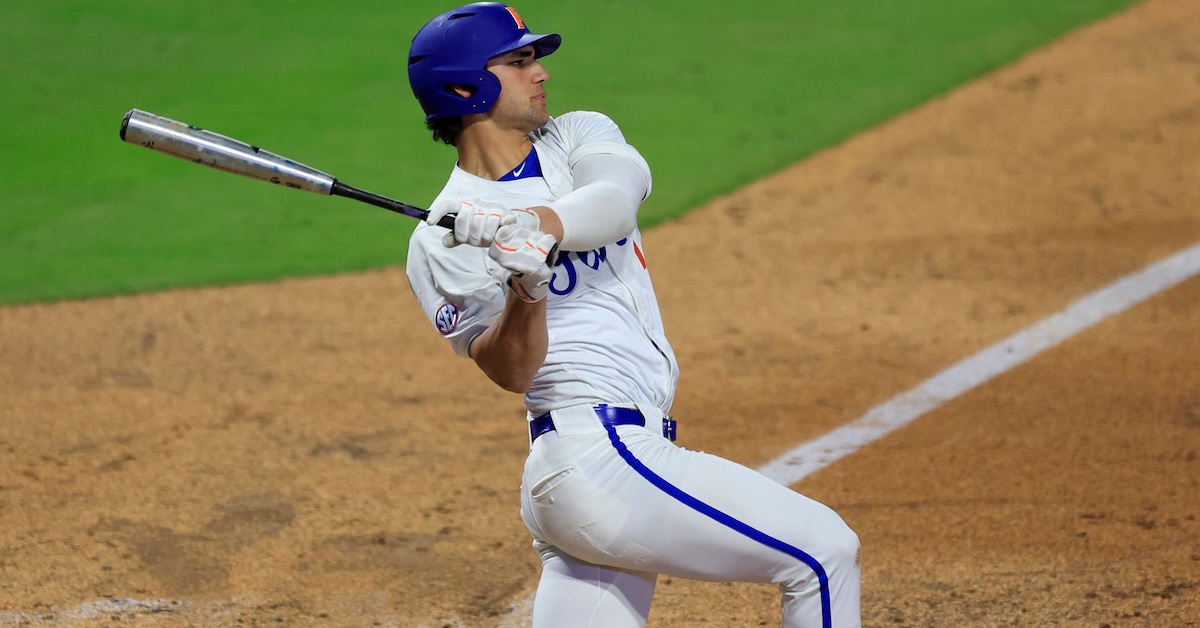
Ben Lindbergh and Meg Rowley banter about whether Nike’s City Connect uniforms have run their course, the Dodgers’ double whammy of injuries to Mookie Betts and Yoshinobu Yamamoto (and Kyle Bradish going back on the IL), the approaching returns of Gerrit Cole, Max Scherzer, and Clayton Kershaw, Carlos Correa’s hot streak, Elly De La Cruz and the excitement of scoring unexpectedly, a better way to handle a hypothetical hitter who only hits grand slams, David Fletcher’s strange season and transition to true two-way play, the potential fallout from umpire Pat Hoberg’s gambling scandal, a dead ball in NPB, and how pitching phenom Roki Sasaki’s lack of durability could affect his future free agency.
This has not been the year for the AL West. With the reigning World Series champion Rangers sitting below .500 amid a string of injuries, the Astros’ core succumbing to age, and the Angels and A’s sitting at rock bottom, one of baseball’s stronger divisions over the past few years has become its weakest. Just one team has a winning record: the Seattle Mariners. At 43-31, the Mariners hold an 8.5-game lead in the West, even as some of the underlying numbers indicate the team isn’t as good as its record suggests. Seattle has overperformed its Pythagorean record by four wins and its BaseRuns record by two, and its run differential is by far the worst among division leaders. But this kind of thing is nothing new for this organization.
The Mariners are currently enjoying their fourth consecutive year of contention, falling short of a Wild Card spot in 2021 and ’23 and snapping their two-decade playoff drought in ’22. In each of these seasons, they’ve pulled out wins in close games like no other club, and manager Scott Servais has pointed to the poise and experience with which his team handles tight matchups. Famously, after a 2021 road trip where the Mariners went 6-2 despite being outscored by their opponents, Servais introduced the term “fun differential” to evaluate the team rather than its relatively poor run differential. Three years later, with a new group of players, the fun differential is still elite.
One-Run Game Stats
Team
1-Run Games
1-Run Game Rank
1-Run Win Rate
1-Run Win Rate Rank
Rays
18
20
72.2%
1
Mariners
24
T-3
70.8%
2
Twins
17
24
70.6%
3
Mets
24
T-3
62.5%
4
Diamondbacks
18
19
61.1%
5
Red Sox
12
30
58.3%
6
Phillies
19
14
57.9%
7
Rangers
16
28
56.3%
8
Yankees
18
21
55.6%
9
Cardinals
20
10
55.0%
10
Guardians
20
11
55.0%
11
Brewers
24
T-3
54.2%
12
Dodgers
15
29
53.3%
13
Marlins
17
23
52.9%
14
Pirates
23
6
52.2%
15
Royals
22
7
50.0%
16
Giants
18
18
50.0%
17
Tigers
21
9
47.6%
18
Rockies
19
12
47.4%
19
Cubs
29
1
44.8%
20
Athletics
25
2
44.0%
21
Padres
19
13
42.1%
22
Blue Jays
19
16
42.1%
23
Angels
22
8
40.9%
24
Nationals
16
25
37.5%
25
Braves
16
26
37.5%
26
Orioles
16
27
37.5%
27
White Sox
19
15
31.6%
28
Reds
17
22
29.4%
29
Astros
19
17
26.3%
30
SOURCE: MLB.com
Naturally, in order to win a lot of one-run games, you need to play in a lot of one-run games. One of the best ways to do that is to play plenty of low-scoring affairs, when neither team scores enough runs to pull away from its opponent. And indeed, the Mariners rank in the bottom third of the majors in both runs scored and allowed. The first factor that puts them in so many tight games is the strength of their starting rotation, which has been among the best in baseball by both volume and efficiency. As a squad, they rank eighth in ERA- and FIP-, and second in innings per start; they’re one of just two teams to convert quality starts over half the time. While none of their starters are individually dominating the leaderboards, the depth they have is nearly unmatched. The Mariners are one of three teams (along with the Phillies and Yankees) with four qualified starters with an ERA- of 95 or lower, and even Seattle’s fifth slot (with starts made by Emerson Hancock, Bryan Woo, and Jhonathan Diaz) has pitched to a 3.25 ERA. In short, they’re the only team in the league that can expect to have good starting pitching every single night.
On the flip side, Seattle’s offense has taken a significant hit from last year. Lineup mainstays like J.P. Crawford, Julio Rodríguez, and Cal Raleigh have regressed this season, though Rodríguez has turned things around over the past month. Many of the hitters Seattle added during the offseason have underperformed as well. Returning fan favorite Mitch Haniger has been below replacement level, and Jorge Polanco and Mitch Garver are each hitting below the Mendoza line.
Mariners Offensive Production by Position
Position
2023 wRC+
2024 wRC+
Difference
Catcher
114
79
-35
First Base
108
116
8
Second Base
75
76
1
Third Base
102
93
-9
Shortstop
134
112
-22
Left Field
117
96
-21
Center Field
126
98
-28
Right Field
88
76
-12
Designated Hitter
93
122
29
With an excellent rotation and below-average hitting, the Mariners have the recipe for low-scoring games, but there’s another factor here as well: their home field. T-Mobile Park has been regarded as a pitcher’s paradise since its opening 25 years ago, but it’s been even more unfavorable for hitters in 2024 than in previous years. Statcast’s single-season park factors view it as, by far, this season’s most pitcher-friendly park, with a factor of 87; it has had scores between 92 and 96 for the past half-decade. The end result is that nearly a third of Mariners games have been decided by a single run, one of the highest marks in the league.
Playing in a lot of one-run games is one thing, but winning them is another. The Cubs and Athletics, the only teams with more one-run contests, each have losing records in such games. But the Mariners combine quantity with quality, having the most one-run wins while placing second to the Rays in one-run winning percentage. In contests decided by multiple runs, the Mariners are 26-24 — their .520 win percentage in such games is shockingly close to their .527 Pythagorean record — but one-run wins have vaulted them to a dozen games above .500. Some of these wins have come in dramatic fashion, as their five walk-offs are tied for the league lead. The Mariners have been far from an offensive powerhouse, but all year the bats have come alive when it matters most.
Mariners Situational Hitting Stats
Situation
wRC+
Rank
Low Leverage
88
24
Medium Leverage
98
18
High Leverage
144
3
Bases Empty
93
18
RISP
117
11
These splits are staggering. In low leverage, the Mariners are one of worst-hitting teams in the league. But when the stakes are highest, they collectively produce like a top-15 hitter in baseball. However, the eye-popping 144 wRC+ figure in high-leverage spots comes with a .377 BABIP – more than 40 points higher than any other team in that split. Come year’s end, that number will certainly be lower than it is now, but looking underneath the hood, Seattle batsmen have still been hitting better in high leverage than low leverage. Their walk rate is three points higher and strikeout rate three points lower in such situations, and their hard-hit rate is also modestly higher.
While Mariners hitters might not be able to forever continue their dominance in dramatic moments, the production they are getting from their bullpen, the other component of their success in one-run games, is far more sustainable. Despite some confusing trades, strong relief pitching has been a strength of recent Seattle squads. The organization has a knack for finding, acquiring, and developing under-the-radar relievers.
Mariners Bullpen, 2021-24
Year
ERA-
FIP-
WAR Rank
Shutdown%
2021
94
89
4
67.5%
2022
89
95
13
63.9%
2023
85
91
6
65.6%
2024
97
93
8
64.6%
Shutdown% is defined as Shutdowns / (Shutdowns + Meltdowns)
Andrés Muñoz is enjoying his first full season as Mariners closer, but he hasn’t been deployed solely in ninth-inning save situations. In fact, only half of his appearances have begun at the start of the ninth inning. He’s been called upon for a couple of extra-inning appearances, but his most notable work has come when he’s inherited a dirty eighth inning and converted a four- or five-out save. Muñoz has recorded more than three outs in seven games, second to Mason Miller among full-time closers, and in those games, he hasn’t surrendered a single run. Servais has consistently picked the right time to get his relief ace onto the mound, as Muñoz has the highest average entrance leverage index in the league.
Veteran reliever Ryne Stanek and 31-year old breakout Tayler Saucedo, who each rank above some closers on the leverage index leaderboard, have mostly handled set-up duties ahead of Muñoz. The two of them complement each other well, as both Stanek, a righty, and Saucedo, a lefty, have significant platoon splits, and Servais shrewdly deploys them based on matchups.
Among Seattle’s lower-leverage options, former starters Austin Voth and Trent Thornton have hit their stride coming out of the bullpen; the pair lead the staff in relief innings while effectively keeping runs off the board.
It would be easy to chalk all of this up to luck, even within the context of the other recent Mariners teams. Their offense has less thump than it has in previous years, and their bullpen is more reliant on high-leverage studs than an entire stable of them. Yet, they still have the ingredients that have made them so successful in tight games, even if the recipe is a bit different. Besides, maybe a slight variation is a good thing. After all, in recent years the best the Mariners could do was secure one AL Wild Card berth. Now, for the first time in their fun differential era, they are in position to ride their recipe for success all the way to a division crown.
The National League playoff picture continues to grow each week. There are now nine teams within two games of each other at the back of the Wild Card race and just two teams in the entire league who can convincingly be considered out of the race entirely. That has all the ingredients for a dramatic playoff chase this summer.
This season, we’ve revamped our power rankings. The old model wasn’t very reactive to the ups and downs of any given team’s performance throughout the season, and by September, it was giving far too much weight to a team’s full body of work without taking into account how the club had changed, improved, or declined since March. That’s why we’ve decided to build our power rankings model using a modified Elo rating system. If you’re familiar with chess rankings or FiveThirtyEight’s defunct sports section, you’ll know that Elo is an elegant solution that measures teams’ relative strength and is very reactive to recent performance.
To avoid overweighting recent results during the season, we weigh each team’s raw Elo rank using our coinflip playoff odds (specifically, we regress the playoff odds by 50% and weigh those against the raw Elo ranking, increasing in weight as the season progresses to a maximum of 25%). As the best and worst teams sort themselves out throughout the season, they’ll filter to the top and bottom of the rankings, while the exercise will remain reactive to hot streaks or cold snaps.
First up are the full rankings, presented in a sortable table. Below that, I’ve grouped the teams into tiers with comments on a handful of clubs. You’ll notice that the official ordinal rankings don’t always match the tiers — I’ve taken some editorial liberties when grouping teams together — but generally, the ordering is consistent. One thing to note: The playoff odds listed in the tables below are our standard Depth Charts odds, not the coin flip odds that are used in the ranking formula.
Complete Power Rankings
Rank
Team
Record
Elo
Opponent Elo
Playoff Odds
Power Score
Δ
1
Yankees
50-24
1615
1510
99.8%
1629
0
2
Orioles
47-24
1597
1495
98.5%
1611
1
3
Phillies
47-24
1576
1480
99.4%
1594
-1
4
Dodgers
44-29
1560
1492
99.1%
1576
0
5
Mariners
43-31
1562
1495
86.1%
1576
1
6
Guardians
44-25
1547
1480
81.7%
1563
-1
7
Brewers
42-29
1541
1496
83.1%
1556
1
8
Twins
40-32
1536
1489
73.9%
1536
2
9
Braves
38-31
1525
1496
89.1%
1530
0
10
Royals
41-32
1527
1507
48.5%
1530
-3
11
Red Sox
37-35
1519
1510
21.9%
1506
7
12
Cardinals
35-35
1511
1493
35.4%
1503
2
13
Blue Jays
35-36
1511
1505
18.2%
1494
3
14
Mets
33-37
1508
1519
26.0%
1493
9
15
Giants
35-37
1499
1498
32.4%
1488
-3
16
Astros
33-39
1508
1504
34.1%
1486
-3
17
Nationals
35-36
1493
1506
3.1%
1485
8
18
Padres
37-38
1493
1505
45.0%
1484
-7
19
Reds
34-37
1497
1499
20.4%
1484
-4
20
Diamondbacks
35-37
1493
1490
33.9%
1483
-3
21
Pirates
34-37
1482
1494
11.3%
1471
-2
22
Rays
34-38
1484
1495
12.8%
1465
-1
23
Tigers
34-37
1471
1492
11.9%
1455
-3
24
Rangers
33-38
1471
1503
12.4%
1455
-2
25
Cubs
34-38
1457
1497
21.8%
1446
-1
26
Angels
28-43
1456
1515
0.4%
1435
0
27
Marlins
23-48
1414
1511
0.0%
1396
0
28
Rockies
25-46
1407
1504
0.0%
1390
1
29
Athletics
26-48
1383
1505
0.0%
1368
-1
30
White Sox
19-54
1356
1513
0.0%
1344
0
…
Tier 1 – The Best of the Best
Team
Record
Elo
Opponent Elo
Playoff Odds
Power Score
Yankees
50-24
1615
1510
99.8%
1629
Orioles
47-24
1597
1495
98.5%
1611
Phillies
47-24
1576
1480
99.4%
1594
The Yankees lost their weekend series against the Red Sox, and even though they won three of four from the Royals earlier in the week, their lead in AL East was trimmed to just a game and a half. They’ll host the Orioles, the team chasing them, in a huge three-game set this week. They’re also expected to activate Gerrit Cole from the IL this week, giving them a major reinforcement in time for this tough stretch of games.
The Orioles managed to pull closer to the Yanks by winning their series last week against the Braves and the Phillies. They’ve gone 14-6 during one of the most difficult stretches of their schedule and have matchups with the Yankees, Astros, Guardians, Rangers, and Mariners still to come over the next few weeks.
Maybe the jet lag from their trip to London impacted the Phillies, as they lost both of their series last week, first against the Red Sox at Fenway and then to the Orioles in Baltimore over the weekend. To make matters worse, J.T. Realmuto finally decided to undergo knee surgery after dealing with nagging pain all season long. Because they have such a large lead in the NL East, they can afford to lose their starting catcher for a month or two with the long range view in mind. Thankfully, as one of their team leaders hits the IL, another — Trea Turner — is set to return on Monday.
Tier 2 – On the Cusp of Greatness
Team
Record
Elo
Opponent Elo
Playoff Odds
Power Score
Dodgers
44-29
1560
1492
99.1%
1576
Mariners
43-31
1562
1495
86.1%
1576
Guardians
44-25
1547
1480
81.7%
1563
Brewers
42-29
1541
1496
83.1%
1556
The Dodgers had an absolutely terrible Sunday despite shutting out the Royals 3-0 to win their weekend series. First, Yoshinobu Yamamoto had to be removed from his start with a shoulder issue. Then, in the seventh inning, Mookie Betts took a fastball off his hand, fracturing it. It’s too early to tell when they will return, but they are expected to miss at least several weeks. Los Angeles has a commanding lead in the NL West but there’s suddenly an opportunity for any one of the Padres, Giants, or Diamondbacks to gain some ground.
The Mariners might have shut the door on the rest of the AL West this weekend after sweeping the Rangers to extend their division lead to 8.5 games, the largest in the majors. They’re now 17-5 against their division this year, the best intra-divisional record in baseball, and they’re also 27-12 at home. In those three games against Texas, Seattle’s starters allowed just two earned runs, both of which were scored in the first inning of the first game of the series on Friday. Luis Castillo, George Kirby, and Logan Gilbert were absolutely masterful, giving fans a taste of what this rotation could be capable of in a short playoff series.
The Guardians and Mariners meet for a big series this week that, although it’s early, could have some implications for AL playoff seeding. Cleveland has been cruising along atop the AL Central for pretty much the entire season, but it has a bit of a gauntlet coming over the next two weeks; the Guardians host Seattle and Toronto this week before heading off to Baltimore for a three-game set and then a big four-game series in Kansas City.
The Brewers continue to find ways to win despite their patchwork rotation that has been wracked by injuries. A big reason why they’ve been so successful is because of their shutdown bullpen, which is still missing its best member, Devin Williams. The rest of the NL Central is a pretty big mess of clubs sitting around .500, so Milwaukee shouldn’t have much trouble getting into the playoffs, but the team will need some sort of upgrade in the rotation if it wants to make some noise once it gets there.
Tier 3 – Solid Contenders
Team
Record
Elo
Opponent Elo
Playoff Odds
Power Score
Twins
40-32
1536
1489
73.9%
1536
Braves
38-31
1525
1496
89.1%
1530
Royals
41-32
1527
1507
48.5%
1530
On May 26, the Royals had an eight-game win streak snapped; they’ve gone 7-13 since then and have won just one series during that rough stretch. They couldn’t keep up with the Yankees and Dodgers last week, losing both of those series, and they’re now just a half-game ahead of the surging Twins. For their part, the Twins have won five straight, and Carlos Correa and Royce Lewis erupted for 27 hits and seven home runs between the two of them last week.
Speaking of offensive resurgences, the Braves have scored 28 runs over their last four games and might be looking a little closer to the powerhouse offense we all expected they would be this year. Austin Riley has homered in three straight games, and they blasted nine home runs off the Rays pitching staff last weekend.
Tier 4 – The NL Melee
Team
Record
Elo
Opponent Elo
Playoff Odds
Power Score
Cardinals
35-35
1511
1493
35.4%
1503
Mets
33-37
1508
1519
26.0%
1493
Giants
35-37
1499
1498
32.4%
1488
Nationals
35-36
1493
1506
3.1%
1485
Padres
37-38
1493
1505
45.0%
1484
Reds
34-37
1497
1499
20.4%
1484
Diamondbacks
35-37
1493
1490
33.9%
1483
Pirates
34-37
1482
1494
11.3%
1471
Cubs
34-38
1457
1497
21.8%
1446
This tier has grown enormous. These nine teams are hovering right around .500 and sitting within two games of each other, but only two of them will be able claim NL Wild Card spots — assuming Atlanta maintains its hold on this race.
The two teams who really launched themselves up the standings last week were the Nationals and Mets. Washington ended the week tied for the final Wild Card spot after winning a series against the Tigers and sweeping the Marlins. Expanding our lens a bit to underscore how well the Nats have been playing recently, they have the third-best record in the National League (14-9) since May 24, with six of those 14 wins coming in their eight games against the Braves.
The Mets’ surge has been even more improbable. They won their fifth straight game on Sunday to finish off a weekend sweep of the Padres and are now just a game and a half out in the Wild Card race. Closer Edwin Díaz recently returned from the IL to bolster their bullpen and their offense has been much better this month after a dismal May.
If the Mets and Nats are the teams trending up, it’s the Cubs who are on the way down. Their offense is in such desperate need of a spark that they bunted on three straight plays in a game last week and produced two runs through the effort — yet they wound up losing 3-2 after the bullpen blew the lead. They have the worst record in the NL since the calendar flipped to May and have scored just 3.55 runs per game during this extended slump.
Tier 5 – The AL Melee
Team
Record
Elo
Opponent Elo
Playoff Odds
Power Score
Red Sox
37-35
1519
1510
21.9%
1506
Blue Jays
35-36
1511
1505
18.2%
1494
Astros
33-39
1508
1504
34.1%
1486
Rays
34-38
1484
1495
12.8%
1465
Tigers
34-37
1471
1492
11.9%
1455
Rangers
33-38
1471
1503
12.4%
1455
Over in the American League, the playoff picture is a lot more settled. Below the top six teams in the league, the Red Sox and Blue Jays are barely hanging on in the Wild Card race. Both of those teams won statement series last weekend, with Boston beating the Yankees and Toronto surviving a series against the Guardians. The Sox and Jays are set to play each other six times over the next 10 days, each looking to sabotage the other’s summer hopes.
It looks like the Rangers will be getting Max Scherzer back this week from the IL, a stint that was prolonged when he hurt his finger while rehabbing from his back injury. His return couldn’t come soon enough. After getting swept over the weekend by the Mariners, Texas is now 8.5 games back in the AL West and 6.5 out of the final Wild Card spot. When the Rangers entered the season with Scherzer, Jacob deGrom, and Tyler Mahle all on the IL, they were taking a risk that something like this would happen without their rotation at full strength, but I don’t think they expected things to get this bad.
Tier 6 – Hope Deferred
Team
Record
Elo
Opponent Elo
Playoff Odds
Power Score
Angels
28-43
1456
1515
0.4%
1435
Marlins
23-48
1414
1511
0.0%
1396
Rockies
25-46
1407
1504
0.0%
1390
Athletics
26-48
1383
1505
0.0%
1368
With Kris Bryant’s season — and possibly career — looking like a complete loss because of some unfortunate injury issues, the Rockies need to start focusing on their young building blocks. Luckily, Ezequiel Tovar and Brenton Doyle are showing plenty of life with their bats to compliment their already stellar glovework. Colorado also called up top prospect Adael Amador recently and activated Nolan Jones off the IL last week. The Rockies have an opportunity to play the part of pesky little brother to a beat-up Dodgers squad in a four-game series in Colorado this week.
Tier 7 – The White Sox
Team
Record
Elo
Opponent Elo
Playoff Odds
Power Score
White Sox
19-54
1356
1513
0.0%
1344
The White Sox wound up losing three of four to the Mariners last week, but they really made Seattle work for each of those wins. Two of the losses were walk-offs, the third was given away in the seventh, and the lone Chicago victory came in extra innings. But make no mistake: This is a truly terrible team. The White Sox have fielded a roster of position players who have combined for -1.8 WAR this year, a full-season pace of -4.0 WAR. That would make them the least-valuable group of position players since the 1998 Twins (-4.5 WAR). No club has combined for -1.0 WAR from its hitters since the 2003 Tigers (-1.2), who finished 43-119 that season. On the bright side, Luis Robert Jr. has blasted five home runs in 12 games since being activated off the IL; yet fittingly for such a moribund franchise, Robert has struck out in almost half his plate appearances, too.
After a year of caressing hopes for a triumphant return of José Abreu’s salad days, the Astros released the veteran first baseman on Friday, ending his disappointing tenure in Houston. It would be an understatement to say the 37-year-old Abreu struggled this season; across 35 games, he batted .124/.167/.195 with two home runs, for an wRC+ of 2 and a WAR that I won’t repeat due to the possibility of children reading. The Astros still owe Abreu a hair under $31 million of the three-year deal he signed soon after the 2022 season, though they’ll be on the hook for slightly less than that if another team signs him for the pro-rated league minimum.
If David Ortiz’s magnificent final season represents the optimal scenario for a beloved veteran slugger to reach retirement, then Abreu’s time with the Astros exemplifies the other far end of the spectrum. During his nine years with the White Sox, from 2014-22, Abreu was one of the most consistent sluggers in baseball, batting .292/.354/.506 with 243 home runs, a 133 wRC+, and 28.3 WAR. He had five 30-homer seasons, and that doesn’t include the shortened 2020 campaign, when he smacked 19 longballs, a full-season pace of 51, en route to winning the AL MVP award. With Chicago, he also earned AL Rookie of the Year honors (2014), made three All-Star teams (’14, ’18, ’19), and won three Silver Sluggers (’14, ’18, ’20). When he became a free agent after his age-35 season and the White Sox didn’t show much interest in bringing him back, Abreu quickly signed with the Astros, who had won the World Series a few weeks earlier.
It seemed like the ideal destination for his three-year autumnal epilogue. Houston wasn’t counting on him to be the centerpiece of the lineup; rather, his role would be to shore up first base and/or designated hitter for a few years and support stars like Kyle Tucker, Yordan Alvarez, Jose Altuve, and Alex Bregman. With the Astros coming off a 106-win season and a World Series championship, with many of their core players returning, it certainly appeared that his new team would provide Abreu a better chance to win a ring than he would’ve had with the clearly fading White Sox. To get an idea of what the reasonable expectations were for Abreu when he signed with Houston, let’s look at his three-year ZiPS projections heading into the 2023 season:
ZiPS Projection – José Abreu (Before 2023)
Year
BA
OBP
SLG
AB
R
H
2B
3B
HR
RBI
BB
SO
SB
OPS+
DR
WAR
2023
.279
.351
.451
537
73
150
33
1
19
86
49
124
1
120
-1
2.4
2024
.269
.340
.427
475
60
128
28
1
15
71
42
114
0
111
-1
1.4
2025
.260
.332
.410
407
50
106
23
1
12
57
36
103
0
104
-2
0.8
While ZiPS was skeptical that Abreu would be an everyday starter for all three years in Houston, it broadly thought he would be an adequate average-ish option for a year or two. Abreu got off to a wretched start last year, hitting .214/.262/.253 with no home runs through May 14 while starting 39 of the team’s first 40 games. As I wrote last April, there wasn’t even a hint that his struggles were a fluke; his plate discipline had deteriorated and his power evaporated like a puddle after a July thunderstorm in Texas.
There are some highly concerning issues in Abreu’s early-season profile this year that weren’t present in other early starts. When he struggles, he still generally hits the ball extremely hard. This year, his exit velocity has averaged 86.6 mph with an overall hard-hit rate of 36.7% — extremely low numbers for him. He was lousy last April, hitting .217/.308/.348, but he was still crushing pitches he connected with, resulting in a 94.6 mph average EV and a hard-hit rate of 59.6%. He also struggled in April 2021, hitting .213/.296/.394, but with a 92.1 mph EV and a 53.7% hard-hit rate — not quite as good as 2022, but worlds better than where those numbers currently stand. He got off to good starts in 2018 and ’19, so they’re not particularly helpful, and he crushed the ball in August of 2020 (I did not include any 2020 seasons in the April numbers, as the year was just too weird).
Abreu played somewhat better over the rest of the 2023 campaign, hitting .246/.309/.435 with 18 homers across 102 games and capping things off with four homers in the postseason. Rather than taking Abreu’s early-season woes as a warning that the end was near, the Astros proceeded to do very little to pick up another bat over the offseason; their biggest move to add some boom to the lineup came when they acquired Trey Cabbage from the Los Angeles Angels. Given Houston’s ALCS elimination at the hands of its cross-state rivals, the Texas Rangers, and its 90-72 record being its weakest since 2016, it’s hard to guess why the Astros took such a lackadaisical approach to a possible issue. Whether it has to do with the front office overhaul after James Click left is a topic for another day.
This season started off even worse for Abreu. He hit .111/.161/.123 with no homers, for an OPS (.284) that was even lower than the career OPS of Hall of Fame pitcher/extremely awkward hitter Randy Johnson (.305). His exit velocity numbers looked a lot like they did the previous April, and he failed to hit a single barrel. Things were so rough that Abreu agreed to be optioned to the minors to figure things out, leading to the rather odd sight of a former MVP debuting in the minors at age 37; he went straight to the majors 10 years ago after the White Sox signed him as an international free agent out of Cuba, and he never even played in the minors on an injury rehab assignment. Abreu did get back to Houston after a stint in Rookie-ball and a couple games with Triple-A Sugar Land, and he even hit two homers this month. But the writing was on the wall, and with the Mariners finally putting some space between them and the rest of the AL West, the Astros clearly could not afford to wait endlessly for another revival that may never come.
Over the short term, Jon Singleton is likely to continue to get the majority of the playing time at first base with Abreu out of the picture, but saying Singleton improves the team is damning with faint praise; while it was cool to see him come back to the majors after a decade away, he’s not really a productive major league bat. Singleton turns 33 later this year and is a .183/.294/.322 career hitter in the majors, with projections that rank from terrible (.214/.327/.388 in Steamer, .215/.324/.376 in ZiPS) to even more terrible (THE BAT at .193/.289/.343). Rookie Joey Loperfido would seem to be the obvious in-house solution to replace Abreu, but he’s primarily been an outfielder to this point and the organization hasn’t given him many starts at first base in Triple-A, which seems inconsistent with the idea that the Astros will offer him the next crack at the job. A big improvement here likely would require a larger trade, and I’m frankly not sure the decision-makers in Houston right now are equipped to move swiftly and deftly.
What’s next for Abreu? While the natural inclination would be a return to the White Sox, I think that would be a dreadful idea. Mal Tiempo doesn’t bring bad weather to opposing pitchers anymore, and I can’t help but feel that everything good he’ll be remembered for in Chicago is in the past. The Sox need to use their losing season more productively than a farewell tour for Abreu, and a bench bat with the Pale Hose won’t get Abreu one last run in the playoffs. Perhaps the Dodgers will sign him in July and he’ll slug .700 in 100 at-bats in a part-time role, because they’re the Dodgers.
A fun player for a long time and a great leader for the team and his city, Abreu’s almost certainly going to fall short of the Hall of Fame, perhaps even dropping off the ballot after his first year of eligibility. It would be shocking if he added much to his career 263 homers or 26.3 WAR (which is actually two wins less than it was when he left the White Sox), and we’ve yet to see the Hall of Fame voters credit foreign play to get a borderline player over the top. Ichiro Suzuki will easily make the Hall of Fame when he debuts on the ballot in the upcoming election, but that would be the case even if he had never played in Japan. I wrote a little about the possibility of including Abreu’s time in Cuba to evaluate his Hall of Fame case back in 2021, but that was more of a theoretical exercise than a serious expectation he’ll get votes.
No, Abreu is not going out on his best, but the cruelty of time in baseball isn’t that different from life. At some point, all of us will lose our ability to do the things we’re great at, the things we love, and eventually, anything at all. It’s just that as a ballplayer, his transition comes at a relatively younger age under very public scrutiny. I’ve always been a fan of the Orson Welles quote on the subject, and it’s one I’ve said that I’d like to have on my eventual epitaph: “If you want a happy ending, that depends, of course, on where you stop your story.” If this is the melancholy final chapter of the story of Abreu’s baseball career, it was still a volume that was wonderful to read.
The Dodgers took two out of three from the Royals this weekend in Los Angeles, but they suffered a pair of losses that can’t help but prove costly, as injuries felled two of the game’s best players. On Saturday, Yoshinobu Yamamoto left his start after just two innings due to what was initially described as triceps tightness but was later diagnosed as a rotator cuff strain. On Sunday, Mookie Betts suffered a fracture after being hit on the left hand by a 98-mph fastball. Neither injury is season-ending, but both players figure to be out for several weeks.
Yamamoto’s problems are traceable to his June 7 start against the Yankees. He was brilliant in that outing, shutting out the Bronx Bombers on two hits and two walks while striking out seven in a game that remained scoreless until the 11th inning, when Teoscar Hernández’s two-run double proved decisive. Perhaps owing to the adrenaline that comes with pitching in a playoff-like atmosphere, the 25-year-old righty’s four-seam fastball averaged 97.0 mph that night, 1.5 mph above his average in his first season since coming over from Japan after signing a 12-year, $325 million deal last December. He threw his 17 fastest four-seamers and eight fastest sliders while throwing a season-high 106 pitches; it was his fourth straight outing of at least 100 pitches after topping out at 99 in his first nine turns.
Because Yamamoto experienced soreness in his triceps in the wake of that start, the Dodgers pushed back his next outing from Thursday to Saturday; instead, he threw a bullpen on Thursday but did not experience any additional soreness. On Saturday, he did experience some discomfort while warming up, but “it was not that serious at that point,” as he later said through a translator according to the Los Angeles Times‘ Mike DiGiovanna. He told pitching coach Mark Prior after his warmup, “I don’t feel 100%. I don’t feel frisky, but I feel fine.” Read the rest of this entry »
Rick Kranitz has seen a lot of good changeups over the years. A minor league pitcher in the Milwaukee Brewers system for five seasons beginning in 1979, he joined the coaching ranks in 1984 and has been tutoring hurlers ever since. As noted when I talked pitching with him for FanGraphs three years ago, “Kranny” has served as the pitching coach for multiple big league teams, including the one he joined in 2019, the Atlanta Braves.
Unlike our 2021 interview, which covered a variety of pitching topics, this one focuses exclusively on one offering. I sat down with Kranitz to talk changeups when the Braves visited Boston earlier this month.
———
David Laurila: I want to ask you about a pitcher you were with 40-plus years ago, a guy who had a great changeup.
Stan Szeto-USA TODAY Sports; David Reginek-USA TODAY Sports; Brad Penner-USA TODAY Sports
Of all 193 relief pitchers with at least 20 innings pitched this season, exactly three have thrown four distinct types of fastballs a minimum of 20 times each: Reed Garrett, Chris Martin, and Cole Sands. They all have one non-fastball offering, but none of them throw it more than a quarter of the time. Justin Choi wrote recently about the strategic options available to pitchers with more than one fastball, but four? Four whole fastballs? These guys feel like doomsday preppers getting ready for some apocalyptic scenario where money is now worthless and fastballs are the new currency.
But anytime a new strategy pops up in baseball, it’s worth checking to see if the outliers are onto something others should attempt, or if their “one weird trick” to pitching works only for them. Shoot, maybe it doesn’t even work for them all that well. Regardless, we’re gonna get to the bottom of what’s going on with these pitchers and all the fastballs they’re hoarding.
Reed Garrett
Garrett has thrown 34.2 innings for the Mets so far this season, posting a 3.12 ERA and a 3.17 FIP. He’s struck out 37% of the batters he’s faced and walked 12%. His performance this year has earned him an ERA- of 81, firmly better than average. What the averages aren’t telling you is that Garrett started the season with a 0.57 ERA in March and April, a ridiculous run that earned him a full breakdown on his evolution from last season by Ben Clemens on April 23. But that April ERA had to buy new pants after swelling to 6.08 in May. His performance has regressed somewhat in June, settling somewhere between those extremes. The current version of Garrett is probably more representative of what the Mets should expect from him moving forward.
The table below shows a breakdown of Garrett’s pitch repertoire with the usage and a few metrics for evaluating each offering (run value per 100 pitches thrown, xwOBA, Stuff+, and Location+). The two most common fastball types (four-seamers, sinkers) that most pitchers feature at the center of their arsenals are the pitches he throws the least. But the metrics linked to Garrett’s outcomes — either actual outcomes (RV100) or expectations based on the characteristics of the outcomes (xwOBA) — agree with his decision to de-emphasizing those pitches. They like Garrett’s four-seamer the least, even though it has his highest velocity and second best Stuff+. The pitch’s Location+ score reveals its critical flaw: a lack of command. Stuff+, RV100, and xwOBA agree that his sweeper and splitter are his two best pitches. Based on usage, Garrett agrees with that assessment.
Reed Garrett Pitch Type Metrics
Pitch Type
Usage
RV100
wOBA
xwOBA
Stuff+
Location+
Cutter
24.3%
-0.7
0.385
0.340
104
94
Splitter
23.9%
1.7
0.167
0.145
119
93
Sweeper
23.6%
1.5
0.183
0.187
133
106
Four-Seamer
18.7%
-3.9
0.514
0.419
125
84
Sinker
9.5%
-0.5
0.340
0.312
96
93
His pitches mostly hover around league average in terms of individual characteristics, but the sweeper and splitter are both a tick or two harder than average and generate a bit more spin leading to more horizontal break, which is likely why Stuff+ likes them more than the rest of Garrett’s arsenal.
Reed Garrett Pitch Characteristics
Pitch Type
Velo
Horizontal Break
Vertical Break
Spin Rate
Spin Direction
Horizontal Release
Vertical Release
Extension
Cutter
91.1
1.2
4.2
2446
11:00
-2.1
5.5
6.2
Sweeper
84.6
7.1
1.2
2750
9:00
-2.3
5.5
6.2
Splitter
87.4
-7.5
1.8
1544
2:45
-2.1
5.6
6.3
Four-Seamer
96.2
-5.5
9.9
2325
1:00
-1.9
5.7
6.2
Sinker
95.7
-10
6.1
2273
2:00
-2.2
5.6
6.2
He makes the most of middling pitches by playing them off one another. The sweeper and cutter mirror the spin direction of the sinker and the splitter. As a result the pitches look similar out of the hand but fork in four different directions as they approach the plate to keep the hitter guessing (see movement plot below). So even if hitters guess the horizontal direction correctly, they’ve still got two similarly spinning pitches that fan out vertically as they approach the plate.
Garrett deploys all of his pitches no matter the handedness of the hitter, but he does vary the flavor of his approach. To lefties, Garrett likes to fill the zone with his cutter and dangle the splitter down and away when looking for a chase. To righties, he keeps the hitter off balance by throwing the sweeper to a variety of locations, but then comes down and inside at varying speeds with the splitter and the sinker.
The flowchart below gives us an idea of Garrett’s sequencing habits. He tends to start hitters with a cutter or sweeper. Once ahead in the count, he’s more likely to play around on the periphery of the zone with his sweeper and splitter, whereas while behind in the count he rolls with the four-seamer and cutter as more zone-friendly options. The wOBA values for plate appearances passing through each given count indicate the approach works well in early counts and with two strikes, but not as well when the count forces him back into the zone, in part because his four-seam command limits his ability to actually hit the zone with that pitch when circumstances demand it.
Here’s a representative example of how hitters respond to Garrett’s two-strike splitter.
Looking at swing metrics by pitch type, each pitch adds a valuable tool to his kit. The splitter is Garrett’s best combo play for inducing swings (56% swing rate) without courting disaster. The pitch owns his best swinging-strike rate (30%) and second lowest hard-hit rate (20%) when batters do connect. He gets batters to swing at 74% of the sinkers he throws in the zone, he uses the sweeper to induce weak contact (17% hard-hit rate), and turns to the cutter to mix things up. The four-seamer is the weak link in the chain so long as it keeps taking the scenic route to the catcher’s mitt.
Chris Martin
Martin has thrown 21.1 innings for the Red Sox in 2024, logging a 4.22 ERA with a 3.90 FIP. He’s struck out 28.2% of the batters he’s faced while walking just 2.4% of them. He has been on the IL since June 5 while proactively seeking help with anxiety.
Again, we’ll start with a synopsis of each pitch he throws according to the value metrics. Stuff+, RV100, and xwOBA all like his splitter best. The pitch is very similar to Garrett’s splitter from a velo/movement/spin perspective, but he doesn’t throw it nearly as much. His four-seamer is his next best pitch by RV100 and xwOBA, but fourth best by Stuff+. However, he locates it well enough to still get results. Martin’s cutter is his consensus third-best pitch, striking a balance between stuff and command to get the job done. Like Garrett, Martin’s non-fastball pitch is a sweeper, but unlike Garrett, he throws it so infrequently that it’s hardly worth discussing.
Chris Martin Pitch Type Metrics
Pitch Type
Usage
RV100
wOBA
xwOBA
Stuff+
Location+
Cutter
42.4%
-0.7
0.329
0.290
106
111
Four-Seamer
31.8%
0.7
0.297
0.274
93
110
Splitter
15.6%
3.0
0.197
0.249
141
112
Sinker
8.4%
-7.9
0.702
0.855
84
103
Sweeper
1.9%
-9.2
0.592
0.521
103
136
His pitch characteristics all hover around average, thrown maybe a tick or two harder, but with slightly less spin and therefore less movement. What helps overcome somewhat middling profiles is a distinct release point created by his long levers. Though his delivery is composed of a pretty standard three-quarters-ish arm slot, the arm attached to his 6’8” frame allows him to release the ball several inches higher and farther to his right than other pitchers throwing from a similar slot.
Chris Martin Pitch Characteristics
Pitch Type
Velo
Horizontal Break
Vertical Break
Spin Rate
Spin Direction
Horizontal Release
Vertical Release
Extension
Cutter
92.2
-0.2
5.8
2191
11:45
-3.2
6.1
6.5
Four-Seamer
95.1
-6.6
9.4
2186
1:15
-2.9
6.2
6.5
Splitter
88.2
-7.0
1.7
1507
2:45
-3.1
6.1
6.6
Sinker
94.2
-9.6
6.2
2098
2:00
-3.1
6.0
6.6
Rather than mirroring the spin on his offerings like Garrett, Martin takes a different approach to cultivating deceit. The puzzle for his hitters is more akin to spotting the difference between two nearly identical photos. All of Martin’s pitches spin in a similar direction, and his four-seamer, sinker, and cutter do so at almost the same spin rates. Where they differ is in the amount of active spin, or the amount of spin contributing to the pitch’s movement. The four-seamer, as one might expect, has the most active spin and the most rise. The sinker has a little less active spin and creates more horizontal break and more drop. The cutter drops in a comparable fashion to the sinker, but refuses to follow his fellow fastballs and break toward the third base side. Then there’s the splitter that spins at a much slower rate and with less active spin, which translates to roughly the same amount of horizontal movement as his four-seamer, but with even more drop than the sinker. Yet another carbon copy, but with a small but crucial edit.
Martin uses the same theory to guide his approach to both righties and lefties: Fill the zone with the primary fastball(s), use one of the secondary fastballs as a threat inside, and pepper the bottom of the zone with splitters. Against right-handers the four-seamer and cutter are the pitches he consistently throws to all parts of the zone and the sinker backs the hitter off the inner half of the plate. Against left-handers, Martin stays away from the sinker, so the cutter becomes the weapon he aims inside, while the four-seamer and the splitter maintain their existing roles.
The job of each fastball is further etched in stone by Martin’s sequencing, visualized below. He starts an overwhelming majority of hitters with the four-seamer or cutter and sticks to those zone-friendly pitches if he falls behind in the count. But if he gets ahead, Martin starts mixing in the splitter and sinker. His results tend to be better if he gets to those splitter/sinker counts, but it’s unclear whether that’s because of the effectiveness of those pitches or because he gets too predictable in unfavorable counts.
The swing metrics indicate Martin’s cutter is his best option for getting swings (55% swing rate) that lead to either strikes (13% swinging-strike rate) or weak contact (27% hard-hit rate). The splitter is his overall best bet for a swinging strike (19%), but when hitters do make contact, it yields the highest hard-hit rate (70%). The sinker is most effective when thrown in the zone because it has the lowest out-of-zone swing rate (18%) and in-zone contact rate (78%) compared to Martin’s other offerings. And avoiding contact is key, since the sinker has the second highest hard-hit rate (67%) of the bunch.
Cole Sands
Sands has pitched 32 innings for the Twins this season. Those innings have amounted to a 4.22 ERA and a 3.30 FIP. His strikeout rate sits at 28% and his walk rate is a measly 3%. Sands’ season trajectory mimics Garrett’s: on a rocket to the moon in April, a crash landing in May, and now back up and cruising at altitude in June. At his peak, Sands was striking out Shohei Ohtani on three pitches, and Minnesota was considering stretching him out to start while managing injuries in the rotation; now he’s settled into a multi-inning relief role.
Digging into Sands’ repertoire via the pitch evaluation metrics, his cutter, curveball, and splitter all clock in right around average according to Stuff+, but RV100 favors the four-seamer and hates the curve and split. Comparing the curveball’s xwOBA (.305) to its wOBA (.372) suggests the pitch’s actual outcomes have been a bit unlucky compared to what’s expected based on the batted ball characteristics, which in turn is likely deflating its RV100. Meanwhile the four-seamer and sinker both have better wOBAs when compared to their xwOBAs, suggesting some good luck has swung their way and their RV100s might be a little full of themselves. Luck doesn’t explain the metrics’ diverging opinions on the splitter, suggesting something is amiss with Sands’ execution. Hopefully, this contradiction will untangle itself as we proceed.
Cole Sands Pitch Type Metrics
Pitch Type
Usage
RV100
wOBA
xwOBA
Stuff+
Location+
Cutter
27.3%
1.0
0.358
0.352
96
98
Four-Seamer
24.4%
3.7
0.165
0.200
77
103
Curveball
21.0%
-2.4
0.372
0.305
102
102
Splitter
17.9%
-2.3
0.268
0.355
104
107
Sinker
9.4%
3.5
0.264
0.416
79
94
In terms of the movement profile broken down in the table below, Sands, like Garrett, mirrors the spin of his breaking ball relative to the four-seamer, sinker, and splitter in an attempt to disguise their true identities until it’s too late for the hitter to react. And concealing those identities is necessary because, as with the other two pitchers, Sands’ pitch characteristics are far more average than overpowering. The furthest he deviates from average is with his extension, but unfortunately he deviates in the wrong direction. His 5.8-foot extension puts Sands roughly six to eight inches below league average. Releasing the ball farther from home plate gives the hitter more of a chance to identify the pitch’s trajectory, which likely explains the lower Stuff+ scores relative to what Garrett and Martin receive for comparable pitches. And while we’re talking pitch trajectory, the extra couple inches of drop on his splitter relative to an average right-handed offering of the pitch might be too much of a good thing; at times it dives too far, too quickly to really tempt hitters.
Cole Sands Pitch Characteristics
Pitch Type
Velo
Horizontal Break
Vertical Break
Spin Rate
Spin Direction
Horizontal Release
Vertical Release
Extension
Cutter
90.7
-0.8
5.0
2452
12:00
-2.6
5.8
5.7
Four-Seamer
95.5
-7.4
8.0
2273
1:30
-2.5
5.9
5.7
Curveball
82.6
6.6
-2.7
2754
8:00
-2.7
5.6
5.6
Splitter
87.8
-8.7
0.0
1407
3:15
-2.6
5.8
5.8
Sinker
94.4
-10.3
4.4
2224
2:15
-2.6
5.8
5.7
How the pitches move relative to one another is basically a hybrid of what we’ve seen so far from Garrett and Martin. The fastballs land on the movement plot in roughly the same orientation as the other two, aside from being stretched more vertically. Sands’ curveball operates similarly to Garrett’s sweeper, just with more drop.
Like Martin, Sands doesn’t throw his sinker to lefties, but beyond that omission, Sands attacks hitters in the exact same manner regardless of handedness. He aims to fill up the zone with his four-seamer, works arm side with the cutter and sinker, and keeps the ball down and/or to the glove side with the splitter and curve.
Sands mostly sticks to the standard sequencing playbook, but he’ll reach for any of his non-splitter offerings to begin a plate appearance. If he gets ahead, expect a heavy mix of splitters and curveballs; if he falls behind, expect him to thrown mostly cutters and four-seamers. His adequate command keeps him competitive, since even after falling behind, the average outcomes remain respectable and in line with the more favorable counts.
The swing metrics suggest Sands’ cutter is his best option for inducing weak contact (51% swing rate, 32% hard-hit rate), the four-seamer has the lowest in-zone contact rate (80%) to pair with the second highest in-zone swing rate (71%), and the curveball is best for forcing swings out of the zone (35%) that lead to either a strike (14% swinging-strike rate) or weak contact (25% hard-hit rate).
***
With the four-fastball approach to relief pitching now fully dissected on the lab table before us, I can’t truly say we’ve discovered the next big thing that pitchers everywhere will be rushing to replicate. Though Garrett, Martin, and Sands are the only three relievers doing this out of almost 200, their approach is not as novel as those numbers suggest. What they’re actually doing is leaning on all of the classic pitching fundamentals: changing the hitter’s eye level, attacking the zone to get ahead in the count and then make the hitter chase, varying speeds, varying locations, keeping the hitter off balance. Most relievers execute these fundamentals using one or two overpowering pitches, or in lieu of dominant stuff, they cobble together a few crafty junk pitches. Garrett, Martin, and Sands pitch as if they were junkballers, but instead of throwing knuckleballs or Bugs Bunny changeups, they take their collection of middling fastballs and deploy them as junkballs. They mix and match movement profiles and velocities so hitters can’t sit on certain pitches or locations. They do all the same stuff every pitcher does; they just dress it up a little different. Which in and of itself is novel enough to still be impactful. After all, 10 Things I Hate About You is a singularly great movie, but it’s also a classic Shakespeare play, just dressed up a little differently.