Ben Lindbergh and Meg Rowley banter about Vladimir Guerrero Jr.’s big bonus, Edmundo Sosa’s beginner’s home run robbery, how much of a difference depth makes, and the relative levels of alarm about the shoulder injuries of Reynaldo López, Victor Robles, and Blake Snell. Then (49:14) they talk to MLB.com’s Michael Clair about what it was like to attend the amateur baseball event of the year: the Division III showdown between Yeshiva and Lehman, who entered their Wednesday doubleheader on the two longest active losing streaks in college baseball.
This seems like an apt moment to reexamine the concept of value. What is a relief pitcher worth? What is anything worth? The context matters quite a bit. In boom times, when you can barely remember a past in which the arrow pointed any direction but up, the upside feels so real that it’s hard to resist. Sure, a premier setup man with a short track record is a luxury, but what’s the harm in splurging? In the darker times, when the eggs sitting in your refrigerator have suddenly gone from basic staples to commodities so precious that you can’t afford to waste them on something as trivial as breakfast, you need to hunt for value wherever you can find it.
For an Astros team determined to reset its luxury tax penalty, that means trading away reliever Rafael Montero and eating 72% of the money remaining on his contract in order to be free of the other 28%. For the Braves, reeling from a series of early-season setbacks, that means taking a chance on the discounted Montero and his untested splitter in exchange for a player to be named later. Read the rest of this entry »
Early enough in the season, you’ll find some weird stats. This is a well-established fact of baseball in April. There’s even a song about it. As I write this on Tuesday afternoon, Kyle Tucker leads the league in position player WAR, with Aaron Judge third and Corbin Carroll fifth; if the leaderboard looked like that at the end of September, it’d probably be a mild surprise — a highly, highly lucrative one for Tucker — but nobody would write a book about how weird the 2025 season was or anything.
But Wilyer Abreu is second in WAR and Tyler Soderstrom is fourth. Both of them are promising young players, but nobody worth listening to had either one in the preseason MVP discussion.
In short, these things will shake out soon enough. There was an old saying to that effect: Baseball season hasn’t really started until Mike Trout leads the league in WAR. Read the rest of this entry »
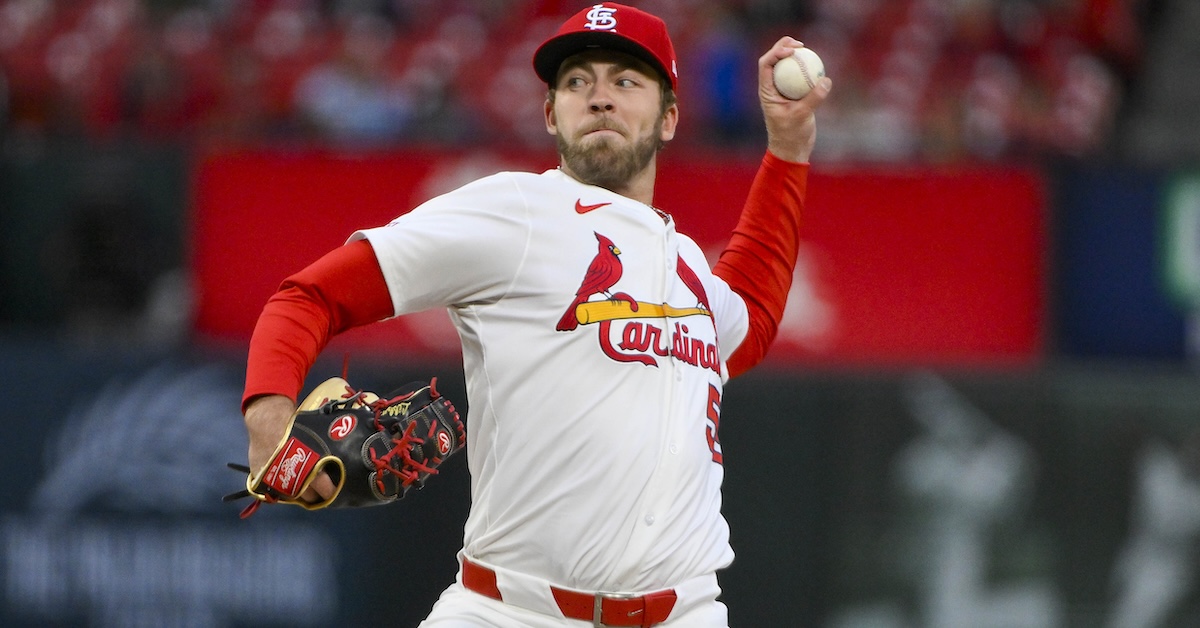
Matthew Liberatore was ranked eighth in one of the game’s top-rated farm systems when our 2019 Tampa Bay Rays Top Prospects list was released that January. Drafted 16th overall the previous summer out of Glendale, Arizona’s Mountain Ridge High School, the now 25-year-old southpaw was assigned a 50 FV by Eric Longenhagen and Kiley McDaniel. Twelve months later, Liberatore was no. 3 — still with a 50 FV — on our 2020 St. Louis Cardinals Top Prospects list, which was published a week after Liberatore was traded to the NL Central club in a multi-player deal that included Randy Arozarena.
What did Liberatore’s 2019 and 2020 scouting reports look like? Moreover, what does he think of them all these years later? Wanting to find out, I shared some of what Eric and Kiley wrote and asked Liberatore to respond to it.
———
January 2019:
“He was arguably the best high school pitcher in the class, evaluated heavily early on by the Giants (who picked second), before settling into the 7-13 range by June.”
“That’s pretty cool,” Liberatore replied. “I was highly scouted in my senior year — I think I had over 100 scouts at my first start — so I wouldn’t say it was one team in particular. I knew that I was going to be scouted through the first round, but there wasn’t necessarily any indication, right up until the draft, as to who was going to take me.”
“When [Kyler] Murray was selected, teams picking behind Oakland suddenly had access to one more player than they had anticipated… Other teams hadn’t considered the possibility that Libby would fall to them and either hadn’t done a lot of background work, or weren’t comfortable with how he might alter their bonus pool math.”
“I definitely thought the A’s were a possibility, and I was also told the Pirates were a possibility,” Liberatore recalled. “A couple minutes before the pick, we got a phone call saying [the A’s] chose to go another direction. I found out it was Kyler Murray. I figured he was probably going to go in the first round of the NFL draft in a couple of months, so I was definitely surprised by that. But I grew up going to Tampa every summer to visit family, and had been to plenty of Tampa Bay Rays games throughout my life, so to end up going to them at 16 ended up working out pretty well for me.”
“When Liberatore was at his best, he’d throw strikes with 93-97 for the first several innings of his starts, show you a 70 curveball, a good change, and alter the timing of his delivery to toy with hitters.”
“Pretty similar to now,” Liberatore opined. “I don’t necessarily quick pitch or do the hesitation to alter the hitter’s timing as much anymore, but that’s definitely not something that I’m crossing off the list. So, pretty similar scouting report to how I pitch now.”
“At other times, he’d sit 88-92 with scattershot command and get too cute with Johnny Cueto shenanigans.”
“Hmm. I mean, I’m not going to agree with that, necessarily,” Liberatore said. “You have days where you feel really good and go out there with your best stuff, and then you have days where you don’t feel so good and have to find other ways to get hitters out. If you look at my numbers in high school, I did a pretty good job of doing that. So, I wouldn’t say I got too cute with anything.”
Asked if he could directly address the Cueto comp — the way the veteran hurler will sometimes shimmy and turn before delivering a pitch — Liberatore said it was all about disrupting timing.
“Why do guys throw a breaking ball or a changeup?” he replied. “It’s all about altering timing, and that’s another way to do that. Some scouts didn’t like it. I had a guy come into my house and tell me to quit doing that. But if it gets outs it gets outs, and Johnny Cueto was doing it at the highest level of the game. And there are other guys that do the same thing. I don’t think that it ever hurt me at all.
“I actually used it as a reset a lot of times. If my regular delivery wasn’t working, I could go to one of those and find the right feel to lock me back in, sync me back up. I never viewed it as trying to trick the hitter outside of it being no different than throwing a changeup or a breaking ball to throw off the hitter’s timing. I mean, I’ve definitely toned it down since then. I do it rarely, but like I said before, it’s certainly not something I’m going to get away from forever.”
———
January 2020:
“Because Liberatore’s fastball has sinker movement, the growth of this changeup is going to be the most important aspect of his development, since those two pitches have similar movement and will theoretically tunnel better.”
“I throw two different fastballs,” Liberatore said. “One of them has sinker movement, and one of them is a little more hoppy. I think the development of the cutter has been bigger than the development of the changeup for me. Being able to own the inner half of the plate is something that has helped me quite a bit.
“I’ve thrown both my whole life. The two-seam, if you look at it in a vacuum, is a pretty average analytical pitch. But it plays off the rest of my arsenal. It doesn’t sink, but it runs into left-handers so I’m able to show them a slight difference in shape without having to change the velocity.”
“His knockout curveball has all-world depth… it’s the type of pitch that’s hard to hit even if you know it’s coming, but it might be easy to lay off of in the dirt, because its Loch Ness hump is easy to identify out of the hand.”
“Yeah. I think it all depends on how you use your other stuff around it,” Liberatore said. “If you throw any pitch every single time, it’s going to be easier to pick up. That’s why I’ve always kept that four-seam fastball, to be able to show guys something up in the zone, to tunnel off of that curveball. Yeah, it can be easy to lay off at times, but if I start landing it for a strike you have to honor it. I think it can definitely be a knockout pitch for me.”
“The total package should result in an above-average big league starter.”
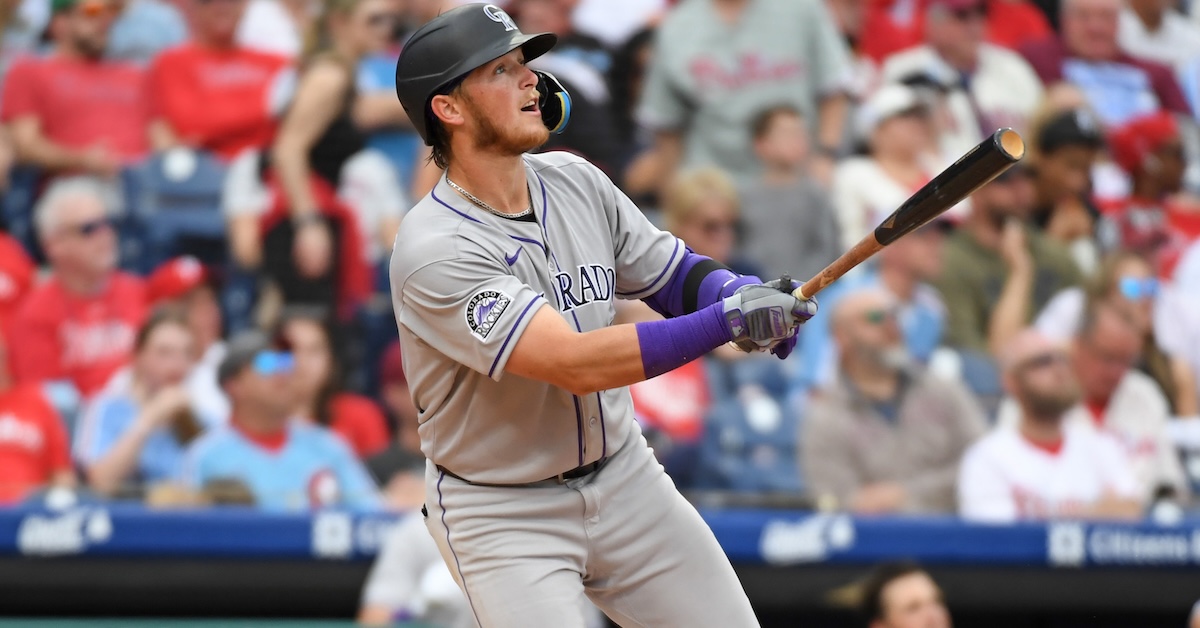
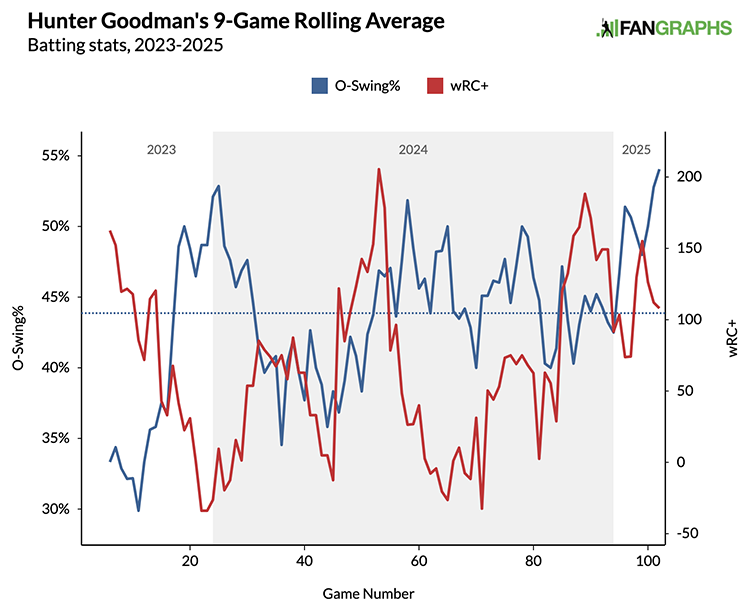
Hunter Goodman isn’t going to chase forever. We’re not even two weeks into the season. All the players with .400 batting averages will come back down to earth, and so will Goodman and his 54.1% chase rate. That’s right, I said 54.1%. If you’re a pitcher who misses the strike zone, odds are Goodman will help you out by swinging anyway. Sports Info Solutions has been tracking pitches since 2002, and in that time, no qualified player has ever run a 50% chase rate over the course of a whole season. Hanser Alberto reached 54% during the short 2020 season and Ceddanne Rafaela gave it his best effort in 2024 with a 49.5% mark (just ahead of 2023 and 2025 Salvador Perez), but that’s it. Goodman won’t stay above 50% either, but he is on a record pace at the moment, and his 66.1% overall swing rate is even further ahead of Randall Simon’s all-time record of 63.6% in 2002.
I’m less interested in whether or not Goodman will set a record – he probably won’t – and more interested in what’s going on with him right now. Coming into the season, his career chase rate was 42.8%. That’s plenty high, and it included some nine-game stretches in which he at least approached this level. But for the most part, when he was chasing at an extreme rate, his performance cratered, just like you’d expect.
When the blue chase rate line went up, the red wRC+ line went down. But that seemed to change toward the end of the 2024 season. I don’t think it’ll last, but at the moment, Goodman is running a 109 wRC+ despite an appalling dereliction of discernment. It’s not necessarily that he can’t tell the difference between a ball and a strike. As I write this on Tuesday, there are still five qualified players who haven’t walked at all. Goodman is not one of them, nor is he one of the 149 players who’s swung at a pitch in the waste zone. Read the rest of this entry »
Last year, David Appelman and I set about injuring a ton of players. Wait, that doesn’t sound right. Let’s try this again. Last year, David Appelman and I developed a method to use our depth charts projections to simulate how much injuries to the league’s top players might affect each of the teams in baseball. Today, we’re updating that article for the 2025 season. I’ll also present some research I’ve done into how these injury-aware depth charts compare to actual historical seasons.
First, a review of the methodology is in order. If you don’t need an update, or if you simply want to get right to the data, you can skip ahead; the results section is clearly labeled below. We decided to simulate depth by first removing the top X players from a team’s depth chart and then reallocating playing time to fill in the missing plate appearances or innings pitched. We then created a number of rules to make sure that these new depth charts were generated in a reasonable way, at least to the greatest extent possible.
Let’s use the 2025 Phillies as an example. As of the time of our run on April 7, we projected the Phillies for a .545 winning percentage against league average opposition. That projection comes from allocating playing time to each Phillies player according to our depth charts, using blended projections from ZiPS and Steamer to estimate the talent level of those players, and then plugging those projections into the BaseRuns formula to estimate runs scored and runs allowed. But those projections have an obvious weakness: they’re static. Read the rest of this entry »
Ben Lindbergh and Meg Rowley banter about umpires’ surprising preference for full ABS, Rob Manfred’s take on torpedo bats, Vladimir Guerrero Jr.’s $500 million extension, players’ frugal behaviors, precedents for Dennis Santana’s short pants, the Giants’ new City Connect jerseys, and (1:14:31) the Dodgers’ White House trip.
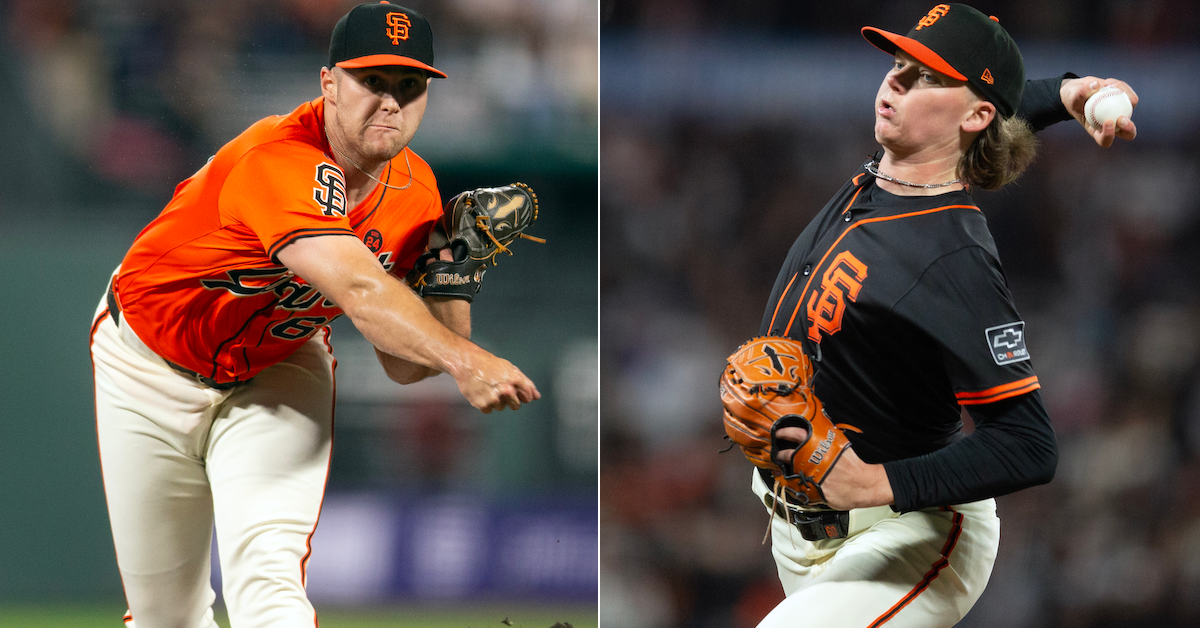
Landen Roupp leans heavily on his high-spin curveball, and Hayden Birdsong is a purveyor of the kick-change. Both pitches profile as plus, which is a big reason the right-handers are being counted on to provide quality innings in their respective roles with the San Francisco Giants this season; Roupp is in the rotation, while Birdsong is working out of the bullpen.
The early results have been promising. The 26-year-old Roupp, who is scheduled to make his second start on Tuesday night against the Cincinnati Reds, made his season debut on April 2 in a 6-3 Giants win over the Houston Astros. The start wasn’t great — he was removed with the bases loaded and nobody out in the fifth inning and was ultimately charged with three runs — but his eight strikeouts were encouraging. Seven of those strikeouts — and none of the four hits he allowed — came against his curveball. He threw his signature offering 34 times in his 83-pitch effort.
Birdsong has thrown four scoreless innings over two relief appearances. One of his four strikeouts has come courtesy of the kick-change, which he has thrown nine times out of 53 total pitches. The 23-year-old, likewise in his second big league season, has primarily attacked hitters with his high-octane heater (56.6% usage).
The stories behind Roupp’s hook and Birdsong’s changeup? I broached the subjects with the right-handers in Giants camps shortly before the start of the regular season.
———
“I’ve thrown it my entire life,” Roupp said of his curveball. “All that’s really different is that I’m getting stronger with more mobility, and learning about the metrics. In college we didn’t have metrics. So, learning ways to make it move more and spin harder… learning and growing into my body has made it a lot better. For me, having confidence in it is the biggest thing.”
A 12th-round pick out of UNC-Wilmington in 2021, Roupp spun his curveball at 3,056 rpm in his April 2 outing, comfortably within the 2,900-3,100 range he’d described to me. Roupp also said that he “gets about 19 to 22 [inches] of horizontal [movement] and something like negative-11 vert” when he is executing properly. Timing is the key. When he’s out of sync with his delivery it doesn’t come out of his hand exactly as he’d like. Picking up a baseball, Roupp showed me his two-seam fastball grip, then rotated the ball just slightly. He explained that he throws his curveball just like his two-seamer, but “with a snap.”
Roupp’s curveball is “pretty slow,” averaging 77.4 mph since the start of last season. He said the speed differential between that and his fastball — his two-seamer averages 93.4 mph — is a big part of its effectiveness. As for its usage, he threw the curve 41% of the time in his first outing, which was slightly less frequently than he did last season (44.1%). With the caveat that one game is nowhere near a large enough sample size to determine what a pitcher’s usage rates will be, that dip was notable given that Roupp told me this spring that his plan was to throw his curve less often this season.
“Coming up through the minor leagues, they were telling me I was throwing it too much,” Roupp said. “That was more about developing my other pitches, though. But while I might throw it 40% of the time, I do think I’m going to lean back a little bit now that I have the changeup and the cutter. The changeup was new last year, and the cutter this year. I want to implement those and get people off my curveball so that it’s even more effective at the big league level.”
———
“I have a high-vert heater with pretty good velo,” Birdsong said when asked to describe his full arsenal. “My curveball is the opposite of my fastball in that it’s just straight down; it’s negative-15 vert when it’s good. My slider is kind of in development and is more of a cutter. My changeup is just my changeup. I started throwing it last year, and it’s developed into one of my better pitches.”
That would of course be the kick-change. The right-hander supposedly learned it at Tread Athletics… except, that’s not true. Birdsong explained that while “everybody says that,” he’s never been to Tread, nor has he talked to anyone who works there. He simply watched a Tread video, then began experimenting with the grip the following day.
“I started playing catch with it — this was in spring training — and I’m not sure I can even remember who my catch partner was,” said Birdsong, whom the Giants took in the sixth round of the 2022 draft out of Eastern Illinois. “It might have been Spencer Bivens. But my changeup had been horrible the year before. It was basically just a bad fastball, a 15-vert slower fastball. That’s all it was. I needed to find another grip, one that wasn’t a splitter — I didn’t want to mess with one of those — so I started looking at videos. That one popped up.”
Birdsong’s previous attempts to find a quality changeup had all been for naught, but when he saw the kick-change, he thought, “Let’s try it.” To his knowledge, he’d never thrown one “under nine vert.” All of a sudden, he had one that was close to zero. The first coach he approached with that news didn’t believe it.
“I was throwing it, and it was tumbling,” Birdsong said. “It was doing what I wanted it to do. I told [bullpen coach Garvin Alston] that I’d thrown a changeup in the bullpen and it was negative vert. He goes ‘No.’ Then he was like, ‘Let me go take a look [at the data].’ I asked him about it the next day and he said, ‘Keep throwing it.’”
As Davis Martin and Matt Bowman explained here at FanGraphs last September, the pitch that Birdsong is now throwing has a close-cousin relationship with the better-known split change. While the name is new, the pitch itself really isn’t.
“I saw the video and called it a spike change,” said Birdsong. “I showed the grip to somebody — I forget who it was — and he was like, ‘Yeah, there are some guys who used to throw that. It’s called a kick-change.’ All it is, really, is that you’re kicking the axis of the ball. Whatever you call it, it works for me.”
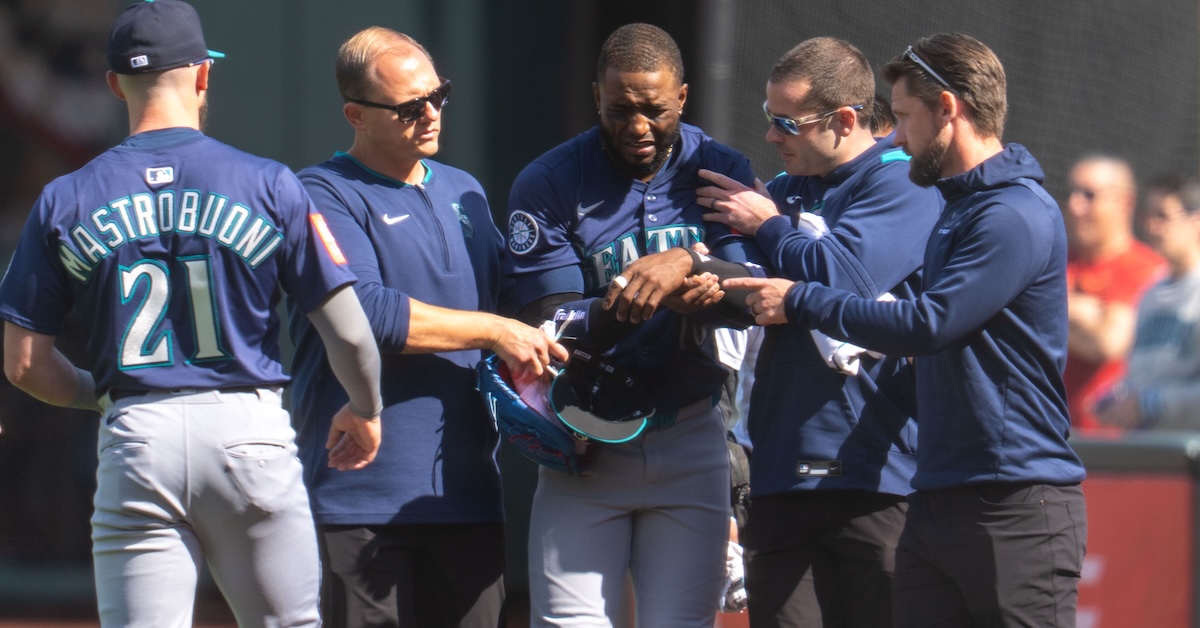
You lose some, and then you lose some. On Sunday at Oracle Park, the Mariners not only fell to the Giants 5-4, but they were forced to remove Victor Robles from the game after he injured his left shoulder making a remarkable catch on the game’s penultimate pitch. His injury is just one of a handful of notable ones suffered in the past several days.
Robles, who broke out last season after being released by the Nationals and signed by the Mariners, had played every inning of every game in right field until the injury. With the score tied 4-4 in the bottom of the ninth, one out, and Luis Matos on first base, Patrick Bailey fouled a drive into the right field corner. Robles sprinted 113 feet, leapt to grab the ball, and then fell over the half-height padded fence and into the netting. After extricating himself, he fell to his knees in obvious pain, rolled the ball to second baseman Ryan Bliss as Matos tagged up and reached third base, and remained on the ground. While he was tended to by Mariners head athletic trainer Kyle Torgerson, Giants manager Bob Melvin challenged the catch ruling, but the call on the field was upheld [as a reader pointed out, Matos was sent back to second under stadium boundary rules]. Finally, Robles was carted off the field, with Torgerson helping him to support his injured left arm.
Miles Mastrobuoni moved from third base to right field to replace Robles, but he didn’t need to for very long, because on the next pitch after play resumed, Wilmer Flores singled in Matos to send the Mariners to defeat, dropping them to 3-7. Medical personnel at Oracle Park popped Robles’ shoulder back into place, and after undergoing X-rays on-site, he was initially diagnosed with a dislocated left shoulder and placed on the 10-day injured list. The results of the follow-up MRI he underwent on Monday afternoon have yet to be announced.Read the rest of this entry »