Welcome back to Top of the Order, where every Monday, Wednesday, and Friday, I’ll be starting your baseball day with some news, notes, and thoughts about the game we love.
It’s not easy to be in playoff position — no matter how early we are in the season — with an offense ranked 23rd in wRC+ entering Tuesday. But that’s exactly where the Tigers stood, above .500 despite an offense that’s better than only seven other teams. Spencer Torkelson doesn’t yet have a home run, Colt Keith has been anemic in his first few weeks in the majors, Javier Báez has continued his backslide, and Detroit is getting almost no offense from its catchers. Mark Canha, Riley Greene, and Kerry Carpenter have been great, but three well-performing hitters can’t carry the other six spots in the lineup. So, then, it’s not hard to see what’s keeping the Tigers afloat: the performance of their pitchers.
A FIP of about 4.00 has the Tigers right in the middle of the pack in pitching WAR, but in terms of ERA — however sustainable or unsustainable it may be — they are among baseball’s best teams at preventing runs.
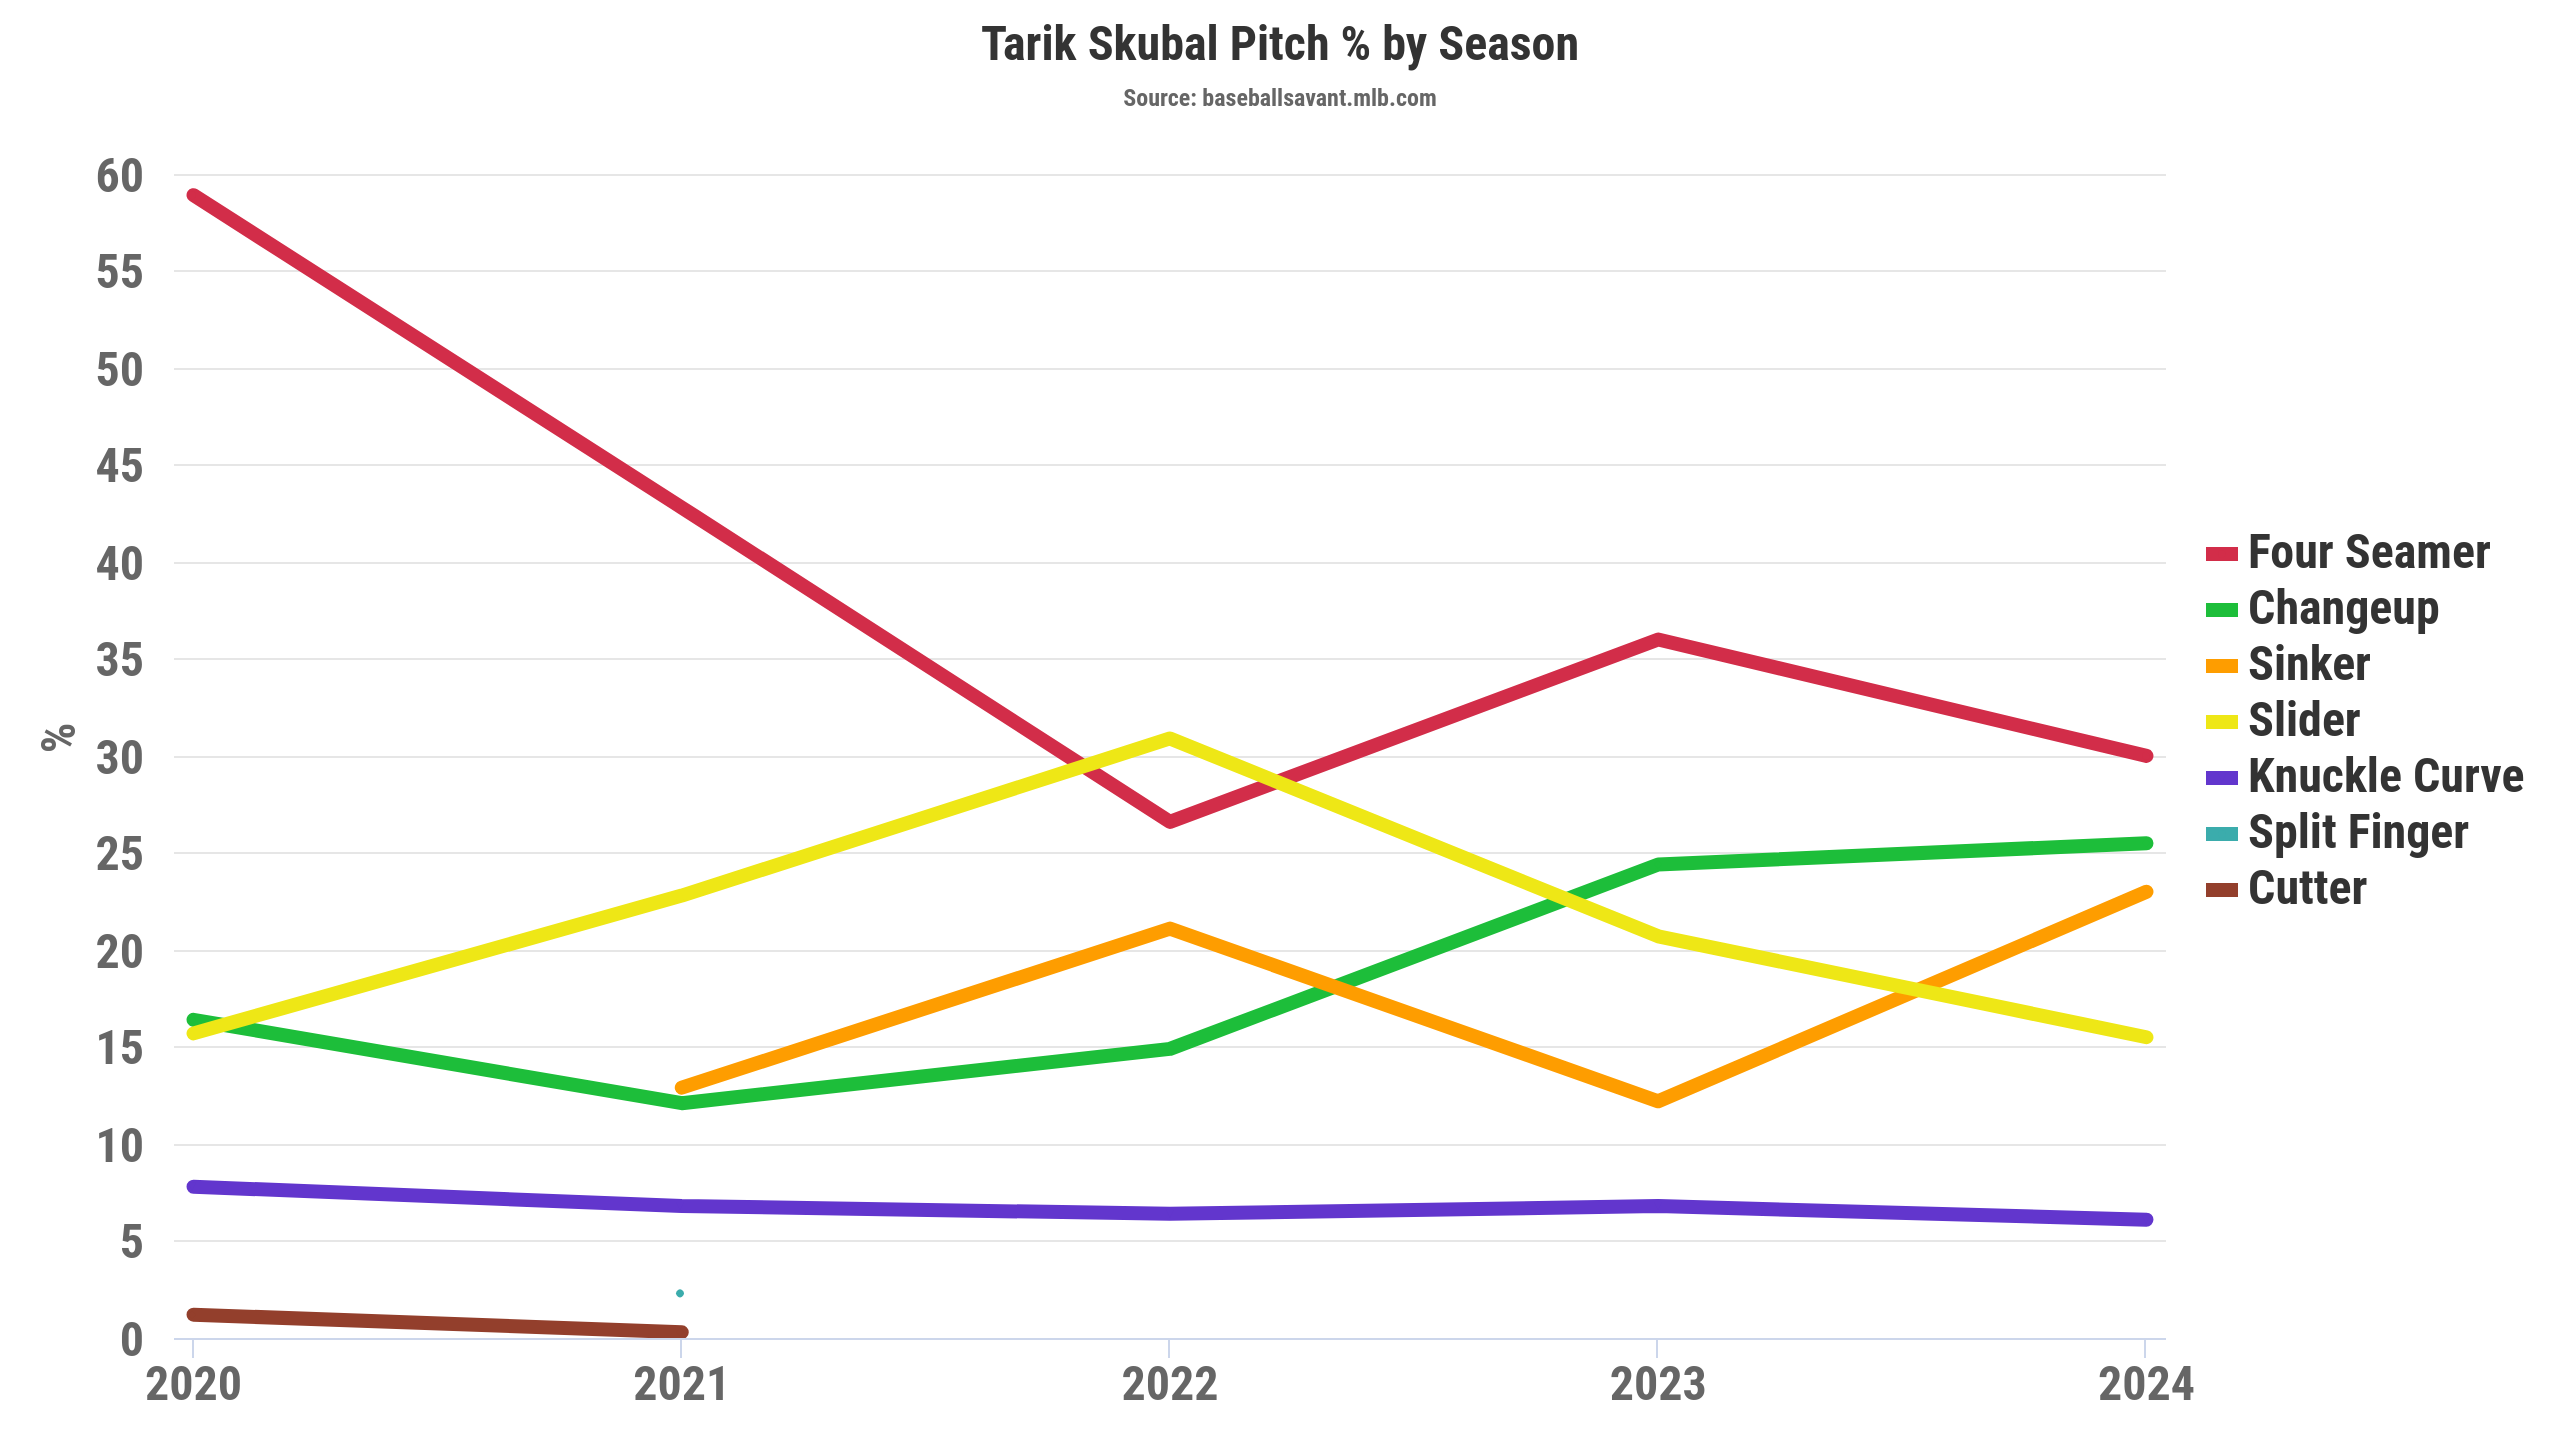
Detroit’s main contributor has been, of course, ace Tarik Skubal. He’s already been worth 1.0 WAR over his five starts, striking out nearly a third of the batters he’s faced and walking less than 5% of them. He’s allowed just two home runs, a major improvement from a few years ago. He surrendered 35 homers over 149.1 innings in 2021, his first full season in the big leagues, when he was a fastball-heavy prospect who tried to shove his heater down batters’ throats, an approach that often led to uneven results. Now that he’s mixing his pitches, Skubal is overwhelming hitters and making it far harder to guess what he’s going to throw, leading to far more weak contact.
Other than Kenta Maeda, who’s struggled badly this year despite his five scoreless innings Tuesday night, the rest of the rotation is doing its job, too. Jack Flaherty has his best strikeout percentage since 2019, when he finished fourth in the NL Cy Young race, Casey Mize is fully healthy, and Reese Olson looks like a solid back-end starter.
Where the Tigers have especially shined is in relief. Their relievers have an incredible 1.83 ERA, which actually went up after Tuesday night’s 4-2 win over the Rays, though it’s worth noting that mark has been aided by an unsustainably low BABIP against. Jason Foley is the headliner in the bullpen, firing high-90s sinkers to keep his ERA spotless through 11 appearances, but he’s had plenty of help. Shelby Miller’s deceptive fastball is difficult to square up, lefties Andrew Chafin and Tyler Holton are getting out right-handed hitters as well as lefties, and Alex Lange has been effectively wild. Even multi-inning relievers Alex Faedo and Joey Wentz, who largely pitch in low leverage situations, are doing well.
Opposing hitters won’t continue to run such a ridiculously low BABIP, but Torkelson won’t go homerless either. Such are the ebbs and flows that come with a long season, and right now the pitching is flowing and the offense is ebbing, with the former doing juuuuuust enough to keep the Tigers in the conversation as true contenders.
Will Daulton Varsho’s Adjustments Stick?
By no means was Daulton Varsho bad in his first season with the Blue Jays, but he was definitely underwhelming. He was still worth over two wins on the strength of his outfield defense — he led the majors in defensive runs saved — after hanging up his catcher’s mitt for good. However, his bat lagged far behind, with his 107 wRC+ from 2022 dropping all the way down to 85 last year. His strikeout and walk rates were similar, and he actually hit more balls in the air, but fewer of his fly balls turned into home runs because he was popping up far more pitches and pulling the ball less.
In working with bench coach and offensive coordinator Don Mattingly to flatten his swing plane a little in an effort to create fewer automatic outs, Varsho is thriving so far in 2024. His hard-hit rate is the highest of his career, with his average exit velocity up a full mph from 2023. Ironically, his IFFB% is actually higher than it’s ever been, but it’s more than outweighed by better contact overall, which has led to six homers (already 30% of last year’s total) and a 158 wRC+.
Varsho still has some holes in his game: Along with the popups, he’s pulling even fewer of his balls in play, and while he’s walking more, he’s also striking out more than ever. His offensive profile right now looks more boom or bust than Varsho and Mattingly intended, and the bust could come as quickly as the boom did. But for now, he and the Blue Jays should keep riding the wave of his boom for as long as it lasts.
RIP to Robert Suarez’s Fastball Streak
All good things must come to an end, and so it has with Robert Suarez’s fastball streak. For 79 pitches, the Padres’ closer threw nothing but four-seam and two-seam fastballs, until, finally, he mixed in a changeup at Coors Field on Monday night.
Although his ERA has fluctuated in his three MLB seasons since coming over from Japan, Suarez has been mostly the same pitcher when looking at xERA, though FIP feels differently about his 2023. At any rate, Suarez is taking a new approach in 2024; his pitch mix was essentially unchanged from 2022 to 2023, but now he’s throwing his two fastballs nearly 90% of the time.
The rest of his pitches are changeups, meaning Suarez doesn’t have any breaking pitches in his arsenal, but hitters have been flummoxed nonetheless. That fastball-changeup combo is enough to give hitters fits. Entering play Tuesday, he’s allowed just one run in 10.2 innings and earned eight saves. That’ll play.
Ben Lindbergh and Meg Rowley banter about the Rockies (and their charter pilots) running afoul of the FAA, Jackson Holliday’s slow start, whether the Astros or Twins has hurt their division-title chances more, two embarrassing umpire incidents, offense being down relative to last season, the concept of a “combined Maddux,” Shohei Ohtani’s WAR as a DH, the Blue Jays’ self-funded ballpark renovations, new research on Tommy John surgeries in Japan, and more.
Thanks to an eight-run fifth inning that included Andy Pages‘ first major league home run, the Dodgers beat the Mets 10-0 on Sunday to avoid being swept at home. Even so, they’re off to a sluggish start this season after committing nearly $1 billion in free agent contracts this past winter and pushing their payroll to a club record $314 million. Maybe they’re not the juggernaut that figure suggests, though even given their star-laden roster, they came into this season as a work in progress.
The Dodgers entered Sunday having lost seven of their past nine games. They dropped the finale of a six-game midwest road trip to the Twins, then two of three to the Padres at Chavez Ravine, followed by two of three to the Nationals and two in a row to the Mets. The skid undid a 10-4 start, and they were in danger of — gasp — sinking to .500 had they lost on Sunday. They weren’t exactly getting steamrolled by powerhouses, either. The aforementioned teams had a weighted projected winning percentage of .472 at the outset of the season, and finished Sunday having produced a .453 winning percentage outside of this nine-game stretch against Los Angeles.
For the Dodgers, run prevention has been the biggest issue. Even with Sunday’s shutout — their first of the season, with eight dominant innings from Tyler Glasnow and one from Nick Ramirez — they’re allowing 4.54 runs per game, 11th in the National League. While they haven’t allowed runs at that clip over a full season since 2005, they allowed exactly the same number of runs over their first 24 games last year while going 13-11, then picking up the pace and winning 100 games. Déjà vu all over again? Read the rest of this entry »
C’mon now. You don’t really believe in Reed Garrett. Honestly, you might not even know who he is unless you’re a Mets fan or really into interchangeable middle relievers. Garrett debuted for the Tigers in 2019, tossing 15.1 forgettable innings. He departed for Japan and pitched for the Seibu Lions for two years, where he was good but not great. Upon returning to the states, he delivered more of the same: nine bad major league innings for the Nats in 2022, 20 split between the Orioles and Mets in 2023, and plenty of minor league time mixed in.
Some of that minor league time was fairly good. Garrett struck out 28% of opponents while pitching for the Norfolk Tides, the Triple-A affiliate of the Orioles, in 2023, though he walked 10% there and 14.5% in his time with the Mets. He posted a 1.59 ERA there, too, though it came with an unsustainable 91.9% left-on-base rate. He even looked fairly decent for the Nats in Triple-A in 2022, recording a 3.04 ERA in 47.1 innings with a 27% strikeout rate. We listed him on our Positional Power Ranking bullpen preview — as the 11th reliever out of New York’s bullpen, with a projected ERA of 4.75.
Garrett has thrown only 10.2 innings since then, which doesn’t sound like enough to change opinions of anyone. But my, oh my, have they been good innings. Let me just put it this way: We now project his ERA the rest of the way at 4.07, a drop of nearly three quarters of a run. Imagine how good someone has to be in less than 11 innings to outweigh their entire career up to that point. Garrett has faced only 41 batters this year; 21 of them have struck out. Ah, yeah, that’ll do it. Read the rest of this entry »
The Washington Nationals are 10-11 coming out of last weekend’s 2019 World Series rematch with Houston, which is a mild surprise. I thought they’d finish way off the back of the pack in the NL East, and based on how the Marlins have faceplanted out of the gate, it seems I owe the Nationals an apology. And this is not a case of a mediocre team coming off the blocks hot by beating up on a bunch of glorified Triple-A opposition. Washington has played some pretty solid competition, with a series win against the Dodgers on the road sprinkled in there, too.
When a team exceeds expectations like this, there’s usually a good bullpen involved. Sure enough, Nats closer Kyle Finnegan has been strong (though his underlying peripherals are concerning), but the team’s real standout has been Hunter Harvey. Harvey made his first appearance in Washington’s second game of the season, entering in the eighth inning of a tie game in Cincinnati. It didn’t go well; he allowed two runs in one inning of work. But the offense bailed him out, tagging no less a reliever than Alexis Díaz for three runs in the top of the ninth. So despite a rough day at the office, Harvey escaped with a win.
And perhaps as a token of gratitude, Harvey has been basically untouchable since. In his past nine outings, totaling 10 innings, Harvey has struck out 17 batters, walked none, and allowed just a solitary run. He’s recorded holds in seven of those appearances and a positive WPA in all nine. His FIP in that span is below zero.
Last week, Andrew Golden of the Washington Post asked several Nationals pitchers where they focus their gaze as they prepare to pitch. They all seemed to have different answers. “When we go to the bullpen, that’s what we’re finding out,” said Robert Garcia. “It changes every pitch,” said MacKenzie Gore. I’ve been thinking a lot lately about where a person directs their attention, about how much control they really have over it, about things seen and unseen. That’s because for the past few months, something has been slowly creeping both into my field of view and into my consciousness.
During spring training, as I watched footage of pitchers and catchers working out, there was often something lurking off in the periphery. Although it was brightly colored, it didn’t draw attention to itself. It didn’t move at all. But once I started seeing it, I couldn’t unsee it. I couldn’t help looking for it, scrolling through the social media feeds of beat writers for evidence. Here’s a picture Newsday’s Tim Healy took a few weeks ago. Adrian Houser is pitching, and J.D. Martinez is standing in the batter’s box watching pitches. But someone else is lurking behind J.D. Martinez, watching him.
J.D. Martinez is standing in to track pitches during Adrian Houser’s bullpen session. pic.twitter.com/QR9X9Fu3F9
That’s the Designated Hitter. It’s a dummy shaped like a batter. The idea is to set it up in the batter’s box so that pitchers can simulate facing an actual batter. The cord dangling from its elbow is intended to give pitchers a frame of reference for pitching inside. It turns out that just about the entire league uses it. I wasn’t trying to catalog every single team, but even so, I found Designated Hitters in the bullpens of the Astros, Brewers, Cardinals, Dodgers, Mariners, Marlins, Mets, Red Sox, Tigers, Twins, White Sox, and Yankees. Back in 2022, James Fegan captured video of multiple White Sox pitchers using the DH during side sessions.
It’s not just the majors, either. The Designated Hitter has permeated every level of the sport. It’s especially prominent at training facilities. If you’re a pitching nerd who pays attention to what’s going on at Tread or Driveline, you’ve almost certainly seen it in use. On particularly fun occasions, you’ll see it in use by way of high-speed cameras as MLB pitchers work on their repertoires. Chris Langin, Driveline’s Director of Pitching, published the clips below on Twitter (and graciously granted me permission to compile them in the video below).
Colby Morris has pitched in the minors and interned at Driveline, and he’s now an associate pitching analyst in the Giants system. Understandably, he can’t talk about the specific training methods the Giants use, but he’s a big fan of the Designated Hitter. “My personal philosophical opinion is pitchers should throw almost every pitch with one,” he told me. “I loved using it while playing to hold myself accountable and gain confidence throwing inside to hitters.”
The Designated Hitter is even more popular at the amateur level, especially college. In the pros, it’s somewhat rare to see one in action. Coaches or teammates will often stand in, whereas the dummy is saved for more specific exercises. College baseball and softball programs use it constantly. Some softball programs have taken to marking them up with red, yellow, and green tape, like a traffic light. The green goes at the chest and the knees, where you want to locate a pitch. The red goes thigh-high, where you very definitely don’t. College teams also have entirely too much fun with the dummy; I’ve seen players running relay races with it, using it as an air guitar, and even holding wedding ceremonies with it. Several have named theirs.
You may have noticed that aside from the colors, every one of these dummies is exactly the same. They all have the same upright, but somehow still hunched-over batting stance. The Designated Hitter is the only game in town. I decided to find out where it came from and how it seemingly found its way into the bullpens of America. I also decided to answer other important questions, such as which current MLB player has the most similar stance to the Designated Hitter. Although there were many contenders, Oakland’s Lawrence Butler is the winner. All the dummy needs is a longer bat and an oven mitt in its back pocket.
Joe Murphy, a former catcher at the University of Rhode Island, started ProMounds in 2001. Murphy was a high school teacher and baseball coach in Massachusetts, and he wanted his pitchers to be able to throw off a real mound at the beginning of the season, when the cold weather forced them to practice indoors. He invented a portable, lightweight mound made of turf-covered foam, and it turned into a business when his fellow coaches started asking if they could buy their own. Murphy enlisted his parents and fellow teachers as the company started growing. The name changed to On Deck Sports when he started branching out into other kinds of field equipment and training aids. Eventually, it became Murphy’s full-time job, and On Deck started fitting out entire baseball and softball facilities.
Although On Deck Sports owns the Designated Hitter, it didn’t create it. Murphy first encountered it at a trade show, and bought it in 2010. Trade shows are the way to get your product in front of coaches who might be interested in buying them, but they can also be expensive and difficult to navigate. When Murphy started making mounds, he learned that if you’re only selling one product, even one that sells well, it’s hard to make the numbers work. “It costs quite a bit just to mobilize and travel the trade show space,” he said. “When you have one product it can be really difficult. When I met Jim, it was getting to that point for him.”
Jim Haller was a fireballing right-hander out of Creighton Prep in Omaha. The Dodgers took him ninth overall in the 1970 draft, but injuries derailed his career, starting with a collision at first base during fall instructs. In 1971, playing for Double-A Albuquerque, he got hit in the jaw by a ball during batting practice. On August 4 of that year, he threw 14 scoreless innings against Dallas Fort-Worth. He ended up with a no-decision thanks to future big-leaguer Tom Walker, who beat Albuquerque 1-0 with a 15-inning no-hitter. “My arm never recovered after that,” Haller told me. “My arm was dead. Nowadays, can you imagine a first-round draft pick going six innings?”
On September 25, 1974, Dr. Frank Jobe performed the first ever UCL reconstruction surgery on Tommy John. Earlier that morning, he operated on Haller, cleaning up his elbow and performing an ulnar nerve transposition surgery. “I gave him hell,” Haller joked. “I said, ‘I think you took something out of my arm and gave it to Tommy.’” Jim pitched through the 1975 season, but never made it past Triple-A. “When the Dodgers sent me down the road, there was good reason,” he said. “I couldn’t get anybody out.” The numbers tell a more complicated tale. He always walked a lot of batters, but over two seasons and 52 starts in Triple-A, Haller ran a 2.90 ERA. He eventually went into manufacturing, but stayed around the game. In the early 2000s, he was coaching for the independent Lincoln Saltdogs when he and his business partner, Steve Zawrotny, came up with the idea for the Designated Hitter together.
Courtesy of Chelsea Janes.
Murphy connected me with Haller, saying, “He tells a great story.” He wasn’t wrong. Haller is retired now, living 30 miles outside Omaha in a town of 80 people. He still trains pitchers, but only if he thinks they have a real shot. Our first conversation took place while Haller was driving to pick up a dresser, and he was incredibly engaging, launching into the story of the Designated Hitter the moment we finished saying hello. I was dealing with bronchitis at the time, so the conversation followed a halting roundabout: I would ask a question, Haller would answer with a story. Eventually he’d make a joke, and I would start laughing, only to end up dissolving into a coughing fit. Then I’d apologize, he would say not to worry about it, and I’d ask another question.
Said Haller, “I don’t know if Steve said or I said, ‘Wouldn’t it be nice if we had a hitter up there?’ But you can’t just put a hitter in pads and let him take shots.” It’s not hard to see why the idea struck them as a good one. As Murphy said, “When was the last time you pitched a game and no batter stood in? So why would you practice without it?” I told Haller that the DH would have solved one problem I had when I was younger: I never saw enough left-handed batters to feel comfortable pitching against them. He brought up a similar concern. “There’s guys that throw a breaking ball right at a hitter. Well, where do you aim a breaking ball if there’s no batter there?”
Zawrotny was also a pitcher, and he has been running a strength and conditioning company for baseball and softball players for over 20 years. Although he and Haller didn’t know it when they started working on the idea, there were already two similar products on the market. Luckily for them, both had serious design flaws. The first was called the Pitcher’s Pal. It was essentially a crash test dummy holding a bat, and while it was used by at least one MLB pitching coach, it never caught on. Murphy recalled that it was “very oversized and awkward,” but I wasn’t able to find any real information about it. I found much more information about a different Pitcher’s Pal, which was designed to help people who play horseshoes. It was basically a tire iron with a handle.
The second competitor was the Bullpen Buddy, an absolutely hilarious inflatable batter licensed by MLB. The Bullpen Buddy needed to have its feet filled with sand in order to stand up. To make it a switch-hitter, it featured a fascinating here’s-the-church, here’s-the-steeple grip on the bat, along with a removable head that mostly just wobbled around crazily. Also, the air valve was located on the back of its upper thigh, which meant that in order to blow it up you more or less had to press your face directly into its butt. On the positive side, it bore an uncanny resemblance to Anthony Rizzo.
Unlike Rizzo, however, the Bullpen Buddy wasn’t great at getting hit by pitches. It had a tendency to tip over, and the soft plastic was prone to bursting on impact. It doesn’t take a sports psychologist to realize that if you’re trying to instill confidence in a young pitcher who’s struggling with poor control, you probably shouldn’t make them throw to a batter who might, when hit with a wayward pitch, literally explode.
Haller and Zawrotny worked out the general idea for the design over texts and emails, and filed for a patent in February 2007. The Designated Hitter came in three sizes, for players of different ages. The final shape wasn’t drawn. Haller knew a player on the University of Nebraska baseball team and asked him to pose while the team was in Omaha for the College World Series. “I’ve got a buddy in Omaha that’s kind of a wizard with computers and photography,” he said. “We shined a light on [the player], and we had a shadow on the wall and we took a picture of that.”
Once they’d crafted the final design, Haller paid $20,000 to have a mold created. The DH is made of rotationally molded thermoplastic, so it’s hollow inside and weighs only seven pounds. It then gets bolted onto a base made of recycled rubber, the same kind you’d find on the bottom of an orange traffic delineator. That’s not an accident. “I used to steal those bases. I took those off the highway for about three months,” Haller said. “At construction sites, they would put traffic cones in those so they wouldn’t blow over, so then I tracked down the company that made them in California.”
Haller and Zawrotny got the first DH molded by a company in Iowa, bolted it onto one of the purloined bases, and brought it to work to test it. That is, Haller asked his pupils to throw at it as hard as they possibly could. “And it just worked spectacularly,” he said. “We had guys that threw hard. I would keep a pocket full of hundred-dollar bills, and I would say, ‘I’ll give you a hundred dollars if you can break it. I’ll give you a hundred dollars if you can knock it over.’” At first, the pitchers were throwing from the rubber, the full 60 feet, 6 inches away. When it turned out that the DH wouldn’t so much as budge, he let them start moving closer. “So I had guys standing five, 10 feet away from this thing, and you just couldn’t break it. We even had them do it with softballs too because of the bigger mass.” Take a moment to picture the scene: Haller with a sheaf of hundred-dollar bills in his pocket, a gaggle of pitchers buzzing around in front of a two-dimensional batter, waiting their turn to take a running start and fire a softball at its center of mass from point blank range. One by one, they muscle up and unload, only for the ball to fall harmlessly to the ground. One by one, they’re defeated by seven pounds of plastic.
In the years that Haller sold the DH, he could only recall one that broke, due to a defect. He and Zawrotny were also pleased to find that, as intended, the design’s flat shape and square corners minimized deflections that could injure a catcher, a concern that plagued the Pitcher’s Pal.
With the product proven, they got to work. Zawrotny was in Oklahoma, focusing more on marketing, while Haller was in Nebraska, assembling and shipping the DHs. They both visited trade shows to demonstrate it to coaches. Early on, pitching guru Tom House told Haller that the DH was worthless. His research indicated that pitchers don’t even see the batter while they’re pitching. The slight still rankles Haller, but the DH took off quickly. “Our original purchasers were high schools, local high schools here in the Omaha area. And Omaha, we’re a baseball area. The College World Series kind of makes us a baseball town. Steve went to trade shows in Texas and sold a bunch, but it was primarily high schools, and then the colleges caught on. And then I think we gave one to some big league club for spring training, and that took a while to catch on. But I honestly think players were demanding them, and that probably helped the sales.”
Haller remembered one player in particular who loved the Designated Hitter early on, although he couldn’t come up with the player’s name. The player spent most of his career with the Cardinals, and then bounced from team to team for a few years. Each time, he’d make sure the new team’s bullpen had a DH. After struggling for another minute or two, Haller gave up on trying to remember the name, but an hour or two after we hung up, he called me back and shouted, “Isringhausen!” I laughed, then coughed.
Eventually, the demand became too much for Haller and Zawrotny, who were both coaching and training while managing the Designated Hitter. They sold it to On Deck in 2010. “When Murphy came to us and was interested in buying the entire product, Steve and I thought, This is too big for us. We’re not going to get the job done. So we sold it to Joe. I’m happy for him.” Haller is proud of what they accomplished: “I’ll look at somebody I respect in the big leagues, somebody’s mechanics I respect, and you’ll see the thing standing there.” However, that doesn’t mean he has no regrets about letting the DH go. “Steve and I, we came up with a winner,” he said. “I wish we could’ve cashed in on it.” They have since come up with other ideas, but nothing they’ve believed in strongly enough to pursue.
On Deck now manufactures the Designated Hitter at a factory in Georgia. The company adjusted the mold so that it comes in two pieces, bolting together at the hitter’s waist, which makes it easier to ship and transport. That’s the only significant change it made, and the DH is still more or less indestructible. “The breakage and the quality control around it,” Murphy said, “it’s so fractional that it’s not even measurable.” When I asked how many Designated Hitters were in bullpens across the country, he estimated that the number was in the tens of thousands.
When I asked Haller if there was anything he wishes he could go back and change about the product, he already had an answer ready: the name. “We thought we were clever as hell calling it the Designated Hitter,” he said. But they realized that the name made it sound like the opposite of what it was: a device to help hitters rather than pitchers. “It was too late, we had money sunk into it,” he said “And that wasn’t Steve’s fault. It was my fault.”
Courtesy of Ryan Divish.
There’s no getting around the fact that the Designated Hitter is, in some ways, a deeply silly product. It’s not as silly as a decapitatable Anthony Rizzo, but there’s always going to be something funny about an indestructible two-dimensional batter. Sometimes the simplest solution to a problem is elegant, the single stroke that clears everything extraneous away. And sometimes the simplest solution strips the problem down to its essence, laying bare the absurdity of the entire exercise. The faceless, depth-less DH is somewhere in between, using the absolute minimum information possible to convey the idea of a batter. It’s not so much a designated hitter as a deconstructed hitter. The first time you notice it, you’re bound to think of Ricky Vaughn taking a dummy’s head clear off with an errant fastball in Major League. All the same, I was moved to hear the passion with which Murphy and Haller talked about it. The idea had been around for a long time; it was just waiting for people who cared enough to get it right. “I don’t know, man,” Haller said. “I’m not that smart, but we fell into one.”
Although I’ve focused on usage across Major League Baseball, that was never intended to be the main market for the Designated Hitter. From the very beginning, Haller and Zawrotny saw it as a teaching tool for young players. “Youth pitchers, they hit a kid, and they might not want to pitch anymore,” Haller said. “When you’re 10, 11 years old and you’ve got a guy hitting you, a lot of kids get scared to death and it ruins their whole baseball experience.” Haller is still very much a coach at heart, and he told me enthusiastically about the two pitchers in high school he’s currently training. Though he’s still a board member, Murphy recently sold the majority of On Deck Sports and went back to coaching. “We use it in our bullpen every day,” he said.
Speaking with Haller, it’s not hard to see how his own experiences as a pitcher led him to value the idea of a tool for practicing command and learning to pitch inside without fear of hitting a batter. Later in our conversation, I started asking him about his own experiences. When I told him I’d read that he once struck out Hall of Famer Dave Winfield four times in a row in an American Legion game, he joked, “I was so damn wild he just wanted to get the hell out of there.” He came back to that idea several times. “I didn’t know how to pitch,” he said. “I threw hard. I’m 6’6”, 225; I threw hard as hell. I’m there in Vero Beach, I’m around Don Sutton and Tommy John and Andy Messersmith, and they’re throwing seven, eight miles per hour less than me.” The Designated Hitter was created for kids like him, along with the kids who have to stand in against them. “These guys on little league teams are just bigger than their peers, so they don’t really learn the finer skills,” he said. “I felt bad for these kids. I was six feet tall in little league. Can you imagine these kids facing me?”
About two months ago, pitchers and catchers reported to spring training, marking a ceremonial end to the winter and the beginning of a new season. But as players showed up to camp and exhibition games began a couple weeks later, two pitchers were notably absent.
Blake Snell and Jordan Montgomery, our fifth and sixth ranked free agents entering the offseason, each signed contracts dangerously close to the start of the season, with the latter coming off the market just two days prior to Opening Day. Both had to settle for much shorter-term deals than they were expecting, with combined guarantees undershooting our crowdsourced projections by $188 million.
As the first to sign, Snell was the first to make his debut, starting the Giants’ 11th game of the year after pitching in simulated games against his teammates. Montgomery reported to Triple-A, making two starts in Reno before being activated by the big club last Friday. His first start of the year, interestingly, came against the Giants and opposite Blake Snell, so it offered an early look at how this unconventional offseason might have impacted each pitcher.
Snell vs. Montgomery was an exciting matchup thanks to their track records of excellence and the intrigue surrounding their offseasons, but also one that came with many unknowns. How would Montgomery fare in his first major league action of the season? Would Snell bounce back after two consecutive poor outings? How much rust would each deal with after a month of ramp up time?
Snell’s top of the first inning was relatively uneventful; he used his slider and changeup to record three straight outs after a leadoff single. Next, it was Montgomery’s turn to face a Giants lineup stacked with right-handed platoon hitters like Austin Slater and Tom Murphy. Slater led off, and Montgomery’s first offering of the year was a sinker that clocked in at 91.4 mph, two ticks shy of last year’s average. He sat in that velocity band throughout the game, a symptom of the late start to his spring. Slater eventually grounded out on a curveball low in the zone, and the next two hitters were also retired on routine grounders.
Outside of being left-handed pitchers on short-term contracts, Snell and Montgomery have little in common, especially with respect to their pitching styles. Snell refuses to conform to the so-called strike zone, rapidly changing batters’ eye levels with fastballs above it and breaking balls below it. His brand of high-strikeout, high-walk baseball has netted him two Cy Young awards, though he ran a more pedestrian 96 ERA- across the four seasons separating them. Montgomery, on the other hand, prefers to live in the zone with his plus command and arsenal of downward-breaking pitches. He’s never reached the heights of Snell’s peak years, but has outproduced him by WAR over the past three years.
Snell pitched a clean second inning, capped off by a seven-pitch showdown against Gabriel Moreno. After falling behind in the count 3-1, he got Moreno to swing and miss below the zone, then foul off the next pitch to keep the count full. He threw two fastballs and four sliders to get here. So what did he do next?
This is an example of Snell at his best, the version that knows where each pitch is going even when not throwing strikes. Primed for a fastball or slider that would have ended up down the middle had it been aimed at the same spot out of the hand, Moreno went down on a curveball that dropped two feet more than any of Snell’s other pitches. Last season, Snell’s 310 swinging strikes on out-of-zone pitches ranked second in baseball, and most of them came on breaking balls that tunneled well with his fastball before falling off the table.
Unfortunately, Snell failed to execute this strategy for the rest of his start, as too many offerings leaked over the middle of the plate. In the third, a slider and changeup down the middle resulted in loud contact from Blaze Alexander and Ketel Marte. In the fourth, Alexander struck again, this time against the fastball. Snell allowed four more hits in the fifth before being pulled mid-inning, failing to complete five frames for the third consecutive start. The Diamondbacks collected nine hits, the most he’s allowed in a start since 2019.
Most of the hits Snell allowed were the result of the Diamondbacks capitalizing on pitches down the middle, which were uncharacteristically frequent from someone whose pitches tend to magnetize away from the zone. But in this three-start sample, Snell has been leaving more pitches over the heart of the plate, resulting in both more loud contact and fewer swinging strikes in the zone.
Blake Snell Heart% by Pitch
2023
2024
Fastball
24%
25%
Curveball
12%
19%
Slider
14%
16%
Changeup
16%
29%
SOURCE: Baseball Savant
While Snell’s command certainly isn’t where it was last year, Montgomery had no such issues locating his pitches throughout his start. He landed an impressive 23 of his 30 sinkers in the strike zone, taking advantage of its high groundball rate; batters have slugged under .375 against in each of the past two seasons. With a strike-stealing machine in his arsenal, many matchups against Montgomery ended in either an early groundout or a pitcher-friendly count that allowed him to deploy his curveball and changeup, the latter of which earned four of his eight whiffs on the night. While he spiked a few curveballs in the dirt, he had excellent feel for locating his changeup, consistently landing it on the armside half of the plate.
Without his typical velocity, Montgomery struck out just three batters (one of which came on a pitch clock violation). Instead, he recorded outs by keeping his pitches away from barrels and limiting the quality of contact against him, tallying nine groundouts in six innings of work while allowing a hard-hit rate of just 32%. Aside from a Jorge Soler homer that marked the only blemish on Montgomery’s record, none of the other batted balls he allowed were particularly threatening; over two-thirds of them had an xBA below .200.
Another trend to watch from Montgomery’s start was his increased use of his changeup and curveball. He’s thrown his fastballs about half the time throughout his career, but he dropped that usage to about 40% in his first game with the Diamondbacks. This shift may simply be the result of good advance scouting — Giants’ right-handed hitters currently rank 28th in wOBA against non-fastballs — but it could also be part of Arizona’s teamwide shift toward more diverse arsenals, especially from its starting pitchers. This season, Merrill Kelly has added a slider to his kitchen-sink arsenal while Slade Cecconi is throwing far more splitters at the expense of his fastball. Montgomery’s curveball has been a successful out pitch and could potentially generate even more outs if he continues to throw it 30% of the time; during his career, batters have generated a pitiful .177/.209/.307 line against it.
Jordan Montgomery Pitch Usage vs. RHH
2023
Friday
Sinker
41%
37%
Changeup
26%
31%
Curveball
21%
28%
Four-Seamer
11%
4%
SOURCE: Baseball Savant
Montgomery was removed from the game after six innings and 78 pitches, and Arizona’s offense teed off in the late innings of the game, which ultimately resulted in a 17-1 wallop. Both starting pitchers still have more ramping up to do at the big league level, with Montgomery working back to regular season velocity and Snell still searching for his command after three bad outings. That said, I think there’s reason to be optimistic about both pitchers. Even with an 11.57 ERA, Snell’s peripherals are nearly in line with last season’s numbers, and he tends to improve as the year goes on, with a career FIP nearly a run better in the second half of seasons. Montgomery showed off his advanced pitchability despite his diminished stuff, with a possible arsenal change that could lead to improvements.
If the Houston Astros were to sing a jovial song consisting of a list of their favorite things, April 2024 would definitely not make the cut. At 7-16, the Astros are looking up at everyone in the AL West, even the Oakland Athletics, a franchise that barely exists as a going concern in 2024. Cristian Javier’s injury adds another name to the injured list, and though he isn’t expected to miss a lot of time, his absence further depletes a struggling team that needs all the help it can get to climb its way out of a hole that keeps getting deeper.
How bad is a 7-16 start? Well, only two teams have ever overcome such a rough season-opening stretch to later make the postseason.
Worst Starts for Eventual Playoff Teams
Year
Team
W
L
Final Record
1914
Braves
4
18
94-59
1981
Royals
7
16
50-53
2015
Rangers
8
15
88-74
2006
Padres
8
15
88-74
2001
Athletics
8
15
102-60
1974
Pirates
8
15
88-74
2014
Pirates
9
14
88-74
2010
Braves
9
14
91-71
2009
Rockies
9
14
92-70
2007
Rockies
9
14
90-73
2007
Yankees
9
14
94-68
2006
Twins
9
14
96-66
2005
Yankees
9
14
95-67
2002
Angels
9
14
99-63
1989
Blue Jays
9
14
89-73
1987
Tigers
9
14
98-64
1984
Royals
9
14
84-78
1979
Pirates
9
14
98-64
1969
Mets
9
14
100-62
1951
Giants
9
14
98-59
SOURCE: Baseball-Reference
Only the 1914 Boston Braves had a worse start, going 4-18-1 over their first 23 games. It may be tempting to use that tale as inspiration, but the fact that their turnaround was enough to earn them the appellation of “Miracle” Braves reflects the improbability of the feat. Excluding the Astros, 103 teams have started a season with precisely seven wins in 23 games; the average finish for these teams was, pro-rated to 162 games, a 67-95 record.
But all is not doom and gloom. Almost 20% of these teams played at least .500 ball the rest of the way (18 of 103), and this looks a bit worse because of the simple fact that a lot more lousy teams start off 7-16 than good ones do. It doesn’t necessarily follow, then, that a team we believed to be a quality one will have a fate as bleak as what happened with the clubs we thought would be much worse. How often do teams that we expect to be good start off this slow? I’ve never gone back and re-projected whole leagues before I started running team projections in 2005 – though it is on my voluminous to-do list – but I do have nearly two decades of projections to look at. So, I took every team that stood at single-digit wins after 23 games and looked at how they were projected entering the season.
After chopping off the teams from 2020, since 23 games was a massive chunk of that season, we end up with 117 teams, including the Astros on seven occasions (though only one of those Houston clubs finished above .500). Seven of those 117 teams did go on to win 90 games, and not surprisingly, it was largely made up of teams projected to be good; those seven teams had an average preseason projection of 86.3 wins.
Let’s pivot back to the 103 teams that began the season with exactly seven wins in their first 23 games so we can figure out how they did after their wretched starts and compare their actual finishes to their projected ones. Collectively, these 103 teams had a .458 winning percentage after their 23-game starts, compared to their overall .469 winning percentage projected before the season. I also did a quick-and-dirty method to get every team’s in-season projection after game no. 23, and the projected winning percentage for the rest of the year was .460, barely above the .458 actual mark. I tested only ZiPS, but I expect other similarly calculated projection systems to have similar results.
So, what do the projections say about the Astros right now? I ran a full simulation after Sunday’s games were complete.
ZiPS Median Projected AL West Standings Entering 4/22
Team
W
L
GB
Pct
Div%
WC%
Playoff%
WS Win%
80th
20th
Texas Rangers
86
76
—
.531
41.0%
18.3%
59.3%
5.1%
94.1
79.2
Seattle Mariners
85
77
1
.525
30.7%
19.2%
50.0%
3.8%
92.1
77.4
Houston Astros
83
79
3
.512
23.1%
17.9%
41.0%
3.5%
90.3
75.2
Los Angeles Angels
75
87
11
.463
5.1%
7.1%
12.2%
0.4%
82.3
67.3
Oakland A’s
61
101
25
.377
0.1%
0.1%
0.2%
0.0%
68.6
53.6
SOURCE: Me
ZiPS Projected Wins, 2024 Astros Entering 4/22
Percentile
Wins
1%
63.0
5%
68.4
10%
71.4
15%
73.4
20%
75.2
25%
76.7
30%
78.0
35%
79.3
40%
80.6
45%
81.7
50%
82.9
55%
84.0
60%
85.2
65%
86.3
70%
87.5
75%
88.9
80%
90.3
85%
92.0
90%
93.9
95%
96.9
99%
101.6
SOURCE: Also me
The Astros are hardly dead in the water and are helped out by the fact that the best teams in the AL West so far are still hanging right around .500. But it’s been enough to slash five projected wins from Houston’s preseason total and drop its playoff probability by about a third. In other words, after this awful start, the Astros are more likely than not to miss the postseason, according to ZiPS. The situations in which they make the playoffs are now largely upside scenarios rather than average ones. And that means the calendar is now an enemy.
How long can they afford to keep winning three out of every 10 games before their playoff hopes evaporate? To estimate this, I’ve continued giving the Astros a roster strength of .300 (projected winning percentage vs. a league-average team in a neutral park) and re-checking every five games.
ZiPS Projected Wins, Playing .300 Ball
Games Played
Division %
Playoff %
23
23.1%
41.0%
28
19.3%
35.5%
33
15.8%
30.5%
38
12.6%
25.3%
43
9.9%
20.5%
48
7.5%
15.8%
53
5.4%
11.8%
58
3.8%
8.3%
SOURCE: A magical talking hat (still me)
At the rate the Astros are playing, they’re basically toast in five more weeks. Even playing .500 ball over this span carves off another meaty slice of their playoff probabilities (15.6% division, 31.6% postseason). Any shot they have at turning things around has to involve getting better pitching. The Astros are second in the league in on-base percentage and slugging percentage, and of the nine players with at least 50 plate appearances, seven of them have a wRC+ above 100, with three of them above 150. Alex Bregman (76 wRC+) will almost certainly get better, but I’m less confident about José Abreu, whose horrifying start (-32 wRC+) is even more abysmal than last year’s putrid April (45 wRC+).
Meanwhile, Astros starting pitchers have the fourth-worst strikeout rate (18.8%) and the second-worst walk rate (11.3%) in baseball. To get better pitching quickly is going to be a challenge due to injuries. As noted briefly above, Javier is going to miss at least a couple of starts. And while Framber Valdez is nearing a return, José Urquidy isn’t fully throwing from a mound yet, and Luis Garcia and Lance McCullers Jr. are months away. Justin Verlander’s return isn’t enough to flip the script instantly. That leaves Houston in an awkward situation in which it needs pitching before the deadline, but perhaps not as much afterwards. I usually counsel teams not to panic, but given the urgency of this situation, I think the Astros need to be aggressive at identifying and acquiring pitchers. The Marlins may not be keen on giving up Edward Cabrera given his low salary, but the Astros should at least have the conversation about a trade for him.
Houston remains an excellent team, but starting 7-16 means that the clock is ticking very loudly. And if the Astros just stand pat, by the All-Star break they might find themselves turning their attention toward 2025.
On Saturday, Tyler Stephenson stepped to the plate in the bottom of the first with the bases loaded. He got a pitch to hit from Angels starter Patrick Sandoval, a middle-high sinker. Stephenson was late on it, but he’s strong enough that he managed to muscle it over the right field fence anyway for an opposite field grand slam.
Stephenson is off to a slow-ish start this year. In 18 games and 58 plate appearances, he’s batting .200/.293/.420. But a closer look reveals that he’s been the victim of some atrociously bad luck. Nearly a quarter of his batted balls have been barrels, or batted balls that are struck hard enough, and at beneficial enough angles that they produce extra-base hits more often than not. Stephenson is 229th in plate appearances and 12th in barrels leaguewide.
There’s more good news on the Stephenson front. Last season, he struck out 26.1% of the time and ran the highest swinging strike rate of his career. He’s always had a fairly good batting eye, but he made less contact than ever and paid for it in strikeouts. It’s still early this year, of course, but he’s making much more contact per swing and swinging less often. He’s walking more than ever, and his strikeouts have ticked back down to a more manageable 24.1%, though in only 58 plate appearances there’s plenty of uncertainty still.
Why am I bringing this up? Because Stephenson leads the majors in whomps per whiff, and looking at that leaderboard is helping me understand who’s starting the 2024 season hot. As a refresher, this very simple stat is a ratio of barrels to whiffs. It’s a crude but effective way of measuring the power/contact tradeoff, and the best five hitters of the Statcast era by this metric are, in order: Yordan Alvarez, David Ortiz, Mike Trout, Mookie Betts, and Juan Soto. I have to admit, I didn’t expect Stephenson at the top of the 2024 leaderboard. But even with him there, this looks like a compilation of the very best hitters in baseball this year, plus a few intriguing interlopers: