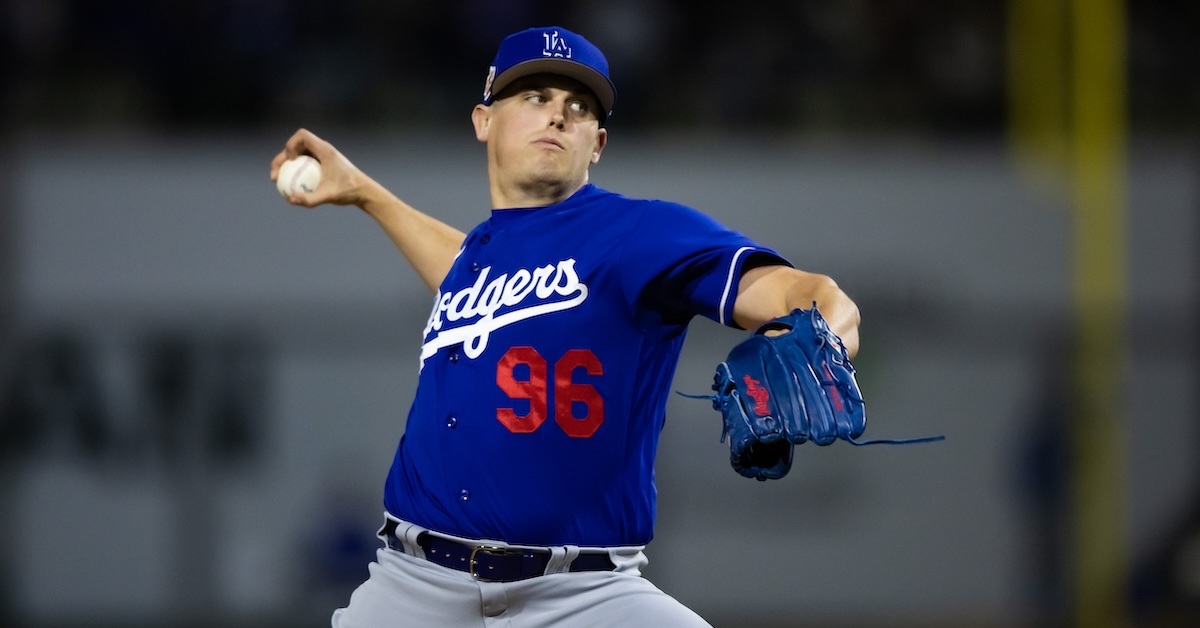
Bryce Miller has come a long way in a short time. A fourth-round pick by the Seattle Mariners out of Texas A&M just two summers ago, the 24-year-old right-hander came into the current campaign ranked no. 83 on our Top 100 and made his major league debut earlier this month. Moreover, his three starts have been nothing less than stellar. Over 19 innings, Miller has fanned 18 batters while allowing just one run on seven hits and a single walk. His ERA is a minuscule 0.47.
Seattle’s pitching development acumen has played a big role in his success. Miller’s 96-mph four-seam fastball is in the 99th percentile for spin, but it wasn’t until he got to pro ball that he began utilizing it in an optimal manner. He has also advanced the quality of his secondaries and is attacking hitters with a more varied arsenal than he did as an Aggie.
“In college, we had Rapsodo and TrackMan, but I never really dove into that or really even knew what it meant numbers-wise,” explained Miller. “But with Seattle being pretty deep into analytics, that changed when I got here. They really opened my eyes on how my stuff plays and where I need to throw it.” Read the rest of this entry »
I’ve made another small series of updates to the Top 100 Prospects list, which you can find on The Board. For the first time this season, I’ve reshuffled some of the names in the top 15 to 20 spots. Mostly, I’ve done some incremental reordering near the top based on health and current level of play. For example, Mets catcher Francisco Álvarez, who has kept his head above water after being thrust into the primary catching role in Flushing, has hopped over Jordan Walker, who’s struggling to get comfortable on both offense and defense down in Memphis. Neither player’s evaluation has had an overhaul — this is just a better representation of how things line up right now.
The biggest mover in the 60 FV tier is Diamondbacks center fielder Druw Jones, who falls toward the back of that group due to his quad strain and early-season strikeout issues. It could make sense for Jones to rehab in extended spring training or during the early part of the Complex League schedule and hit his way back to Visalia. It sounds like he will be back sooner than Phillies righty Andrew Painter, who remains at the very back of the 60 FV tier while he continues to rehab from a UCL injury.
Changes to the top of the 55 FV tier buoy the hitters who are performing toward the top of that group. The players from no. 14 to 18 overall (Marcelo Mayer, Brooks Lee, Endy Rodríguez, Brett Baty, Josh Jung) now stack ahead of Jordan Lawlar and Diego Cartaya, who are both striking out a lot at Double-A. The other changes within the 55 FV tier come toward the back of that group. Red Sox outfielder Miguel Bleis and Pirates infielder Termarr Johnson slide about 20 spots (the two of them were stacked at no. 19 and 20 overall), while Rays infielder Junior Caminero (who had been floating among the high-variance hitters in the back third of the 50 FV tier for about a year now) moves up from 110 overall. Read the rest of this entry »
Ben Lindbergh and Meg Rowley banter about the sesame-seer Cardinals using a cheeseburger phone to predict home buns (er, runs) by hitters who are dialed in, the varying fortunes of three offseason big spenders (the Mets, Padres, and Rangers) and the stakes of their success, Kumar Rocker’s Tommy John surgery, Dustin May’s flexor strain, the proliferation of ranked prospects, Jackson Holliday, the Orioles’ infield future, and what it takes for tanking to be justified, the need for a Lab League to test the pre-tacked ball, José Abreu’s power outage, Zac Gallen’s bird omen, and more, plus a Past Blast (1:38:22) from 2008 and a few follow-ups.
Win Probability Added isn’t a great measure of true talent – it’s influenced by too many factors outside a player’s control – but ultimately, the best players tend to have the highest WPAs. Last season, AL MVP Aaron Judge led all position players in WPA, while NL MVP Paul Goldschmidt finished on top in the Senior Circuit. The year before, it was AL MVP Shohei Ohtani who finished first overall and NL MVP Bryce Harper who paced the National League. Even in the early days of the 2023 season, the WPA leaderboard is a veritable who’s who of superstars and MVP contenders. Yordan Alvarez leads all position players with 2.42 WPA, while Ronald Acuña Jr. leads the NL with 2.18. Following closely behind in the AL is Vladimir Guerrero Jr., with 2.12 WPA to his name.
After those three, only one other hitter has a WPA above 2.00 this year, and his name is rarely listed among the likes of Alvarez, Acuña, and Guerrero. In what will be his first full season, 27-year-old Jake Fraley has already notched 2.10 WPA for the Cincinnati Reds. Read the rest of this entry »
For the 2023 Red Sox, the starting rotation was always going to be about who could stay healthy. They entered the year with seven main rotation contenders in the organization: Chris Sale, Corey Kluber, Nick Pivetta, James Paxton, Garrett Whitlock, Brayan Bello, and Tanner Houck. With Paxton back from the injuries that have kept him out for over two years and Whitlock possibly eyeing a late-May return, the Sox could end up with all seven healthy for the first time by the end of the month. This would be great news for Boston, which has been struggling to find the right permutation of pitchers to make up a consistent starting unit. It wasn’t the best news for Pivetta, whom Alex Cora announced on Wednesday night will be moving to the bullpen. If all are still healthy when Whitlock returns, the Sox could have another tough decision on their hands.
Frankly, in terms of production, starting pitching has been a bit of a mess so far for the Red Sox, and Houck has been among those struggling. Through eight starts, he has a 5.48 ERA despite a 4.10 FIP and 3.96 xFIP; he’s allowed five home runs in 42.2 innings after giving up just eight in 146 career innings before this year. There are some indicators that bad luck is at play: his 13.5% HR/FB rate is nearly twice his rate from last season, and his 59.2% LOB% is far lower than his 75.5% rate in 2022. But since 2021, when he was last regularly starting, he’s fallen from the 85th percentile to the 54th in xwOBA/xERA, the 82nd to the 23rd in average exit velocity, and the 87th to the 38th in strikeout percentage.
Red Sox SP Percentile Rankings
Player
xwOBA
xBA
xSLG
EV
Hard%
K%
BB%
Whiff%
Garrett Whitlock
23
15
15
72
66
17
88
49
Brayan Bello
24
21
18
16
3
49
68
59
Chris Sale
63
73
63
55
70
79
70
57
Nick Pivetta
7
12
4
3
4
50
28
50
Tanner Houck
54
47
48
24
36
37
52
63
Corey Kluber
13
31
8
24
16
23
52
27
SOURCE: Baseball Savant
Blue = Top quartile, Red = Bottom quartile
Aside from his struggles in the rotation, Houck’s pedigree as a reliever makes him a candidate to be bumped to the bullpen. (The same could be said of Whitlock, but the front office gave him the nod to start over Houck during the offseason.) After his final start of last year on May 8, Houck settled into a relief role quite nicely, first in a multi-inning capacity and then taking over the closer role from mid-June until he was shut down with a back injury late in the summer. In those 25 appearances, he allowed just six earned runs, posting a 1.49 ERA, 3.17 FIP, and 3.39 FIP. This is the run that might tempt Cora and his staff to slot him back into a relief role, despite Houck’s own wishes. Read the rest of this entry »
Anyone feel up for a rousing game of “Guess the Player from the Anonymized Stat Line?” I usually don’t like this game; it was a fun way to kill time on Twitter 10 years ago, but it feels kind of hacky anymore. But this one’s a real doozy, a fun enough set of anonymized stat lines that I’m willing to set aside my distaste and dive right in.
Here are three players from the NL West. They are all in the top five in the majors in walk rate among qualified hitters. They play for different teams, and for the most part they play different positions. Nevertheless, all three are within a couple tenths of a run of each other in terms of baserunning and defensive value — the bat is the important thing:
Framber Valdez had a bad start on Monday. Over just four innings of work, he allowed four runs, all earned, thanks to a seven-hit barrage and two walks. Hey, that’s pitching. Everyone has bad games – or sometimes the hitters have good games. Eight of the 10 best starters in baseball this year, as measured by WAR, have already had a game where they allowed four or more runs. That’s also true for 17 of the top 20. We’re not that far into the season, but everyone has blowups from time to time.
That’s true… for everyone other than Valdez. He’s a machine. This is only the sixth start he’s made since the beginning of the 2020 season that didn’t last at least five innings, and he’s made 72 starts in that time. He set an all-time single season record with 25 straight quality starts (at least six innings pitched, no more than three earned runs) last year. He doesn’t get roughed up early and depart. He doesn’t allow a pile of runs. He’s on a truly remarkable tear, and I wanted to put some context around it.
To come up with a fair scale, I leaned on game score, a statistic created by Bill James and updated by Tom Tango that tries to distill each start into a single number. Fifty is average. Forty is replacement level. Seventy means a great game, and 90 a truly transcendent one. It’s a blunt tool, but it’s a useful way to explain how consistent Valdez has become. Read the rest of this entry »
Shohei Ohtani had a weird night in Baltimore on Monday, at times spectacular and at times unsettling. As a hitter, he went 4-for-5 with a huge three-run homer and three runs scored in the Angels’ 9-5 win. As a pitcher, he matched a career high by serving up three homers and allowing five runs in seven innings, continuing a string of shaky outings. One can’t blame the guy for having some mixed emotions.
Ohtani the pitcher was not at his best, yielding a two-run homer to Adam Frazier in the second inning, erasing a 1-0 lead. He walked Jorge Mateo to lead off the second inning, then allowed a two-run homer to Anthony Santander, costing him a 3-2 lead. By the time he got around to giving up his third homer of the night, he at least had a 9-4 lead and the bases empty in the fifth inning when Cedric Mullins took him over the wall; he would retire seven of the eight batters he faced after that to end his night on the mound. Read the rest of this entry »
It’s officially hot start season. Now is the time when we write about players who have rocketed out of the blocks, then hope beyond hope that they don’t tumble to the track immediately after our articles get published. Today I’m looking at Jonah Heim, the Rangers’ switch-hitting catcher.
Heim has started off the 2023 season in a big way. Then again, maybe that’s not news, as Jonah Heim just has a tendency toward bigness. He’s 6-foot-4, which really should be too tall to be a catcher. Seriously, here he is (crouched!) next to Nick Madrigal just over a month ago:
I would pay good money to watch Heim pat Madrigal on the head and address him as “Scout.” Last year, the Rangers backstop accrued 2.8 WAR, which made him a top-10 catcher in baseball. It’s now May 17, and he’s already put up 1.9 WAR, ninth among all position players and second only to fellow-former-Athletic Sean Murphy among catchers. He’s slashing .313/.368/.519, up from .227/.298/.399 in 2022.
Last week, Esteban Rivera included Heim in an article about hitters who had improved after adding some movement to their swings this season. At that point, I was also interested in Heim’s breakout, but while I was watching him I got distracted by one of his very twitchy teammates. Heim’s production at the plate has improved in every single season of his career, and that trend will almost certainly continue this year. Even if his production were to fall off a cliff starting today, he’s already banked 144 plate appearances with a 144 wRC+.
When we talk about player breakouts, we look for reasons to believe that whatever changes they’ve made will stick around. We look for skills and tendencies that they haven’t demonstrated before, specifically the underlying metrics that tend to stabilize more quickly. Toward that end, I’m going to show you an extremely busy graph. Feel free to give it a quick glance and move on. Its purpose is to show you that almost nothing Heim is doing right now is completely without precedent:
Heim is at a career high or low in these metrics, but it’s worth keeping in mind that over the course of his young career, he’s already logged stretches at or near his current rate in all of them. If you’re looking for something in the numbers that says Heim is a completely new hitter, you’re likely to come up empty.
As a note, in this article I won’t spend much time separating out Heim’s approach or results from the left and right sides, because he’s only had 36 plate appearances as a righty. Almost all of the trends I’ll mention are true on both sides of the plate, but there’s just not enough going on from the right side to draw separate conclusions.
Let’s start with Heim’s approach. He’s been more aggressive at the plate, but he’s also been taking the first pitch more than ever:
Jonah Heim’s Swing Percentage
Year
First Pitch
After First Pitch
Overall
Chase
Zone
2022
38.6
55
50.6
29.3
70.8
2023
33.8
61.3
53.5
31.3
74.8
SOURCE: Baseball Savant
If you ignore 0-0 counts, his swing rate on the pitches over the heart of the zone is four points higher than it was last year. Overall, his swing rate on pitches that Baseball Savant classifies as meatballs is up more than 10 points.
This increased aggression has lowered Heim’s contact rate just a tiny bit, so his walk rate has dropped by a tick while his strikeout rate has held steady. However, it’s worth noting that Heim’s contact rate has dropped significantly on pitches outside the zone and risen on pitches inside the zone. A couple weeks ago, I noted that Randy Arozarena was doing the exact same thing: “He’s making more contact in the zone and whiffing more when he chases. I don’t know how repeatable that is, but it’s a neat trick if you can pull it off.” The trick was not, in fact, repeatable for Arozarena. Since then his zone contact rate has crashed, and it’s now to five points beneath its 2022 level. That’s definitely something to keep an eye on for Heim, but I’ll also note that he’s seeing an elevated number of pitches on the edge of the strike zone, and that’s likely the kind of statistical noise that could be affecting these numbers.
As I’m sure you’ve surmised, if Heim’s walk and strikeout rates haven’t changed much, then his newfound success must be driven by what happens when he puts the ball in play:
Jonah Heim’s Balls in Play
Year
wOBACon
xwOBACon
EV
LA
Barrel%
HardHit%
2022
.338
.319
89.3
16.8
6.9
39.6
2023
.443
.453
90.5
18.2
11.9
41.6
SOURCE: Baseball Savant
Well that definitely looks much better. Although Heim has not yet touched his max exit velocity from either 2022 or 2021, he’s hitting the ball harder, and he’s also barreling it up more often. Both his wOBA and his expected wOBA are more than 100 points better than they were last year. From both sides of the plate, Heim is hitting the ball in the air more, which is good, but we’re not just talking about average launch angle. We’re also talking about launch angle tightness. Take a look at his launch angle charts:
Heim has dropped the standard deviation of his launch angle by nearly six degrees, which is a huge amount. His popup rate is down 3.6 percentage points and his groundball rate is down 7.5. See the red area on the left, where all of Heim’s hits came in 2022? In 2023, that’s pretty much the only place he’s hitting the ball. In 2022, 55% of Heim’s batted balls came off the bat between 0-45 degrees. In 2023, it’s 73%. Jonah Heim is actually building the whole plane out of the black box.
It’s not just that Heim is hitting the ball in the air. Heim was already a pull hitter, but he’s increased his pull rate to 53.3%, eighth highest in the league. If you refer back to the busy graph at the beginning, you’ll note that his pull rate really took off early last summer. However, when it came to fly balls and line drives, he pulled the ball just 20% of the time last year. This year he’s at 52%. When he does pull the ball in the air, Heim’s performance is roughly the same as it was last year (although his expected stats are improved). It’s just that he’s doing that a lot more often.
As Esteban noted in his article, Heim’s swing adjustments have helped him reach pitches lower in the zone, which would help explain why he is missing less often against breaking stuff and hitting those breaking pitches 6 mph harder than he did last year. Here’s what that looks like in a heat map. Lots more contact at the bottom of the zone, even though his swing rate down there hasn’t changed nearly as dramatically:
Here’s one thing I find really interesting. So far I’ve been grouping Heim’s air balls together, but here’s what happens when you separate out his fly balls and his line drives:
Jonah Heim’s Fly Balls and Line Drives
Year
LD EV
LD wOBA
LD xwOBA
FB EV
FB wOBA
FB xwOBA
2022
96.5
.607
.653
89.9
.460
.321
2023
90.5
.707
.630
95.5
.494
.564
SOURCE: Baseball Savant
Last year, Heim’s line drives were scorched at 96.5 mph, while his fly balls were hit at 89.9 mph, right around his average EV. This year, that trend has been completely reversed.
That’s probably a good thing. First, players hit a lot more fly balls than they do line drives. Second, as long as they’re not hit softly, line drives are always valuable. Despite dropping 6 mph, Heim’s line drives have only shed 23 points of xwOBA. Fly balls are more dependent on exit velocity to make it past outfielders and over the wall, so Heim’s xwOBA on them jumped more than 200 points. For both reasons, Heim has benefitted from allocating his EV where it can have the most impact.
Between this chart and his launch angle graphs, it seems reasonable to assume that Heim’s swing is geared more toward elevation than it was in the past. Last year, when he really got hold of a ball, he was hitting it at about 18 degrees. This year, his hardest hits have come anywhere between 16 and 34. However, his soft hit rate is also the lowest it’s ever been. Maybe it’s just that he’s just adding some liners by muscling a few more pitches over the infield than he used to, pitches that he might previously have popped up or rolled over. As I said at the beginning, most of Heim’s underlying metrics show him doing things that he’s been able to do before. Being aggressive while still walking and striking out at the same rate, pulling the ball in the air with power. Only time will tell whether he can keep them going at the same time.