JAWS and the 2026 Hall of Fame Ballot: Hunter Pence
The following article is part of Jay Jaffe’s ongoing look at the candidates on the BBWAA 2026 Hall of Fame ballot. For a detailed introduction to this year’s ballot, and other candidates in the series, use the tool above; an introduction to JAWS can be found here. For a tentative schedule, see here. All WAR figures refer to the Baseball Reference version unless otherwise indicated.
| Player | Pos | Career WAR | Peak WAR | JAWS | H | HR | SB | AVG/OBP/SLG | OPS+ |
|---|---|---|---|---|---|---|---|---|---|
| Hunter Pence | RF | 30.9 | 26.2 | 28.6 | 1,791 | 244 | 120 | .279/.334/.461 | 114 |
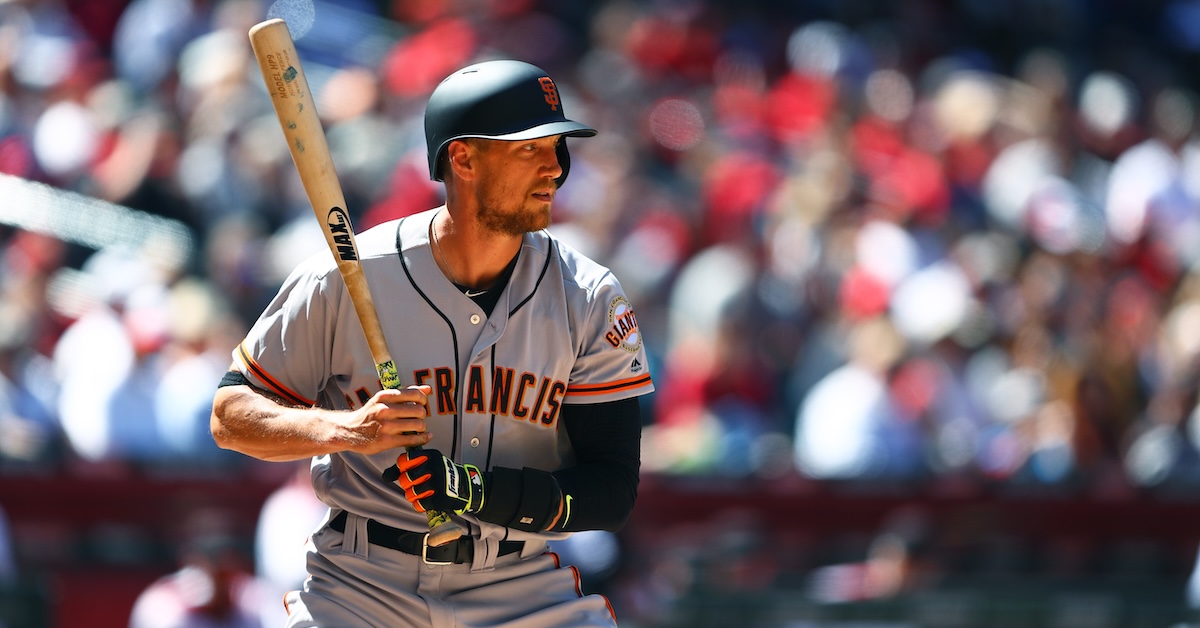
The great Vin Scully often described Hunter Pence as “all elbows and kneecaps,” and if you never understood the meaning of that colorful phrase, one look at the gangly 6-foot-4 right fielder, with his unorthodox swing, gait, and throwing mechanics, would explain a whole lot. Amplified by his high socks and what more than one writer termed his “bug-eyed intensity,” Pence’s on-field style was anything but textbook. As it turns out, there was a reason for that: In 2013, he was diagnosed with a condition called Scheuermann’s Disease, which caused his vertebrae to grow at different rates, deprived him of flexibility in his thoracic spine, and led him to find ways to compensate. Despite that significant disadvantage, Pence carved out an impressive 14-year major league career, making four All-Star teams and helping the Giants win the 2012 and ’14 World Series. Read the rest of this entry »