Diamondbacks Farm Director Josh Barfield Talks Development and Comps
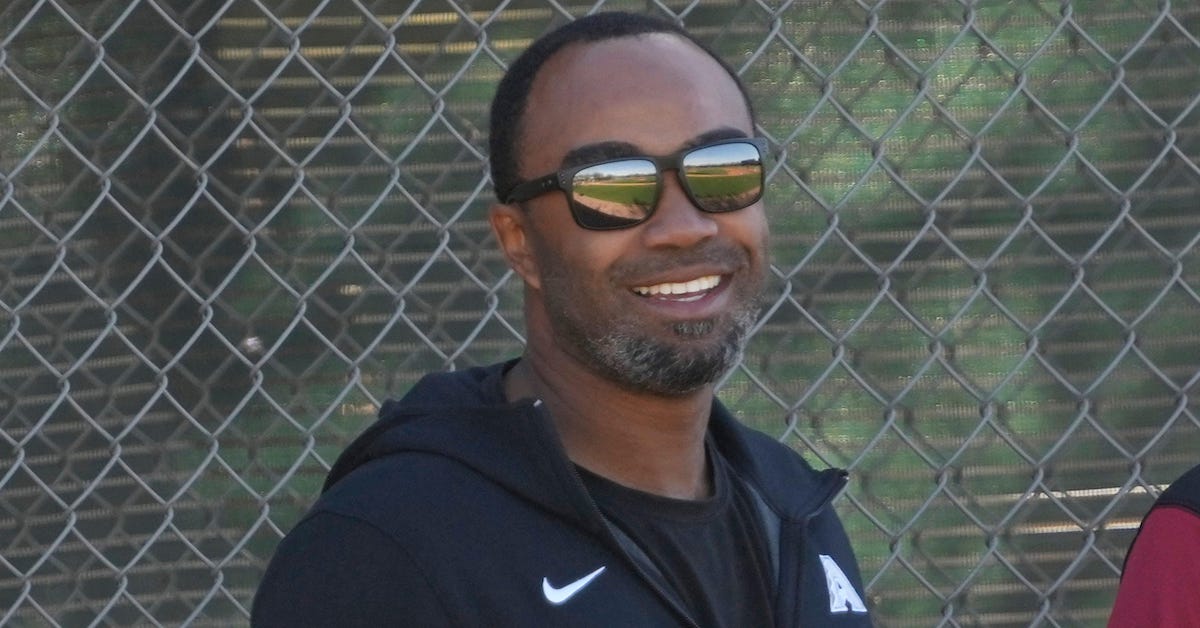
The Arizona Diamondbacks currently have one of baseball’s best farm systems and an improved player development system is playing a big role in its success. Led by Josh Barfield since 2019, the department has seen the likes of Corbin Carroll and Alek Thomas make their big league debuts in just the past year, and other high-ceiling prospects — Jordan Lawlar is among the notables — are coming fast. Moreover, the pipeline includes not just position players, but also promising pitchers. Playing in a powerhouse division that includes the Dodgers, Giants, and Padres, the D-backs will be counting on their young core as they strive to reach the postseason for the first time since 2017.
Barfield discussed a few of the team’s top prospects, and a pair of under-the-radar players to keep an eye on, in a recent phone call.
———
David Laurila: You had a relatively short playing career. Looking through the lens of your current job, how might you have been better developed?
Josh Barfield: “That’s a good question. I think having a better understanding of what I did well, the areas that I struggled in, and spending more time on [the latter]. A lot of times, guys will… it’s always fun to work on the things you’re good at, but I think the best players — the most talented ones I’ve been around — have done a really good job of recognizing their weaknesses and attacking those areas on a daily basis. Offensively, defensively, whether it’s a movement efficiency… training today is just so much more individualized compared to 20 years ago when I was coming up.” Read the rest of this entry »