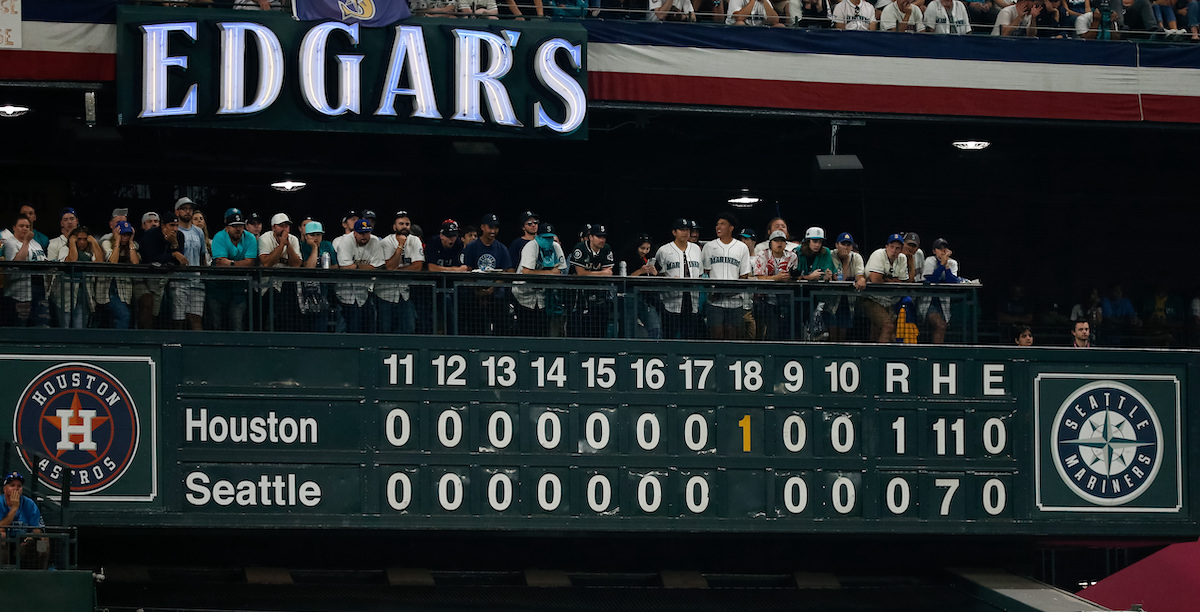
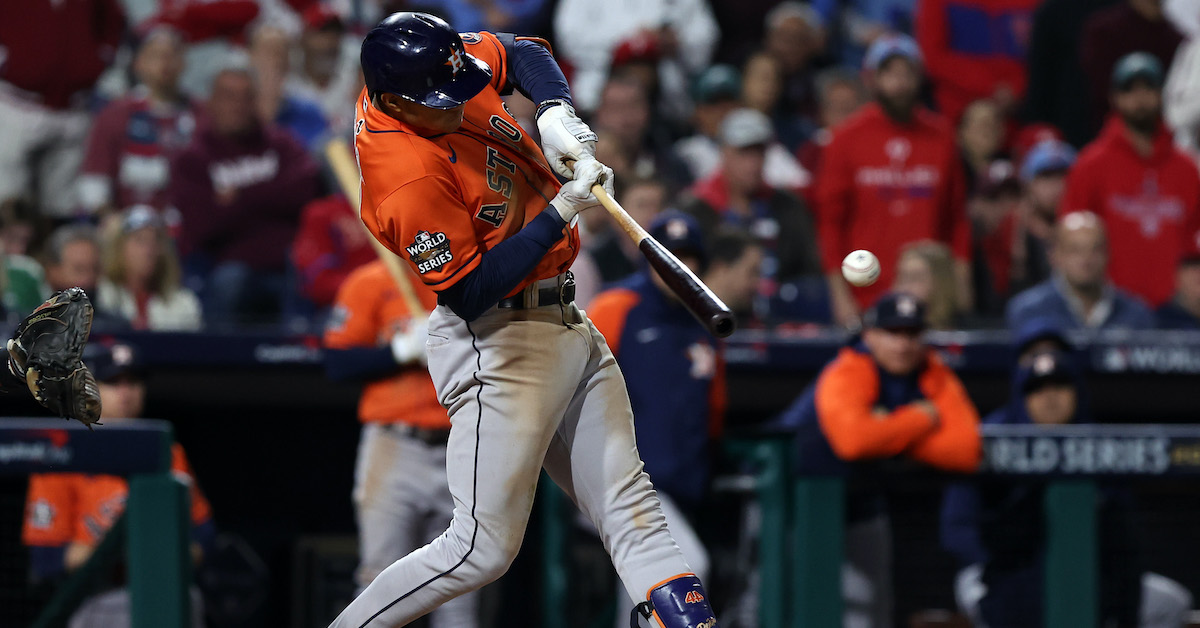
Dusty Baker Finally Wins the Big One
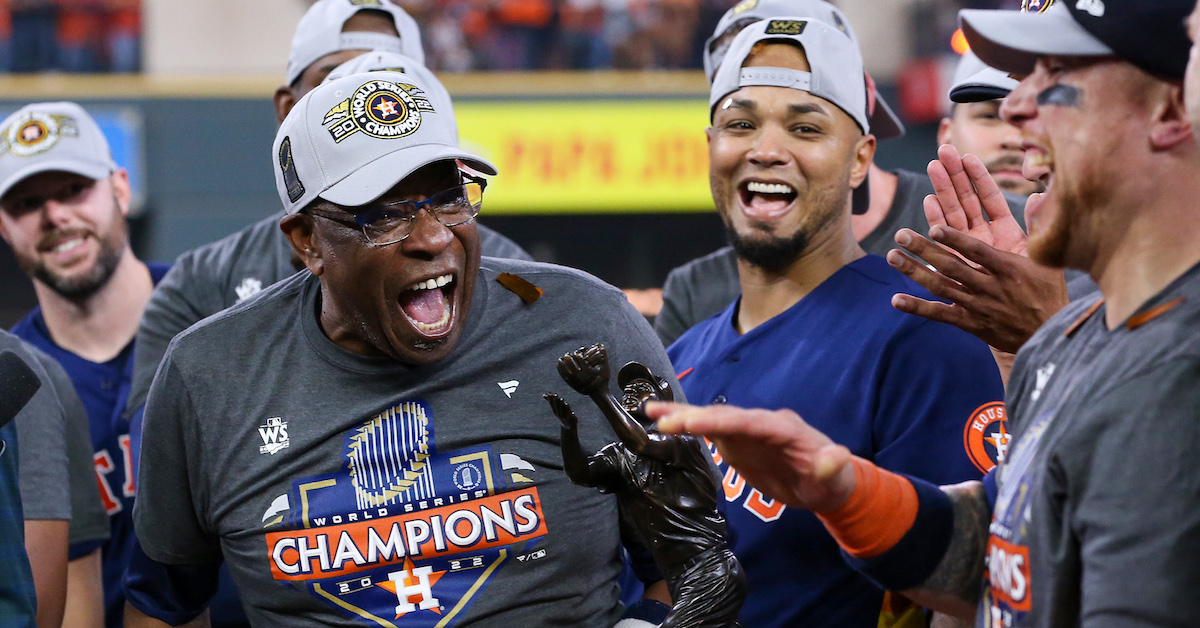
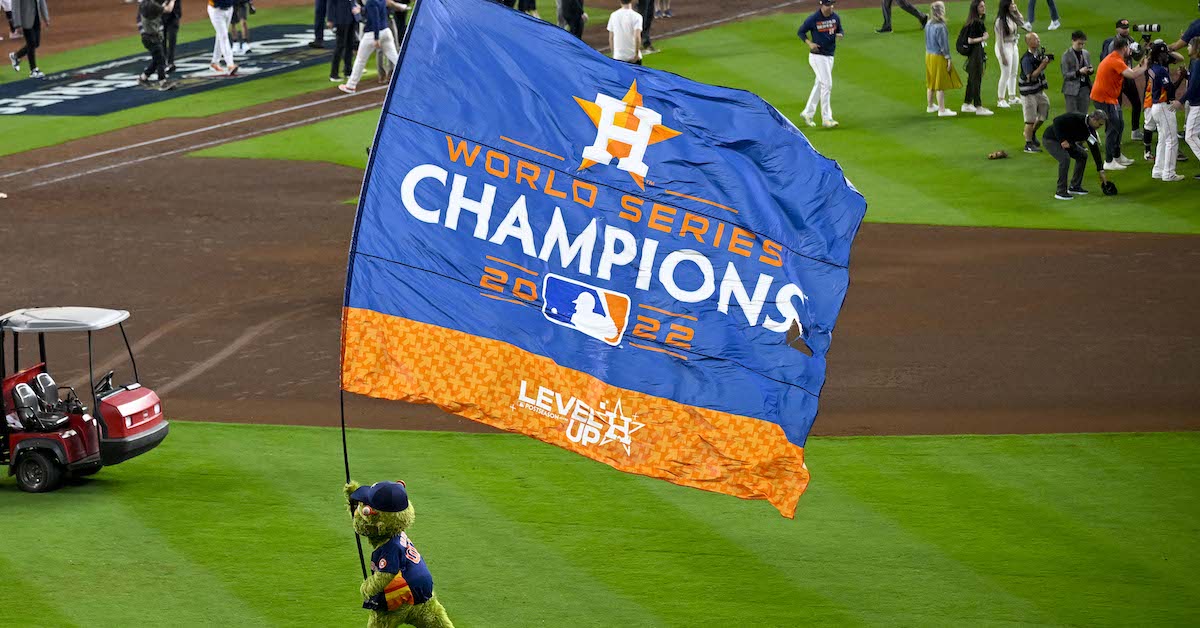
Dusty Baker is on the outside no longer. On Saturday night, the manager with the highest win total of any skipper never to pilot a World Series winner shed that distinction, as the Astros secured their championship by beating the Phillies, 4–1, in Game 6 at Minute Maid Park. After managing for 25 seasons — 12 of them with at least 90 wins — and reaching the World Series two other times (2002 and ’21), the 73-year-old Baker finally won one:
We are crying. ? #WorldSeries pic.twitter.com/DnUQ67bz25
— MLB (@MLB) November 6, 2022
Not that he hadn’t already tasted champagne as the All-Star left fielder of the 1981 Dodgers. That makes him one of seven men to win championships as a player and manager during the division play era (1969 onward), and one of 22 overall, not counting player-managers.
Saturday’s victory made Baker the oldest manager to win a World Series, but he viewed the significance of his accomplishment differently. “I don’t think about being the oldest,” he told reporters after the victory. “I don’t think about my age. But I do think about being the third Black manager with Dave Roberts and my good friend Cito Gaston, who was responsible really for me as a kid when I first signed with the Braves.”
In a game that’s all too lacking in diversity at the leadership levels, Baker has remained mindful of his status. Prior to Game 6, he said, “I do know that there’s certain pressure from a lot of people that are pulling for me, especially people of color. And that part I do feel. I hear it every day… and so I feel that I’ve been chosen for this.”
As the manager who took over the Astros amid the fallout from their illegal electronic sign stealing, Baker was an inspired if counterintuitive choice. A commanding presence in the clubhouse and with the media, he helped deflect attention away from an owner who shirked responsibility and a squad whose star players seemed to go through the motions in apologizing for their roles in the scandal before swiftly pivoting to an us-against-everyone rallying cry. Though hardly averse to the use of sabermetrics in decision-making, Baker also brought a warmth and humanity to an organization whose commitment to analytics under general manager Jeff Luhnow and manager A.J. Hinch had often been described as dehumanizing even before the trash can banging scheme came to light.
Only five players remain from the 2017 squad whose World Series victory over the Dodgers was subsequently tainted by the revelations of their sign stealing: Jose Altuve, Alex Bregman, Yuli Gurriel, Lance McCullers Jr., and Justin Verlander. The combination of their minimal contrition and Major League Baseball’s decision not to discipline them (particularly the hitters) for their participation has made them villains in the eyes of many fans, booed everywhere but Houston. Baker indicated his belief that such treatment galvanized the team:
“The boos and the jeers that we got all over the country, it bothered these guys, but it also motivated them at the same time. And it wasn’t an us against the world thing. It was more of a come together even closer type thing.”
Perhaps, but anger toward the 2017 group — and anyone else in an Astros uniform — for what McCullers frankly termed “the whole cheating scandal” still runs deep. On social media, seemingly minor matters that arose during this World Series, such as Aledmys Díaz leaning into a pitch, Martín Maldonado using a grandfathered Albert Pujols bat, and Framber Valdez removing his glove on the mound and rubbing his hands together were taken as evidence that they were still cheating, somehow. On the one hand, the paranoia is quite silly, particularly as the Phillies didn’t seem to get too worked up about such matters. On the other hand, this is the price that the Astros and MLB must continue to pay for what transpired… and what didn’t. For many fans, Baker’s victory is the most, if not the only, palatable way to accept the Astros’ championship.
In winning the World Series, Baker has almost certainly secured himself a spot in the Hall of Fame. His resumé might have been enough without a championship, as he ranks fourth in playoff appearances (12, a product of the Wild Card era but also a reminder of his routine success), ninth in victories (2,093), 10th in games managed (3,884), and 15th in games above .500 (303). Wilbert Robinson (1902, ’14–31) and Al Lopez (1951–69), each of whom won two pennants but lost twice in the Fall Classic, are already enshrined, as is every manager with at least 2,000 wins save for Baker and the recently un-retired Bruce Bochy, who has a spot awaiting him given his three World Series wins:
| Team | Years | W | L | W-L% | 90+ | Div | WC | Pennant | WS |
|---|---|---|---|---|---|---|---|---|---|
| Giants | 1993-2002 (10) | 840 | 715 | .540 | 5 | 2 | 1 | 1 | 0 |
| Cubs | 2003-2006 (4) | 322 | 326 | .497 | 0 | 1 | 0 | 0 | 0 |
| Reds | 2008-2013 (6) | 509 | 463 | .524 | 3 | 2 | 1 | 0 | 0 |
| Nationals | 2016-2017 (2) | 192 | 132 | .593 | 2 | 2 | 0 | 0 | 0 |
| Astros | 2020-2022 (3) | 230 | 1154 | .599 | 2 | 2 | 1 | 2 | 1 |
| Total | 25 years | 2093 | 1790 | .539 | 12 | 9 | 3 | 3 | 1 |
From a childhood in Riverside and Sacramento through a 19-year career as a major league outfielder with the Braves, Dodgers, Giants, and A’s, and then a quarter-century as a manager, Baker’s road to Cooperstown has been a long one. As the only manager ever to guide five franchises to division titles (the Giants, Cubs, Reds, Nationals, and Astros), he already had an achievement that set him apart from his peers, albeit one that he didn’t quite feel was cause for celebration. “I don’t really think nothing, other than why was I on so many different teams,” he told reporters as the playoffs began last year. “I’m serious. I feel fortunate to have gotten that many jobs, but I feel unfortunate that I shouldn’t have lost jobs when I was winning.”
Indeed, as I’ve noted before, at three of his previous four stops, Baker departed after seasons with at least 90 wins and postseason berths. In 2002, he won 95 games in guiding the Giants to their first World Series since 1989; it was the fourth time in six years his team had topped 90 wins, and third with a playoff berth. Yet the Giants didn’t offer him a contract after the 2002 World Series due to his strained relationship with managing partner Peter Magowan, and Baker landed with the Cubs. He nearly took them back to the World Series in his first season, only to be derailed by the Steve Bartman play and the Cubs’ sudden unraveling; by his fourth season in Chicago (2006), the team was 66–96 and in need of a new direction. The Cubs let his contract expire, the only time he left a losing team.
In 2008, Baker took over the Reds; after back-to-back, sub-.500 finishes, his team won 91 games and the NL Central in 2010, its first postseason berth since 1995. Following another sub-.500 season, he won 97 games and another NL Central title in 2012, but after 90 wins and a Wild Card berth in ’13, he was fired nonetheless. It took him two years to land another managerial job, and despite leading the Nationals to back-to-back NL East titles and seasons of 95 and 97 wins, the team let his contract lapse.
In 2019, Baker got as far as a second interview for the Phillies opening that went to Joe Girardi, whose team didn’t make the playoffs in either of the next two seasons. Girardi was fired after a 22–29 start in early June, but Rob Thomson guided them on an unlikely run that took them all the way to Game 6.
One team’s second choice is another team’s skipper, so it’s fortunate for the Astros that the then-70-year-old Baker was available when owner Jim Crane needed to make a quick but credible hiring to replace Hinch just a couple of weeks before pitchers and catchers reported for the 2020 season.
As we all know, the world shut down and the season was delayed by nearly four months. With Verlander lost to a forearm strain (he would eventually need Tommy John surgery), and Altuve, Bregman and Gurriel considerably less productive than before (ahem), the Astros went just 29–31 under Baker during the pandemic-shortened season. Even so, they finished second in a weak AL West and made the expanded playoffs as the sixth seed. There they caught fire, sweeping the Twins in the Wild Card Series, beating the A’s in a four-game Division Series, and taking the Rays to seven games in the ALCS before falling. Houston won 95 games last year, then knocked off the White Sox and Red Sox before losing to the Braves in a six-game World Series. This year, the Astros won an AL-high 106 games, then swept both the Mariners and Yankees to reach the World Series again.
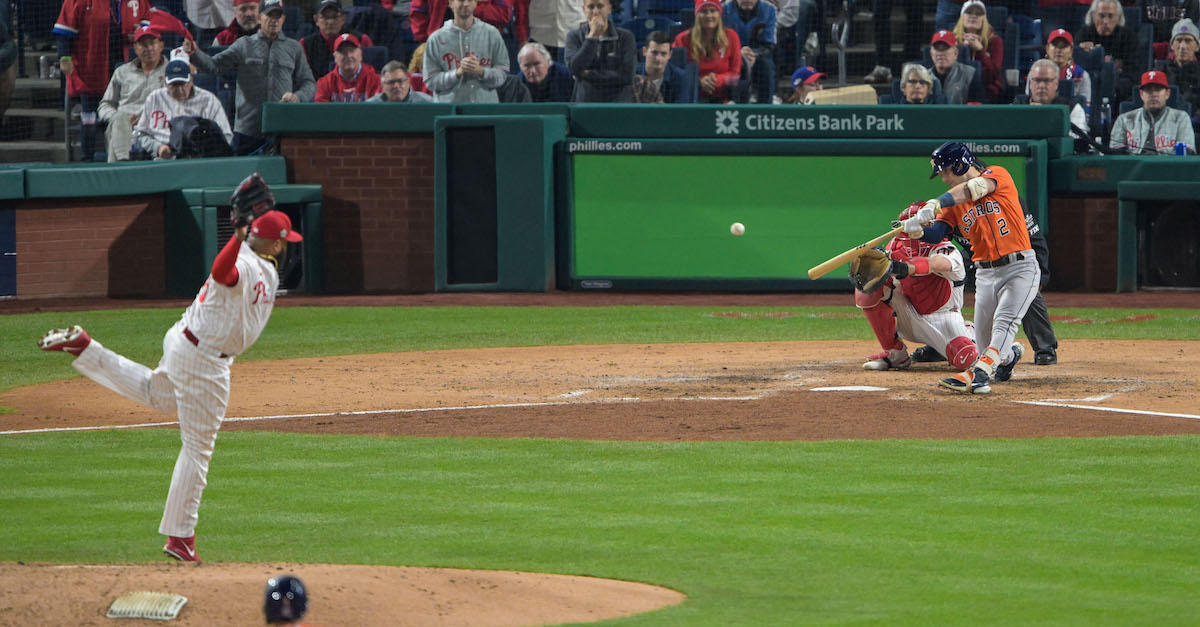
Despite falling behind by losing Games 1 and 3, the Astros came back to subdued the Phillies by winning three straight; the first two of those came at Citizens Bank Park, where Philadelphia had gone 6–0 during the postseason to that point. Beginning with a combined no-hitter started by Cristian Javier, the Astros held the Phillies to three runs and nine hits over their final three games, a .101/.223/.180 showing.
In losing the aforementioned games, Baker drew criticism for sticking too long with the struggling Verlander and McCullers; the pair combined to allow 12 runs in 9.1 innings, and a quicker hook might have given the Astros a better shot at winning. Yet the Astros allowed just six runs (five earned) in the 44.2 innings thrown by their other pitchers in the World Series, and the team as a whole posted a 2.29 ERA over the course of the postseason. Baker rarely called a wrong number when it came to his bullpen, which pitched to an 0.83 ERA in 54.1 innings for the postseason. The Astros went 11–2 during their march to the championship, including 5–1 in one-run games. Baker may not have run the team flawlessly, but it’s hard to find much fault with his performance.
This was a very different team from the won that one in 2017, as well as a reminder that the criticisms that were so easy to levy at Baker a decade or two ago no longer apply. Young pitchers thriving on his watch and handled with care? The 28-year-old Valdez (1.44 ERA in 25 innings) and 25-year-old Javier (0.71 ERA in 12.2 innings) were the team’s two best starters in October and November, and maxed out at 104 and 97 pitches, respectively; they helped compensate for Verlander and McCullers both posting ERAs above 5.00. Young position players getting playing time? Hello, Jeremy Peña, the first rookie position player to win World Series MVP honors, and at 25 years and 45 days old, the youngest position player to do so. Yordan Alvarez and Kyle Tucker are less than a year older than Peña, and both are already grizzled veterans, with three postseasons of regular play under their belts. Sacrifice bunts? Nine all season, four by the light-hitting Maldonado, and just two in the postseason, one of which — the bunt by Peña in ALCS Game 3 — was part of a daring sequence where only an insurance run was at stake.
I suspect the baseball world outside Houston will remain salty when it comes to the Astros so long as Altuve and Bregman wear the blue and orange, and perhaps so long as Crane owns the team, given his longstanding reputation for avoiding accountability. Crane hardly seems like a delight to work for, and it has not escaped notice that neither Baker, who entered the season on a one-year contract, nor general manager James Click, who is in the final year of a three-year deal, have contracts for 2023. Neither is a lock to return, though it’s believed that Baker will receive an extension offer, and that he wants to continue his career. “I’ve always said if I win one, I want to win two,” he said. Even if the rest of the baseball world may prefer another team wear the crown, it’s very hard to wish anything but the best for Dusty.

