For the 22nd consecutive season, the ZiPS projection system is unleashing a full set of prognostications. For more information on the ZiPS projections, please consult this year’s introduction, as well as MLB’s glossary entry. The team order is selected by lot, and the next team up is the Minnesota Twins.
Batters
The Minnesota Twins are in a weird place. They looked to be legitimate AL Central contenders when this year began, but for the second straight year, they started slowly and dug themselves a pretty good hole. Just like in 2024, the Twins then got hot, surged to a bit over .500, and looked to right the ship somewhat in May and early June. But this year, after six weeks of lousy play knocked them out for good, they traded away Carlos Correa, and half of their bullpen, including Jhoan Duran and Griffin Jax, slashing payroll and appearing to set off a full rebuilding process. The initial buzz was that Pablo López and Joe Ryan would be looking for new homes this offseason, but they’ve stayed put so far, and the Twins are at least publicly saying they plan to build around the players they didn’t trade away. And it sort of makes sense, though I’m not sure if the Twins see it the same way I do.
The lineup looks to me — and ZiPS — as decidedly below average, but it should be noted that ZiPS is considerably less bullish about Brooks Lee at shortstop and the London Symphony Orchestra-sized cast in left field, seeing both of these positions as real problems. That puts me into the camp of having really mixed feelings about the Correa trade. One can see why a team that clearly didn’t want to run a high payroll might be uneasy spending that much money on Correa, who had one abbreviated awesome season and two underwhelming ones in Minnesota. But at the same time, Correa represented at least potential star performance at shortstop. ZiPS is a big fan of Kaelen Culpepper, who I like to imagine is the son of former Vikings quarterback Daunte Culpepper, but I’m not sure whether the Twins agree with ZiPS and plan on promoting him aggressively, or if they are simply happy to roll with Lee at shortstop. ZiPS also hopes that Emmanuel Rodriguez is healthy and cleans out left field quickly, though it’s still on the fence about the future of Walker Jenkins.
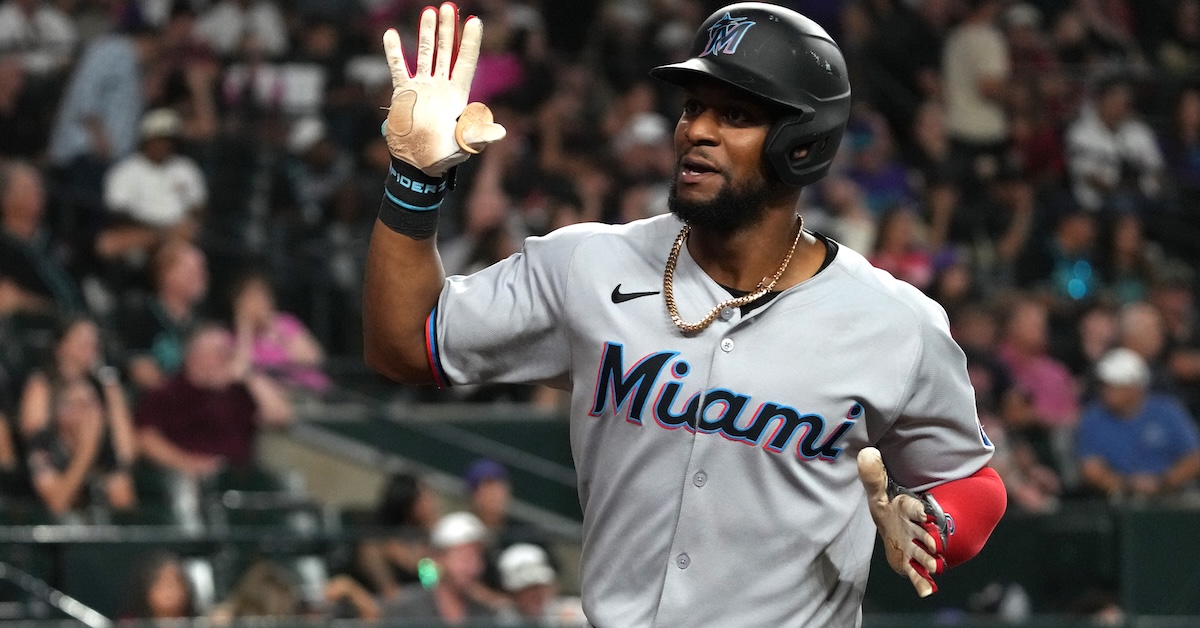
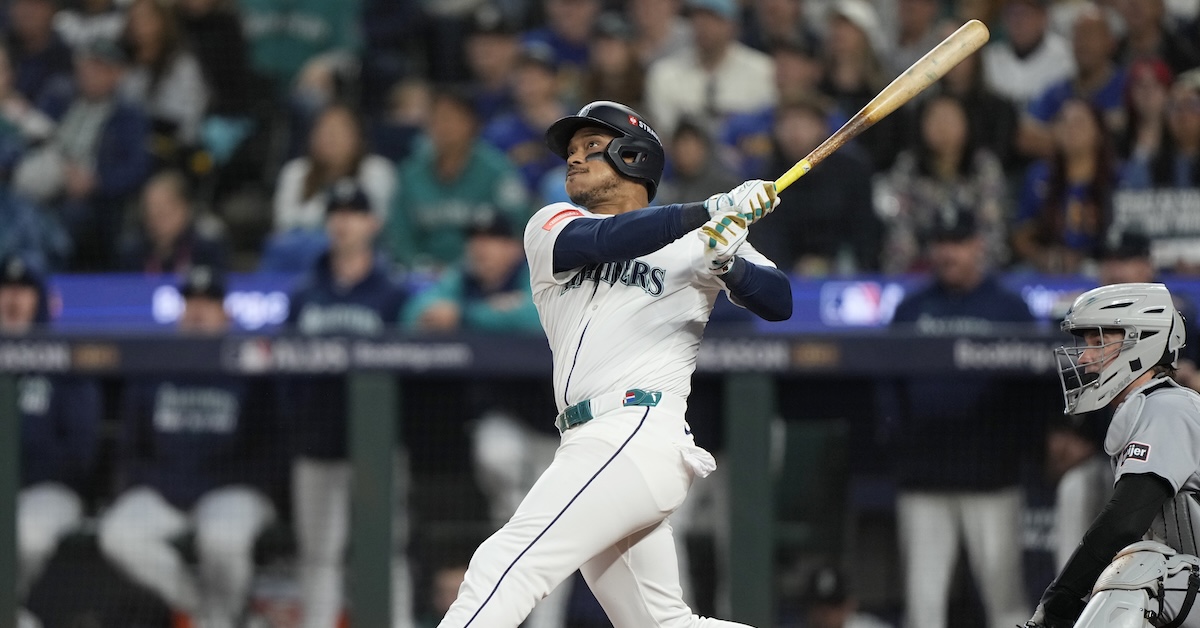
Byron Buxton remains, of course, the closest thing to a star on the team, but there’s always going to be the question of his health that limits the realistic expectation of his playing time. It’s encouraging that he had the most plate appearances of his major league career in 2025, but he’s also creeping into his mid-30s, when players become less durable. I remember being 32, also, and that was about the time where the aches and pains that I assumed would just magically go away in a week just… didn’t.
ZiPS is fine with Luke Keaschall at second, and sees Royce Lewis, Matt Wallner, and Ryan Jeffers as the serviceable middle class of the lineup. But in addition to the poor projections at shortstop and in left, the DH ones are unimpressive, and ZiPS sees very little merit in the Josh Bell signing. Overall, I’m not sure the Twins really have the lineup to be anything but fringe AL Central contenders. While they’ve talked about building around their remaining talent, that also doesn’t necessarily mean they’ll spend that much to work on their current holes rather than trying to develop in-house options over the next two or three years.
Pitchers
Keeping Ryan and López, if that’s what the Twins actually plan to do, is a pretty big deal. With those two at the top, Minnesota would have a legitimate playoff-caliber rotation. Bailey Ober’s history is better than his 2025 performance, and I don’t think it’s unreasonable to see him as a fine mid-rotation starter, and ZiPS has always been stanning for Zebby Matthews. Simeon Woods Richardson, Taj Bradley, and Mick Abel all get highly useful projections from ZiPS, and the computer really likes the organization’s minor league depth.
Meanwhile, Minnesota’s bullpen is interesting. Losing Duran and Jax really crossed out the top tier of the bullpen, but ZiPS still sees the remaining relievers as far more than merely viable. Cole Sands, Kody Funderburk, and Justin Topa all project as solid B-minus relievers, and ZiPS expects the Twins’ tradition of cobbling together a lot of their random Triple-A arms into real bullpen options to continue in 2026. Pierson Ohl, Connor Prielipp, David Festa, Andrew Morris, and Eric Orze all have projections just a shade less sunny than the first three pitchers mentioned at the top of the paragraph.
The easiest thing for people to do is set this past season as a baseline and understand that this team isn’t going to be much better in 2026. But using last season’s record as a baseline is generally a poor idea, as there’s a good argument that a lot of the 2025 Twins underperformed their actual ability. It’s the same kind of shortcut reasoning that caused people to underrate the Blue Jays going into this season, assuming that the Jays had to build up from their actual 74-win total in 2024 rather than from something closer to 81-83 wins, which was about Toronto’s true talent level. The 2025 Twins were better than a 70-92 team, but they do have some problems with their offense that they may or may not address between now and next season. If the season started today, the Twins look like a roughly .500 team, with their expected win total somewhere in the 78-84 range, but they’re close enough to good that if they were to hit their upside scenario, they could be an interesting contender. How much the Twins end up pushing that upside scenario, rather than simply deciding not to make the team worse, is something I just don’t know yet.
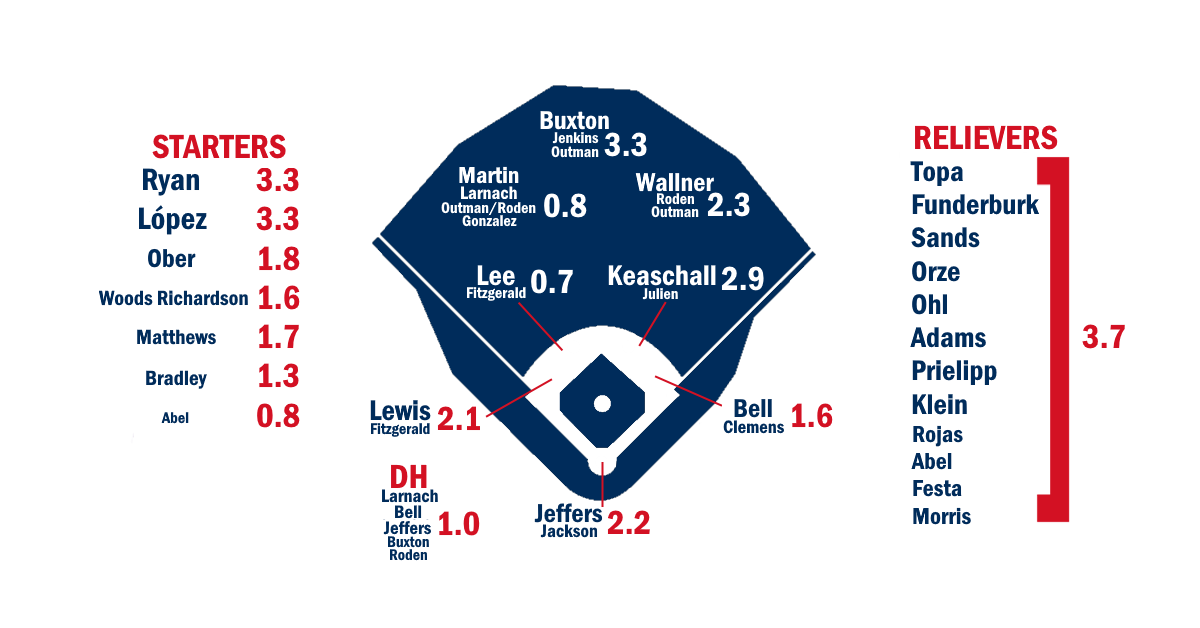
Ballpark graphic courtesy Eephus League. Depth charts constructed by way of those listed here. Size of player names is very roughly proportional to Depth Chart playing time. The final team projections may differ considerably from our Depth Chart playing time.
Batters – Standard
| Player |
B |
Age |
PO |
PA |
AB |
R |
H |
2B |
3B |
HR |
RBI |
BB |
SO |
SB |
CS |
| Byron Buxton |
R |
32 |
CF |
473 |
424 |
75 |
106 |
22 |
4 |
24 |
67 |
37 |
130 |
14 |
0 |
| Matt Wallner |
L |
28 |
RF |
506 |
436 |
63 |
104 |
25 |
2 |
23 |
69 |
54 |
155 |
4 |
2 |
| Kaelen Culpepper |
R |
23 |
SS |
510 |
465 |
62 |
115 |
15 |
3 |
13 |
61 |
34 |
105 |
12 |
3 |
| Luke Keaschall |
R |
23 |
2B |
373 |
322 |
49 |
85 |
18 |
1 |
7 |
44 |
37 |
62 |
17 |
4 |
| Ryan Jeffers |
R |
29 |
C |
428 |
375 |
47 |
92 |
20 |
1 |
12 |
47 |
41 |
86 |
2 |
1 |
| Royce Lewis |
R |
27 |
3B |
404 |
370 |
45 |
93 |
19 |
0 |
14 |
54 |
29 |
83 |
9 |
1 |
| James Outman |
L |
29 |
CF |
516 |
450 |
72 |
99 |
20 |
3 |
18 |
55 |
53 |
173 |
12 |
2 |
| Emmanuel Rodriguez |
L |
23 |
CF |
331 |
277 |
47 |
62 |
13 |
3 |
7 |
34 |
50 |
114 |
7 |
2 |
| Edouard Julien |
L |
27 |
2B |
520 |
443 |
55 |
106 |
20 |
2 |
11 |
50 |
69 |
151 |
5 |
3 |
| Alan Roden |
L |
26 |
LF |
438 |
385 |
57 |
100 |
21 |
2 |
7 |
47 |
38 |
68 |
7 |
2 |
| DaShawn Keirsey Jr. |
L |
29 |
CF |
417 |
381 |
48 |
93 |
17 |
4 |
6 |
42 |
27 |
110 |
23 |
5 |
| Mickey Gasper |
B |
30 |
C |
325 |
282 |
40 |
68 |
15 |
0 |
7 |
36 |
34 |
58 |
3 |
0 |
| Kody Clemens |
L |
30 |
1B |
392 |
357 |
49 |
82 |
16 |
3 |
16 |
51 |
28 |
95 |
4 |
1 |
| Gabriel Gonzalez |
R |
22 |
LF |
534 |
488 |
55 |
132 |
32 |
3 |
9 |
64 |
32 |
92 |
5 |
3 |
| Alex Jackson |
R |
30 |
C |
278 |
254 |
35 |
53 |
15 |
1 |
10 |
31 |
19 |
88 |
1 |
1 |
| Maddux Houghton |
R |
27 |
CF |
346 |
316 |
46 |
71 |
13 |
3 |
7 |
36 |
23 |
123 |
12 |
2 |
| Jhonny Pereda |
R |
30 |
C |
274 |
241 |
25 |
62 |
13 |
0 |
3 |
25 |
30 |
61 |
0 |
0 |
| Trevor Larnach |
L |
29 |
DH |
504 |
445 |
59 |
111 |
22 |
1 |
15 |
58 |
50 |
116 |
3 |
2 |
| Ryan Fitzgerald |
L |
32 |
SS |
355 |
317 |
37 |
72 |
17 |
2 |
8 |
37 |
30 |
92 |
4 |
3 |
| Josh Bell |
B |
33 |
1B |
530 |
465 |
53 |
117 |
21 |
1 |
17 |
62 |
58 |
96 |
0 |
2 |
| Ricardo Olivar |
R |
24 |
C |
424 |
380 |
49 |
91 |
19 |
1 |
9 |
46 |
37 |
97 |
5 |
1 |
| Noah Cardenas |
R |
26 |
C |
315 |
271 |
30 |
55 |
13 |
0 |
5 |
31 |
36 |
75 |
2 |
2 |
| Christian Vázquez |
R |
35 |
C |
271 |
248 |
23 |
56 |
10 |
0 |
4 |
23 |
18 |
48 |
1 |
1 |
| Brooks Lee |
B |
25 |
SS |
515 |
476 |
52 |
116 |
21 |
1 |
13 |
59 |
33 |
88 |
3 |
1 |
| Eduardo Tait |
L |
19 |
C |
475 |
442 |
47 |
99 |
28 |
1 |
10 |
50 |
22 |
113 |
0 |
0 |
| Walker Jenkins |
L |
21 |
CF |
389 |
343 |
44 |
82 |
17 |
2 |
7 |
43 |
37 |
81 |
9 |
2 |
| Ryan Kreidler |
R |
28 |
SS |
394 |
339 |
42 |
67 |
16 |
1 |
6 |
36 |
44 |
117 |
11 |
5 |
| Danny De Andrade |
R |
22 |
3B |
486 |
445 |
46 |
93 |
24 |
5 |
7 |
50 |
27 |
134 |
7 |
4 |
| Andrew Cossetti |
R |
26 |
C |
362 |
316 |
37 |
62 |
17 |
2 |
9 |
39 |
36 |
116 |
2 |
1 |
| Austin Martin |
R |
27 |
LF |
361 |
311 |
42 |
78 |
15 |
1 |
3 |
30 |
39 |
57 |
13 |
5 |
| Armando Alvarez |
R |
31 |
3B |
289 |
263 |
34 |
62 |
14 |
0 |
7 |
31 |
22 |
71 |
2 |
1 |
| Yunior Severino |
B |
26 |
3B |
448 |
399 |
43 |
89 |
17 |
1 |
11 |
47 |
42 |
144 |
2 |
1 |
| Kala’i Rosario |
R |
23 |
RF |
548 |
491 |
64 |
111 |
28 |
3 |
16 |
64 |
50 |
177 |
12 |
3 |
| Jay Thomason |
L |
24 |
3B |
235 |
206 |
27 |
39 |
7 |
2 |
5 |
25 |
23 |
77 |
9 |
1 |
| Rubel Cespedes |
L |
25 |
3B |
439 |
409 |
40 |
95 |
21 |
2 |
8 |
43 |
26 |
99 |
1 |
1 |
| Jeferson Morales |
R |
27 |
LF |
328 |
293 |
34 |
68 |
16 |
2 |
5 |
36 |
25 |
69 |
4 |
1 |
| Hendry Mendez |
L |
22 |
LF |
487 |
428 |
55 |
109 |
18 |
2 |
5 |
43 |
48 |
76 |
4 |
2 |
| Will Holland |
R |
28 |
SS |
301 |
265 |
37 |
55 |
11 |
2 |
5 |
28 |
25 |
91 |
11 |
3 |
| Tanner Schobel |
R |
25 |
SS |
456 |
411 |
48 |
90 |
17 |
2 |
7 |
42 |
38 |
109 |
6 |
3 |
| Poncho Ruiz |
R |
24 |
C |
347 |
311 |
32 |
65 |
21 |
0 |
1 |
26 |
33 |
88 |
0 |
1 |
| Jose Miranda |
R |
28 |
3B |
421 |
387 |
35 |
90 |
20 |
1 |
7 |
43 |
25 |
72 |
2 |
1 |
| Kyle DeBarge |
R |
22 |
2B |
531 |
477 |
63 |
96 |
20 |
4 |
6 |
46 |
44 |
146 |
30 |
5 |
| Patrick Winkel |
L |
26 |
C |
274 |
255 |
19 |
55 |
12 |
0 |
5 |
25 |
17 |
88 |
0 |
0 |
| Jake Rucker |
R |
26 |
2B |
431 |
393 |
41 |
90 |
17 |
2 |
6 |
40 |
28 |
86 |
5 |
4 |
| Carson McCusker |
R |
28 |
RF |
447 |
413 |
45 |
93 |
22 |
1 |
13 |
52 |
28 |
164 |
3 |
3 |
| Allan Cerda |
R |
26 |
CF |
277 |
243 |
27 |
42 |
10 |
1 |
8 |
29 |
29 |
106 |
2 |
2 |
| Caden Kendle |
R |
24 |
RF |
367 |
335 |
42 |
72 |
18 |
2 |
6 |
39 |
21 |
83 |
7 |
3 |
| Tyler Dearden |
L |
27 |
LF |
224 |
204 |
18 |
50 |
9 |
1 |
2 |
21 |
16 |
58 |
1 |
0 |
| Rayne Doncon |
R |
22 |
3B |
303 |
278 |
26 |
56 |
13 |
2 |
6 |
27 |
22 |
90 |
2 |
1 |
| Mike Ford |
L |
33 |
1B |
304 |
267 |
28 |
57 |
11 |
0 |
9 |
34 |
32 |
74 |
0 |
1 |
| Billy Amick |
R |
23 |
1B |
254 |
223 |
31 |
48 |
13 |
1 |
4 |
30 |
20 |
82 |
0 |
1 |
| Brandon Winokur |
R |
21 |
CF |
527 |
487 |
60 |
100 |
21 |
2 |
14 |
60 |
29 |
162 |
14 |
4 |
| Kyler Fedko |
R |
26 |
CF |
489 |
433 |
55 |
95 |
20 |
1 |
12 |
52 |
48 |
117 |
14 |
4 |
| Nate Baez |
R |
25 |
1B |
371 |
334 |
40 |
79 |
16 |
2 |
7 |
40 |
28 |
92 |
1 |
0 |
| Andy Lugo |
R |
22 |
1B |
348 |
323 |
34 |
73 |
19 |
2 |
4 |
33 |
18 |
88 |
8 |
2 |
| Misael Urbina |
R |
24 |
LF |
350 |
311 |
35 |
63 |
17 |
2 |
4 |
29 |
31 |
91 |
3 |
2 |
| Ben Ross |
R |
25 |
SS |
485 |
440 |
48 |
89 |
19 |
1 |
10 |
45 |
37 |
139 |
9 |
4 |
| Aaron Sabato |
R |
27 |
1B |
416 |
378 |
35 |
79 |
17 |
1 |
11 |
45 |
31 |
139 |
2 |
1 |
| Kyle Hess |
L |
27 |
RF |
251 |
224 |
24 |
43 |
10 |
2 |
2 |
22 |
21 |
80 |
3 |
2 |
| Jefferson Valladares |
R |
24 |
C |
242 |
219 |
20 |
43 |
10 |
1 |
4 |
25 |
11 |
71 |
2 |
1 |
| Jose Salas |
B |
23 |
1B |
335 |
303 |
34 |
63 |
14 |
1 |
5 |
32 |
16 |
108 |
11 |
4 |
| Jorel Ortega |
R |
25 |
2B |
405 |
364 |
40 |
74 |
15 |
2 |
7 |
37 |
33 |
120 |
7 |
3 |
| Garrett Spain |
L |
25 |
RF |
474 |
433 |
42 |
76 |
16 |
3 |
10 |
48 |
31 |
165 |
6 |
4 |
| Jaime Ferrer |
R |
23 |
1B |
365 |
330 |
30 |
65 |
19 |
2 |
3 |
36 |
15 |
97 |
1 |
1 |
Batters – Advanced
| Player |
PA |
BA |
OBP |
SLG |
OPS+ |
ISO |
BABIP |
Def |
WAR |
wOBA |
3YOPS+ |
RC |
| Byron Buxton |
473 |
.250 |
.319 |
.491 |
119 |
.241 |
.304 |
2 |
3.0 |
.343 |
111 |
69 |
| Matt Wallner |
506 |
.239 |
.340 |
.463 |
119 |
.224 |
.314 |
0 |
2.1 |
.348 |
119 |
70 |
| Kaelen Culpepper |
510 |
.247 |
.314 |
.376 |
90 |
.129 |
.294 |
2 |
1.9 |
.305 |
92 |
59 |
| Luke Keaschall |
373 |
.264 |
.354 |
.391 |
106 |
.127 |
.308 |
0 |
1.8 |
.330 |
107 |
50 |
| Ryan Jeffers |
428 |
.245 |
.333 |
.400 |
101 |
.155 |
.289 |
-4 |
1.6 |
.322 |
97 |
51 |
| Royce Lewis |
404 |
.251 |
.307 |
.416 |
97 |
.165 |
.289 |
1 |
1.4 |
.313 |
98 |
49 |
| James Outman |
516 |
.220 |
.312 |
.398 |
94 |
.178 |
.313 |
-2 |
1.3 |
.311 |
96 |
59 |
| Emmanuel Rodriguez |
331 |
.224 |
.347 |
.368 |
98 |
.144 |
.353 |
1 |
1.3 |
.321 |
104 |
38 |
| Edouard Julien |
520 |
.239 |
.347 |
.368 |
98 |
.129 |
.338 |
-6 |
1.2 |
.320 |
97 |
59 |
| Alan Roden |
438 |
.260 |
.342 |
.379 |
100 |
.119 |
.300 |
3 |
1.2 |
.320 |
102 |
52 |
| DaShawn Keirsey Jr. |
417 |
.244 |
.300 |
.357 |
81 |
.113 |
.328 |
5 |
1.1 |
.289 |
82 |
48 |
| Mickey Gasper |
325 |
.241 |
.335 |
.369 |
95 |
.128 |
.281 |
-4 |
1.0 |
.314 |
92 |
35 |
| Kody Clemens |
392 |
.230 |
.292 |
.426 |
95 |
.196 |
.268 |
8 |
1.0 |
.309 |
90 |
46 |
| Gabriel Gonzalez |
534 |
.270 |
.326 |
.404 |
100 |
.134 |
.318 |
-1 |
0.9 |
.319 |
101 |
67 |
| Alex Jackson |
278 |
.209 |
.273 |
.394 |
81 |
.185 |
.276 |
3 |
0.9 |
.290 |
80 |
28 |
| Maddux Houghton |
346 |
.225 |
.286 |
.351 |
75 |
.126 |
.344 |
5 |
0.7 |
.281 |
76 |
35 |
| Jhonny Pereda |
274 |
.257 |
.341 |
.349 |
92 |
.092 |
.333 |
-3 |
0.7 |
.309 |
90 |
29 |
| Trevor Larnach |
504 |
.249 |
.325 |
.404 |
100 |
.155 |
.306 |
0 |
0.6 |
.318 |
98 |
60 |
| Ryan Fitzgerald |
355 |
.227 |
.302 |
.369 |
84 |
.142 |
.295 |
-1 |
0.6 |
.296 |
80 |
37 |
| Josh Bell |
530 |
.252 |
.338 |
.411 |
106 |
.159 |
.284 |
-5 |
0.5 |
.328 |
103 |
65 |
| Ricardo Olivar |
424 |
.239 |
.314 |
.366 |
87 |
.127 |
.299 |
-7 |
0.6 |
.301 |
90 |
45 |
| Noah Cardenas |
315 |
.203 |
.311 |
.306 |
72 |
.103 |
.262 |
2 |
0.6 |
.283 |
73 |
27 |
| Christian Vázquez |
271 |
.226 |
.281 |
.315 |
65 |
.089 |
.265 |
6 |
0.6 |
.265 |
65 |
23 |
| Brooks Lee |
515 |
.244 |
.293 |
.374 |
83 |
.130 |
.275 |
-5 |
0.5 |
.291 |
84 |
53 |
| Eduardo Tait |
475 |
.224 |
.265 |
.360 |
71 |
.136 |
.279 |
1 |
0.4 |
.271 |
77 |
42 |
| Walker Jenkins |
389 |
.239 |
.321 |
.362 |
89 |
.123 |
.294 |
-5 |
0.4 |
.303 |
93 |
43 |
| Ryan Kreidler |
394 |
.198 |
.299 |
.304 |
68 |
.106 |
.282 |
2 |
0.4 |
.275 |
69 |
35 |
| Danny De Andrade |
486 |
.209 |
.274 |
.333 |
67 |
.124 |
.283 |
8 |
0.4 |
.269 |
72 |
44 |
| Andrew Cossetti |
362 |
.196 |
.296 |
.348 |
77 |
.152 |
.277 |
-3 |
0.4 |
.288 |
79 |
33 |
| Austin Martin |
361 |
.251 |
.345 |
.334 |
90 |
.083 |
.299 |
0 |
0.3 |
.308 |
90 |
41 |
| Armando Alvarez |
289 |
.236 |
.298 |
.369 |
83 |
.133 |
.297 |
-1 |
0.3 |
.293 |
81 |
30 |
| Yunior Severino |
448 |
.223 |
.301 |
.353 |
80 |
.130 |
.320 |
-2 |
0.2 |
.290 |
81 |
43 |
| Kala’i Rosario |
548 |
.226 |
.303 |
.393 |
90 |
.167 |
.319 |
-2 |
0.2 |
.305 |
96 |
62 |
| Jay Thomason |
235 |
.189 |
.281 |
.316 |
65 |
.127 |
.274 |
-1 |
-0.1 |
.268 |
70 |
21 |
| Rubel Cespedes |
439 |
.232 |
.280 |
.352 |
73 |
.120 |
.288 |
0 |
-0.1 |
.277 |
76 |
41 |
| Jeferson Morales |
328 |
.232 |
.308 |
.352 |
82 |
.120 |
.288 |
-1 |
-0.1 |
.293 |
85 |
33 |
| Hendry Mendez |
487 |
.255 |
.334 |
.341 |
88 |
.086 |
.300 |
-3 |
-0.1 |
.303 |
90 |
50 |
| Will Holland |
301 |
.208 |
.291 |
.321 |
69 |
.113 |
.296 |
-5 |
-0.3 |
.275 |
68 |
28 |
| Tanner Schobel |
456 |
.219 |
.289 |
.321 |
69 |
.102 |
.281 |
-5 |
-0.3 |
.273 |
73 |
41 |
| Poncho Ruiz |
347 |
.209 |
.288 |
.286 |
60 |
.077 |
.288 |
-2 |
-0.3 |
.261 |
63 |
26 |
| Jose Miranda |
421 |
.233 |
.287 |
.344 |
74 |
.111 |
.269 |
-3 |
-0.3 |
.278 |
74 |
39 |
| Kyle DeBarge |
531 |
.201 |
.277 |
.298 |
59 |
.096 |
.277 |
0 |
-0.4 |
.259 |
64 |
47 |
| Patrick Winkel |
274 |
.216 |
.266 |
.322 |
62 |
.106 |
.309 |
-3 |
-0.4 |
.260 |
64 |
22 |
| Jake Rucker |
431 |
.229 |
.288 |
.328 |
70 |
.099 |
.279 |
-2 |
-0.4 |
.274 |
71 |
40 |
| Carson McCusker |
447 |
.225 |
.280 |
.378 |
79 |
.153 |
.339 |
0 |
-0.4 |
.287 |
80 |
46 |
| Allan Cerda |
277 |
.173 |
.274 |
.321 |
64 |
.148 |
.264 |
-2 |
-0.5 |
.268 |
66 |
23 |
| Caden Kendle |
367 |
.215 |
.275 |
.334 |
67 |
.119 |
.268 |
3 |
-0.5 |
.269 |
71 |
33 |
| Tyler Dearden |
224 |
.245 |
.308 |
.328 |
76 |
.083 |
.333 |
-3 |
-0.5 |
.284 |
77 |
21 |
| Rayne Doncon |
303 |
.201 |
.261 |
.327 |
61 |
.126 |
.275 |
0 |
-0.5 |
.259 |
69 |
25 |
| Mike Ford |
304 |
.213 |
.306 |
.356 |
82 |
.143 |
.261 |
-3 |
-0.5 |
.295 |
79 |
30 |
| Billy Amick |
254 |
.215 |
.299 |
.336 |
76 |
.121 |
.321 |
-1 |
-0.5 |
.284 |
80 |
23 |
| Brandon Winokur |
527 |
.205 |
.262 |
.343 |
65 |
.138 |
.277 |
-1 |
-0.5 |
.265 |
75 |
48 |
| Kyler Fedko |
489 |
.219 |
.301 |
.353 |
80 |
.134 |
.273 |
-12 |
-0.6 |
.290 |
83 |
50 |
| Nate Baez |
371 |
.237 |
.305 |
.359 |
83 |
.122 |
.306 |
-4 |
-0.7 |
.293 |
84 |
37 |
| Andy Lugo |
348 |
.226 |
.276 |
.334 |
68 |
.108 |
.299 |
1 |
-0.7 |
.269 |
73 |
32 |
| Misael Urbina |
350 |
.203 |
.280 |
.309 |
63 |
.106 |
.273 |
1 |
-0.8 |
.264 |
63 |
28 |
| Ben Ross |
485 |
.202 |
.266 |
.318 |
61 |
.116 |
.271 |
-5 |
-0.8 |
.259 |
63 |
41 |
| Aaron Sabato |
416 |
.209 |
.276 |
.347 |
71 |
.138 |
.298 |
0 |
-0.9 |
.275 |
73 |
37 |
| Kyle Hess |
251 |
.192 |
.275 |
.281 |
55 |
.089 |
.289 |
0 |
-0.9 |
.253 |
58 |
19 |
| Jefferson Valladares |
242 |
.196 |
.264 |
.306 |
57 |
.110 |
.271 |
-8 |
-1.0 |
.255 |
64 |
19 |
| Jose Salas |
335 |
.208 |
.258 |
.310 |
56 |
.102 |
.305 |
3 |
-1.0 |
.251 |
62 |
28 |
| Jorel Ortega |
405 |
.203 |
.275 |
.313 |
62 |
.110 |
.283 |
-6 |
-1.0 |
.263 |
66 |
34 |
| Garrett Spain |
474 |
.176 |
.239 |
.296 |
49 |
.120 |
.256 |
10 |
-1.0 |
.238 |
55 |
34 |
| Jaime Ferrer |
365 |
.197 |
.256 |
.294 |
52 |
.097 |
.270 |
-1 |
-1.9 |
.244 |
56 |
25 |
Batters – Top Near-Age Offensive Comps
Batters – 80th/20th Percentiles
| Player |
80th BA |
80th OBP |
80th SLG |
80th OPS+ |
80th WAR |
20th BA |
20th OBP |
20th SLG |
20th OPS+ |
20th WAR |
| Byron Buxton |
.277 |
.344 |
.548 |
139 |
4.1 |
.227 |
.295 |
.425 |
96 |
1.7 |
| Matt Wallner |
.266 |
.364 |
.520 |
139 |
3.2 |
.213 |
.315 |
.402 |
98 |
0.9 |
| Kaelen Culpepper |
.276 |
.340 |
.428 |
109 |
3.1 |
.224 |
.289 |
.334 |
75 |
0.8 |
| Luke Keaschall |
.295 |
.383 |
.445 |
127 |
2.8 |
.237 |
.326 |
.343 |
87 |
0.9 |
| Ryan Jeffers |
.273 |
.358 |
.450 |
121 |
2.6 |
.220 |
.307 |
.349 |
82 |
0.6 |
| Royce Lewis |
.276 |
.332 |
.465 |
117 |
2.3 |
.229 |
.282 |
.370 |
80 |
0.5 |
| James Outman |
.247 |
.337 |
.455 |
114 |
2.6 |
.196 |
.289 |
.349 |
75 |
0.2 |
| Emmanuel Rodriguez |
.257 |
.377 |
.427 |
120 |
2.2 |
.192 |
.313 |
.323 |
79 |
0.5 |
| Edouard Julien |
.268 |
.375 |
.421 |
117 |
2.5 |
.211 |
.319 |
.325 |
77 |
0.0 |
| Alan Roden |
.287 |
.367 |
.426 |
118 |
2.2 |
.235 |
.315 |
.333 |
82 |
0.2 |
| DaShawn Keirsey Jr. |
.275 |
.326 |
.406 |
99 |
2.1 |
.218 |
.268 |
.310 |
60 |
0.0 |
| Mickey Gasper |
.270 |
.364 |
.421 |
115 |
1.8 |
.210 |
.310 |
.321 |
75 |
0.3 |
| Kody Clemens |
.259 |
.318 |
.481 |
117 |
2.1 |
.203 |
.267 |
.377 |
75 |
0.1 |
| Gabriel Gonzalez |
.300 |
.355 |
.450 |
122 |
2.3 |
.240 |
.295 |
.354 |
83 |
-0.3 |
| Alex Jackson |
.240 |
.304 |
.455 |
103 |
1.7 |
.182 |
.243 |
.326 |
57 |
0.1 |
| Maddux Houghton |
.253 |
.312 |
.402 |
96 |
1.6 |
.195 |
.257 |
.311 |
56 |
-0.1 |
| Jhonny Pereda |
.285 |
.367 |
.390 |
110 |
1.3 |
.227 |
.310 |
.302 |
72 |
0.1 |
| Trevor Larnach |
.267 |
.348 |
.452 |
116 |
1.6 |
.225 |
.302 |
.365 |
85 |
-0.3 |
| Ryan Fitzgerald |
.256 |
.330 |
.413 |
101 |
1.3 |
.200 |
.277 |
.327 |
67 |
-0.1 |
| Josh Bell |
.280 |
.361 |
.452 |
123 |
1.5 |
.225 |
.312 |
.368 |
89 |
-0.6 |
| Ricardo Olivar |
.269 |
.341 |
.417 |
106 |
1.6 |
.214 |
.287 |
.324 |
71 |
-0.3 |
| Noah Cardenas |
.231 |
.340 |
.358 |
92 |
1.4 |
.174 |
.282 |
.260 |
54 |
-0.1 |
| Christian Vázquez |
.258 |
.314 |
.364 |
85 |
1.3 |
.193 |
.253 |
.266 |
45 |
-0.1 |
| Brooks Lee |
.274 |
.322 |
.424 |
104 |
1.9 |
.218 |
.267 |
.333 |
66 |
-0.6 |
| Eduardo Tait |
.253 |
.292 |
.417 |
91 |
1.6 |
.199 |
.238 |
.315 |
52 |
-0.7 |
| Walker Jenkins |
.266 |
.347 |
.411 |
109 |
1.4 |
.212 |
.292 |
.313 |
71 |
-0.4 |
| Ryan Kreidler |
.225 |
.328 |
.357 |
88 |
1.4 |
.167 |
.271 |
.258 |
48 |
-0.5 |
| Danny De Andrade |
.234 |
.300 |
.375 |
84 |
1.5 |
.186 |
.247 |
.294 |
50 |
-0.6 |
| Andrew Cossetti |
.222 |
.323 |
.404 |
98 |
1.3 |
.166 |
.263 |
.300 |
56 |
-0.5 |
| Austin Martin |
.280 |
.373 |
.378 |
107 |
1.1 |
.227 |
.321 |
.299 |
74 |
-0.4 |
| Armando Alvarez |
.267 |
.329 |
.415 |
103 |
1.0 |
.206 |
.270 |
.317 |
63 |
-0.5 |
| Yunior Severino |
.249 |
.323 |
.405 |
99 |
1.2 |
.197 |
.277 |
.307 |
63 |
-0.7 |
| Kala’i Rosario |
.254 |
.330 |
.445 |
112 |
1.7 |
.200 |
.273 |
.338 |
70 |
-1.1 |
| Jay Thomason |
.219 |
.312 |
.374 |
87 |
0.5 |
.156 |
.252 |
.262 |
44 |
-0.7 |
| Rubel Cespedes |
.260 |
.309 |
.395 |
90 |
0.8 |
.207 |
.253 |
.308 |
53 |
-1.2 |
| Jeferson Morales |
.257 |
.333 |
.398 |
98 |
0.5 |
.206 |
.279 |
.310 |
63 |
-0.9 |
| Hendry Mendez |
.283 |
.361 |
.381 |
105 |
0.9 |
.225 |
.305 |
.303 |
70 |
-1.1 |
| Will Holland |
.235 |
.320 |
.372 |
91 |
0.5 |
.179 |
.265 |
.280 |
52 |
-0.9 |
| Tanner Schobel |
.244 |
.314 |
.362 |
86 |
0.7 |
.193 |
.264 |
.278 |
51 |
-1.2 |
| Poncho Ruiz |
.241 |
.319 |
.331 |
81 |
0.5 |
.177 |
.257 |
.240 |
40 |
-1.2 |
| Jose Miranda |
.259 |
.314 |
.389 |
94 |
0.8 |
.207 |
.265 |
.303 |
57 |
-1.2 |
| Kyle DeBarge |
.230 |
.303 |
.342 |
78 |
0.8 |
.177 |
.250 |
.259 |
43 |
-1.5 |
| Patrick Winkel |
.245 |
.298 |
.363 |
80 |
0.3 |
.182 |
.235 |
.275 |
41 |
-1.1 |
| Jake Rucker |
.258 |
.318 |
.374 |
89 |
0.6 |
.205 |
.263 |
.288 |
53 |
-1.3 |
| Carson McCusker |
.256 |
.310 |
.428 |
100 |
0.7 |
.192 |
.247 |
.325 |
57 |
-1.7 |
| Allan Cerda |
.201 |
.298 |
.374 |
82 |
0.1 |
.144 |
.245 |
.266 |
44 |
-1.1 |
| Caden Kendle |
.242 |
.302 |
.380 |
86 |
0.3 |
.189 |
.254 |
.292 |
51 |
-1.2 |
| Tyler Dearden |
.275 |
.336 |
.368 |
93 |
0.0 |
.212 |
.275 |
.281 |
56 |
-1.1 |
| Rayne Doncon |
.233 |
.295 |
.381 |
83 |
0.4 |
.172 |
.232 |
.274 |
41 |
-1.2 |
| Mike Ford |
.236 |
.335 |
.409 |
104 |
0.3 |
.182 |
.278 |
.305 |
62 |
-1.3 |
| Billy Amick |
.241 |
.325 |
.382 |
94 |
0.0 |
.188 |
.271 |
.292 |
58 |
-1.1 |
| Brandon Winokur |
.234 |
.288 |
.395 |
83 |
0.6 |
.179 |
.235 |
.296 |
48 |
-1.8 |
| Kyler Fedko |
.242 |
.323 |
.396 |
97 |
0.5 |
.193 |
.275 |
.313 |
63 |
-1.6 |
| Nate Baez |
.259 |
.330 |
.409 |
101 |
0.1 |
.210 |
.279 |
.321 |
67 |
-1.4 |
| Andy Lugo |
.254 |
.303 |
.380 |
87 |
0.1 |
.198 |
.249 |
.292 |
52 |
-1.5 |
| Misael Urbina |
.233 |
.308 |
.347 |
81 |
-0.1 |
.177 |
.252 |
.265 |
45 |
-1.6 |
| Ben Ross |
.224 |
.288 |
.365 |
79 |
0.2 |
.174 |
.237 |
.272 |
43 |
-1.9 |
| Aaron Sabato |
.235 |
.304 |
.392 |
89 |
0.0 |
.185 |
.251 |
.303 |
53 |
-1.8 |
| Kyle Hess |
.220 |
.306 |
.328 |
73 |
-0.3 |
.165 |
.250 |
.242 |
37 |
-1.5 |
| Jefferson Valladares |
.227 |
.295 |
.362 |
79 |
-0.3 |
.167 |
.233 |
.262 |
36 |
-1.6 |
| Jose Salas |
.238 |
.283 |
.354 |
75 |
-0.3 |
.182 |
.231 |
.271 |
40 |
-1.7 |
| Jorel Ortega |
.229 |
.302 |
.365 |
83 |
0.1 |
.171 |
.248 |
.262 |
42 |
-2.0 |
| Garrett Spain |
.203 |
.264 |
.340 |
69 |
0.3 |
.154 |
.214 |
.253 |
31 |
-2.0 |
| Jaime Ferrer |
.226 |
.286 |
.344 |
73 |
-1.0 |
.172 |
.233 |
.255 |
35 |
-2.6 |
Batters – Platoon Splits
| Player |
BA vs. L |
OBP vs. L |
SLG vs. L |
BA vs. R |
OBP vs. R |
SLG vs. R |
| Byron Buxton |
.258 |
.326 |
.500 |
.247 |
.316 |
.487 |
| Matt Wallner |
.225 |
.325 |
.420 |
.245 |
.347 |
.483 |
| Kaelen Culpepper |
.247 |
.313 |
.377 |
.248 |
.314 |
.376 |
| Luke Keaschall |
.263 |
.357 |
.384 |
.265 |
.353 |
.395 |
| Ryan Jeffers |
.261 |
.360 |
.412 |
.238 |
.319 |
.395 |
| Royce Lewis |
.254 |
.315 |
.432 |
.250 |
.303 |
.409 |
| James Outman |
.209 |
.302 |
.345 |
.225 |
.317 |
.424 |
| Emmanuel Rodriguez |
.220 |
.326 |
.366 |
.226 |
.356 |
.369 |
| Edouard Julien |
.227 |
.331 |
.333 |
.244 |
.353 |
.383 |
| Alan Roden |
.243 |
.328 |
.364 |
.266 |
.348 |
.385 |
| DaShawn Keirsey Jr. |
.235 |
.292 |
.319 |
.248 |
.304 |
.374 |
| Mickey Gasper |
.241 |
.323 |
.368 |
.241 |
.341 |
.369 |
| Kody Clemens |
.222 |
.286 |
.389 |
.233 |
.294 |
.442 |
| Gabriel Gonzalez |
.281 |
.337 |
.419 |
.265 |
.320 |
.396 |
| Alex Jackson |
.216 |
.289 |
.409 |
.205 |
.265 |
.386 |
| Maddux Houghton |
.233 |
.293 |
.367 |
.221 |
.283 |
.345 |
| Jhonny Pereda |
.267 |
.357 |
.360 |
.252 |
.331 |
.342 |
| Trevor Larnach |
.241 |
.308 |
.370 |
.252 |
.331 |
.415 |
| Ryan Fitzgerald |
.224 |
.294 |
.346 |
.229 |
.306 |
.381 |
| Josh Bell |
.248 |
.331 |
.406 |
.253 |
.340 |
.413 |
| Ricardo Olivar |
.246 |
.323 |
.381 |
.237 |
.309 |
.359 |
| Noah Cardenas |
.207 |
.330 |
.333 |
.201 |
.302 |
.293 |
| Christian Vázquez |
.225 |
.282 |
.310 |
.226 |
.281 |
.316 |
| Brooks Lee |
.243 |
.287 |
.371 |
.244 |
.296 |
.375 |
| Eduardo Tait |
.204 |
.256 |
.315 |
.231 |
.268 |
.374 |
| Walker Jenkins |
.234 |
.311 |
.330 |
.241 |
.325 |
.373 |
| Ryan Kreidler |
.208 |
.314 |
.308 |
.192 |
.291 |
.301 |
| Danny De Andrade |
.216 |
.281 |
.343 |
.206 |
.271 |
.328 |
| Andrew Cossetti |
.196 |
.304 |
.371 |
.196 |
.292 |
.338 |
| Austin Martin |
.257 |
.361 |
.336 |
.247 |
.336 |
.333 |
| Armando Alvarez |
.248 |
.306 |
.396 |
.228 |
.292 |
.352 |
| Yunior Severino |
.228 |
.298 |
.360 |
.221 |
.303 |
.350 |
| Kala’i Rosario |
.231 |
.315 |
.400 |
.224 |
.297 |
.390 |
| Jay Thomason |
.179 |
.266 |
.268 |
.193 |
.287 |
.333 |
| Rubel Cespedes |
.220 |
.268 |
.331 |
.237 |
.285 |
.361 |
| Jeferson Morales |
.235 |
.309 |
.378 |
.231 |
.307 |
.338 |
| Hendry Mendez |
.243 |
.318 |
.322 |
.259 |
.340 |
.348 |
| Will Holland |
.217 |
.305 |
.348 |
.202 |
.284 |
.306 |
| Tanner Schobel |
.220 |
.301 |
.331 |
.218 |
.285 |
.317 |
| Poncho Ruiz |
.213 |
.293 |
.281 |
.207 |
.286 |
.288 |
| Jose Miranda |
.244 |
.297 |
.370 |
.227 |
.283 |
.331 |
| Kyle DeBarge |
.204 |
.290 |
.307 |
.200 |
.271 |
.294 |
| Patrick Winkel |
.206 |
.250 |
.294 |
.219 |
.272 |
.332 |
| Jake Rucker |
.238 |
.297 |
.349 |
.225 |
.284 |
.318 |
| Carson McCusker |
.236 |
.291 |
.390 |
.221 |
.275 |
.372 |
| Allan Cerda |
.179 |
.284 |
.316 |
.169 |
.268 |
.324 |
| Caden Kendle |
.220 |
.282 |
.360 |
.213 |
.272 |
.323 |
| Tyler Dearden |
.234 |
.300 |
.328 |
.250 |
.312 |
.329 |
| Rayne Doncon |
.213 |
.276 |
.360 |
.196 |
.254 |
.312 |
| Mike Ford |
.213 |
.298 |
.333 |
.214 |
.309 |
.365 |
| Billy Amick |
.217 |
.304 |
.319 |
.214 |
.297 |
.344 |
| Brandon Winokur |
.211 |
.269 |
.346 |
.203 |
.259 |
.342 |
| Kyler Fedko |
.217 |
.306 |
.362 |
.221 |
.297 |
.349 |
| Nate Baez |
.234 |
.303 |
.355 |
.238 |
.306 |
.361 |
| Andy Lugo |
.229 |
.279 |
.344 |
.225 |
.275 |
.330 |
| Misael Urbina |
.200 |
.280 |
.305 |
.204 |
.279 |
.311 |
| Ben Ross |
.205 |
.279 |
.318 |
.201 |
.260 |
.318 |
| Aaron Sabato |
.215 |
.285 |
.354 |
.206 |
.272 |
.343 |
| Kyle Hess |
.186 |
.273 |
.220 |
.194 |
.276 |
.303 |
| Jefferson Valladares |
.209 |
.270 |
.299 |
.191 |
.262 |
.309 |
| Jose Salas |
.210 |
.259 |
.320 |
.207 |
.257 |
.305 |
| Jorel Ortega |
.209 |
.285 |
.327 |
.201 |
.271 |
.307 |
| Garrett Spain |
.168 |
.231 |
.269 |
.178 |
.242 |
.306 |
| Jaime Ferrer |
.202 |
.259 |
.313 |
.195 |
.255 |
.286 |
Pitchers – Standard
| Player |
T |
Age |
W |
L |
ERA |
G |
GS |
IP |
H |
ER |
HR |
BB |
SO |
| Joe Ryan |
R |
30 |
11 |
10 |
3.77 |
28 |
28 |
155.3 |
134 |
65 |
23 |
36 |
169 |
| Pablo López |
R |
30 |
10 |
7 |
3.69 |
25 |
25 |
141.3 |
131 |
58 |
16 |
37 |
141 |
| Bailey Ober |
R |
30 |
7 |
8 |
4.22 |
27 |
27 |
147.0 |
142 |
69 |
23 |
34 |
132 |
| Taj Bradley |
R |
25 |
7 |
8 |
4.27 |
28 |
28 |
147.7 |
138 |
70 |
19 |
51 |
136 |
| Zebby Matthews |
R |
26 |
7 |
6 |
3.93 |
23 |
22 |
112.3 |
111 |
49 |
16 |
27 |
118 |
| Simeon Woods Richardson |
R |
25 |
6 |
6 |
4.16 |
27 |
25 |
127.7 |
119 |
59 |
17 |
46 |
117 |
| Andrew Morris |
R |
24 |
6 |
6 |
4.14 |
22 |
20 |
100.0 |
102 |
46 |
12 |
28 |
80 |
| Mick Abel |
R |
24 |
7 |
8 |
4.46 |
25 |
24 |
117.0 |
113 |
58 |
14 |
53 |
107 |
| Connor Prielipp |
L |
25 |
5 |
5 |
4.00 |
25 |
24 |
83.0 |
81 |
38 |
9 |
30 |
77 |
| Pierson Ohl |
R |
26 |
6 |
5 |
4.10 |
30 |
11 |
96.7 |
102 |
44 |
14 |
17 |
78 |
| David Festa |
R |
26 |
5 |
6 |
4.22 |
21 |
19 |
91.7 |
86 |
43 |
12 |
32 |
93 |
| Kendry Rojas |
L |
23 |
4 |
4 |
4.36 |
22 |
21 |
84.7 |
84 |
41 |
10 |
34 |
76 |
| Darren McCaughan |
R |
30 |
5 |
6 |
4.71 |
25 |
16 |
105.0 |
112 |
55 |
15 |
31 |
80 |
| John Klein |
R |
24 |
6 |
8 |
4.67 |
26 |
15 |
94.3 |
95 |
49 |
13 |
34 |
79 |
| Travis Adams |
R |
26 |
6 |
6 |
4.55 |
32 |
12 |
97.0 |
101 |
49 |
12 |
33 |
75 |
| Cole Sands |
R |
28 |
5 |
4 |
3.91 |
57 |
4 |
69.0 |
62 |
30 |
7 |
21 |
68 |
| Thomas Hatch |
R |
31 |
5 |
7 |
4.70 |
25 |
16 |
103.3 |
114 |
54 |
13 |
36 |
72 |
| Christian MacLeod |
L |
26 |
4 |
4 |
4.73 |
24 |
17 |
80.0 |
82 |
42 |
11 |
39 |
67 |
| Ricky Castro |
R |
26 |
3 |
4 |
4.76 |
24 |
13 |
81.3 |
87 |
43 |
12 |
26 |
60 |
| Trent Baker |
R |
27 |
4 |
6 |
4.81 |
27 |
15 |
88.0 |
94 |
47 |
13 |
32 |
66 |
| Marco Raya |
R |
23 |
4 |
5 |
4.88 |
28 |
20 |
94.0 |
94 |
51 |
12 |
45 |
78 |
| Kody Funderburk |
L |
29 |
4 |
4 |
4.04 |
48 |
2 |
64.7 |
60 |
29 |
6 |
27 |
61 |
| Chase Chaney |
R |
26 |
5 |
7 |
4.99 |
24 |
19 |
106.3 |
122 |
59 |
15 |
31 |
60 |
| C.J. Culpepper |
R |
24 |
3 |
3 |
4.83 |
23 |
23 |
72.7 |
73 |
39 |
8 |
34 |
56 |
| Ryan Gallagher |
R |
23 |
5 |
8 |
5.11 |
21 |
21 |
104.0 |
111 |
59 |
18 |
33 |
83 |
| Justin Topa |
R |
35 |
3 |
2 |
4.04 |
47 |
1 |
49.0 |
50 |
22 |
4 |
15 |
39 |
| Eric Orze |
R |
28 |
3 |
3 |
4.04 |
50 |
0 |
62.3 |
56 |
28 |
7 |
28 |
63 |
| Sam Armstrong |
R |
25 |
5 |
7 |
5.23 |
24 |
21 |
103.3 |
115 |
60 |
15 |
35 |
66 |
| Mike Paredes |
R |
25 |
4 |
5 |
4.59 |
34 |
3 |
86.3 |
92 |
44 |
12 |
27 |
61 |
| Cory Lewis |
R |
25 |
4 |
6 |
5.06 |
22 |
13 |
74.7 |
75 |
42 |
11 |
44 |
66 |
| Alejandro Hidalgo |
R |
23 |
3 |
5 |
5.40 |
23 |
23 |
81.7 |
84 |
49 |
13 |
42 |
71 |
| Adam Plutko |
R |
34 |
4 |
7 |
5.35 |
16 |
15 |
75.7 |
88 |
45 |
13 |
23 |
44 |
| Grant Hartwig |
R |
28 |
3 |
4 |
4.32 |
34 |
0 |
41.7 |
39 |
20 |
4 |
18 |
39 |
| Brady Feigl |
L |
35 |
2 |
4 |
4.75 |
20 |
3 |
36.0 |
38 |
19 |
5 |
16 |
34 |
| Noah Davis |
R |
29 |
3 |
4 |
5.18 |
31 |
9 |
73.0 |
74 |
42 |
10 |
31 |
66 |
| Jarret Whorff |
R |
27 |
4 |
6 |
4.61 |
36 |
1 |
66.3 |
68 |
34 |
9 |
25 |
55 |
| Angel Macuare |
R |
26 |
2 |
2 |
5.06 |
22 |
5 |
48.0 |
53 |
27 |
7 |
17 |
33 |
| Anthony Misiewicz |
L |
31 |
2 |
2 |
4.46 |
37 |
0 |
38.3 |
39 |
19 |
5 |
15 |
33 |
| Connor Gillispie |
R |
28 |
3 |
5 |
5.47 |
20 |
13 |
79.0 |
83 |
48 |
13 |
33 |
55 |
| Michael Tonkin |
R |
36 |
3 |
2 |
4.47 |
37 |
0 |
52.3 |
51 |
26 |
7 |
18 |
47 |
| Jaylen Nowlin |
L |
25 |
3 |
5 |
5.29 |
30 |
8 |
68.0 |
69 |
40 |
10 |
38 |
58 |
| Erasmo Ramirez |
R |
36 |
2 |
3 |
4.86 |
34 |
1 |
50.0 |
56 |
27 |
8 |
15 |
36 |
| Brooks Kriske |
R |
32 |
2 |
2 |
4.74 |
36 |
0 |
43.7 |
40 |
23 |
6 |
23 |
49 |
| Génesis Cabrera |
L |
29 |
1 |
2 |
4.67 |
50 |
0 |
52.0 |
50 |
27 |
8 |
24 |
47 |
| Jacob Bosiokovic |
R |
32 |
2 |
3 |
4.81 |
28 |
0 |
33.7 |
32 |
18 |
4 |
17 |
31 |
| Gabriel Yanez |
L |
26 |
3 |
4 |
4.75 |
36 |
0 |
53.0 |
59 |
28 |
8 |
18 |
39 |
| Logan Whitaker |
R |
26 |
2 |
2 |
4.76 |
23 |
0 |
34.0 |
37 |
18 |
5 |
12 |
24 |
| Kade Bragg |
L |
24 |
4 |
5 |
4.84 |
40 |
0 |
57.7 |
54 |
31 |
8 |
28 |
56 |
| Alex Speas |
R |
28 |
2 |
3 |
4.96 |
30 |
0 |
32.7 |
30 |
18 |
4 |
22 |
31 |
| Sam Ryan |
R |
27 |
3 |
5 |
5.05 |
39 |
2 |
62.3 |
66 |
35 |
8 |
30 |
47 |
| Darren Bowen |
R |
25 |
3 |
6 |
5.68 |
22 |
14 |
69.7 |
78 |
44 |
11 |
30 |
41 |
| Hunter Hoopes |
R |
26 |
4 |
6 |
5.04 |
40 |
0 |
44.7 |
41 |
25 |
6 |
20 |
43 |
| Joel Cesar |
R |
30 |
2 |
4 |
5.28 |
22 |
0 |
29.0 |
31 |
17 |
4 |
13 |
23 |
| Kyle Bischoff |
R |
26 |
2 |
4 |
5.27 |
33 |
0 |
41.0 |
40 |
24 |
6 |
24 |
36 |
| Jacob Wosinski |
R |
27 |
3 |
6 |
5.51 |
36 |
1 |
50.7 |
56 |
31 |
8 |
22 |
35 |
Pitchers – Advanced
| Player |
IP |
K/9 |
BB/9 |
HR/9 |
BB% |
K% |
BABIP |
ERA+ |
3ERA+ |
FIP |
ERA- |
WAR |
| Joe Ryan |
155.3 |
9.8 |
2.1 |
1.3 |
5.7% |
26.9% |
.279 |
114 |
111 |
3.78 |
88 |
2.8 |
| Pablo López |
141.3 |
9.0 |
2.4 |
1.0 |
6.3% |
24.1% |
.296 |
117 |
113 |
3.55 |
85 |
2.6 |
| Bailey Ober |
147.0 |
8.1 |
2.1 |
1.4 |
5.6% |
21.7% |
.285 |
102 |
101 |
4.20 |
98 |
2.0 |
| Taj Bradley |
147.7 |
8.3 |
3.1 |
1.2 |
8.1% |
21.7% |
.286 |
101 |
103 |
4.11 |
99 |
1.9 |
| Zebby Matthews |
112.3 |
9.5 |
2.2 |
1.3 |
5.7% |
25.1% |
.309 |
110 |
109 |
3.69 |
91 |
1.8 |
| Simeon Woods Richardson |
127.7 |
8.2 |
3.2 |
1.2 |
8.5% |
21.5% |
.284 |
104 |
105 |
4.21 |
96 |
1.8 |
| Andrew Morris |
100.0 |
7.2 |
2.5 |
1.1 |
6.6% |
18.7% |
.297 |
104 |
108 |
4.05 |
96 |
1.5 |
| Mick Abel |
117.0 |
8.2 |
4.1 |
1.1 |
10.3% |
20.8% |
.296 |
97 |
101 |
4.38 |
103 |
1.3 |
| Connor Prielipp |
83.0 |
8.3 |
3.3 |
1.0 |
8.4% |
21.6% |
.303 |
105 |
108 |
4.02 |
96 |
1.2 |
| Pierson Ohl |
96.7 |
7.3 |
1.6 |
1.3 |
4.2% |
19.3% |
.300 |
105 |
108 |
4.02 |
95 |
1.2 |
| David Festa |
91.7 |
9.1 |
3.1 |
1.2 |
8.2% |
23.8% |
.296 |
102 |
103 |
4.01 |
98 |
1.2 |
| Kendry Rojas |
84.7 |
8.1 |
3.6 |
1.1 |
9.2% |
20.5% |
.301 |
99 |
104 |
4.29 |
101 |
1.0 |
| Darren McCaughan |
105.0 |
6.9 |
2.7 |
1.3 |
6.9% |
17.7% |
.299 |
91 |
91 |
4.58 |
110 |
0.9 |
| John Klein |
94.3 |
7.5 |
3.2 |
1.2 |
8.3% |
19.3% |
.294 |
92 |
97 |
4.68 |
109 |
0.8 |
| Travis Adams |
97.0 |
7.0 |
3.1 |
1.1 |
7.8% |
17.7% |
.299 |
95 |
97 |
4.34 |
105 |
0.8 |
| Cole Sands |
69.0 |
8.9 |
2.7 |
0.9 |
7.3% |
23.5% |
.291 |
110 |
110 |
3.60 |
91 |
0.8 |
| Thomas Hatch |
103.3 |
6.3 |
3.1 |
1.1 |
7.9% |
15.9% |
.305 |
92 |
90 |
4.62 |
109 |
0.8 |
| Christian MacLeod |
80.0 |
7.5 |
4.4 |
1.2 |
10.8% |
18.5% |
.298 |
91 |
95 |
4.89 |
110 |
0.7 |
| Ricky Castro |
81.3 |
6.6 |
2.9 |
1.3 |
7.3% |
16.8% |
.296 |
91 |
94 |
4.64 |
110 |
0.6 |
| Trent Baker |
88.0 |
6.8 |
3.3 |
1.3 |
8.2% |
17.0% |
.298 |
90 |
92 |
4.81 |
111 |
0.6 |
| Marco Raya |
94.0 |
7.5 |
4.3 |
1.1 |
10.6% |
18.4% |
.294 |
88 |
94 |
4.82 |
114 |
0.6 |
| Kody Funderburk |
64.7 |
8.5 |
3.8 |
0.8 |
9.6% |
21.7% |
.295 |
107 |
106 |
4.01 |
93 |
0.6 |
| Chase Chaney |
106.3 |
5.1 |
2.6 |
1.3 |
6.6% |
12.8% |
.300 |
86 |
90 |
4.91 |
116 |
0.6 |
| C.J. Culpepper |
72.7 |
6.9 |
4.2 |
1.0 |
10.6% |
17.4% |
.293 |
89 |
95 |
4.70 |
112 |
0.6 |
| Ryan Gallagher |
104.0 |
7.2 |
2.9 |
1.6 |
7.2% |
18.2% |
.296 |
84 |
90 |
4.86 |
119 |
0.5 |
| Justin Topa |
49.0 |
7.2 |
2.8 |
0.7 |
7.2% |
18.7% |
.307 |
107 |
99 |
3.80 |
94 |
0.4 |
| Eric Orze |
62.3 |
9.1 |
4.0 |
1.0 |
10.4% |
23.4% |
.290 |
107 |
109 |
4.09 |
94 |
0.4 |
| Sam Armstrong |
103.3 |
5.8 |
3.0 |
1.3 |
7.7% |
14.5% |
.298 |
82 |
87 |
5.11 |
122 |
0.4 |
| Mike Paredes |
86.3 |
6.4 |
2.8 |
1.3 |
7.2% |
16.2% |
.295 |
94 |
98 |
4.60 |
107 |
0.4 |
| Cory Lewis |
74.7 |
8.0 |
5.3 |
1.3 |
12.8% |
19.2% |
.295 |
85 |
91 |
5.12 |
118 |
0.3 |
| Alejandro Hidalgo |
81.7 |
7.8 |
4.6 |
1.4 |
11.2% |
19.0% |
.297 |
80 |
88 |
5.18 |
125 |
0.2 |
| Adam Plutko |
75.7 |
5.2 |
2.7 |
1.5 |
6.9% |
13.2% |
.298 |
80 |
76 |
5.23 |
124 |
0.1 |
| Grant Hartwig |
41.7 |
8.4 |
3.9 |
0.9 |
9.9% |
21.5% |
.297 |
100 |
100 |
4.12 |
100 |
0.1 |
| Brady Feigl |
36.0 |
8.5 |
4.0 |
1.3 |
9.9% |
21.1% |
.317 |
91 |
83 |
4.58 |
110 |
0.1 |
| Noah Davis |
73.0 |
8.1 |
3.8 |
1.2 |
9.6% |
20.4% |
.302 |
83 |
84 |
4.82 |
120 |
0.1 |
| Jarret Whorff |
66.3 |
7.5 |
3.4 |
1.2 |
8.6% |
18.9% |
.298 |
93 |
96 |
4.58 |
108 |
0.1 |
| Angel Macuare |
48.0 |
6.2 |
3.2 |
1.3 |
8.0% |
15.6% |
.301 |
85 |
89 |
4.93 |
118 |
0.1 |
| Anthony Misiewicz |
38.3 |
7.7 |
3.5 |
1.2 |
8.9% |
19.5% |
.301 |
97 |
94 |
4.39 |
104 |
0.1 |
| Connor Gillispie |
79.0 |
6.3 |
3.8 |
1.5 |
9.5% |
15.8% |
.285 |
79 |
80 |
5.39 |
127 |
0.0 |
| Michael Tonkin |
52.3 |
8.1 |
3.1 |
1.2 |
8.0% |
21.0% |
.293 |
96 |
88 |
4.48 |
104 |
0.0 |
| Jaylen Nowlin |
68.0 |
7.7 |
5.0 |
1.3 |
11.9% |
18.2% |
.295 |
81 |
86 |
5.35 |
123 |
0.0 |
| Erasmo Ramirez |
50.0 |
6.5 |
2.7 |
1.4 |
6.8% |
16.4% |
.304 |
89 |
83 |
4.82 |
112 |
0.0 |
| Brooks Kriske |
43.7 |
10.1 |
4.7 |
1.2 |
11.7% |
25.0% |
.301 |
91 |
89 |
4.42 |
110 |
0.0 |
| Génesis Cabrera |
52.0 |
8.1 |
4.2 |
1.4 |
10.5% |
20.6% |
.286 |
92 |
92 |
4.91 |
109 |
0.0 |
| Jacob Bosiokovic |
33.7 |
8.3 |
4.5 |
1.1 |
11.2% |
20.4% |
.292 |
90 |
87 |
4.65 |
112 |
-0.1 |
| Gabriel Yanez |
53.0 |
6.6 |
3.1 |
1.4 |
7.7% |
16.7% |
.305 |
91 |
94 |
4.79 |
110 |
-0.1 |
| Logan Whitaker |
34.0 |
6.4 |
3.2 |
1.3 |
8.0% |
16.0% |
.299 |
90 |
93 |
4.81 |
111 |
-0.1 |
| Kade Bragg |
57.7 |
8.7 |
4.4 |
1.2 |
11.0% |
22.0% |
.289 |
89 |
95 |
4.74 |
112 |
-0.1 |
| Alex Speas |
32.7 |
8.5 |
6.1 |
1.1 |
14.3% |
20.1% |
.286 |
87 |
89 |
5.15 |
115 |
-0.1 |
| Sam Ryan |
62.3 |
6.8 |
4.3 |
1.2 |
10.6% |
16.5% |
.301 |
85 |
88 |
4.91 |
117 |
-0.1 |
| Darren Bowen |
69.7 |
5.3 |
3.9 |
1.4 |
9.5% |
13.0% |
.293 |
76 |
80 |
5.59 |
132 |
-0.2 |
| Hunter Hoopes |
44.7 |
8.7 |
4.0 |
1.2 |
10.2% |
21.9% |
.285 |
85 |
90 |
4.86 |
118 |
-0.2 |
| Joel Cesar |
29.0 |
7.1 |
4.0 |
1.2 |
9.8% |
17.3% |
.303 |
82 |
81 |
4.92 |
122 |
-0.2 |
| Kyle Bischoff |
41.0 |
7.9 |
5.3 |
1.3 |
12.6% |
18.8% |
.288 |
82 |
85 |
5.43 |
122 |
-0.3 |
| Jacob Wosinski |
50.7 |
6.2 |
3.9 |
1.4 |
9.5% |
15.2% |
.298 |
78 |
81 |
5.37 |
128 |
-0.4 |
Pitchers – Top Near-Age Comps
Pitchers – Splits and Percentiles
| Player |
BA vs. L |
OBP vs. L |
SLG vs. L |
BA vs. R |
OBP vs. R |
SLG vs. R |
80th WAR |
20th WAR |
80th ERA |
20th ERA |
| Joe Ryan |
.234 |
.289 |
.409 |
.224 |
.276 |
.388 |
3.6 |
1.5 |
3.25 |
4.63 |
| Pablo López |
.258 |
.313 |
.409 |
.221 |
.273 |
.363 |
3.4 |
1.6 |
3.20 |
4.40 |
| Bailey Ober |
.257 |
.303 |
.435 |
.245 |
.291 |
.430 |
2.7 |
1.1 |
3.74 |
4.80 |
| Taj Bradley |
.257 |
.329 |
.436 |
.228 |
.285 |
.369 |
3.0 |
0.9 |
3.69 |
4.85 |
| Zebby Matthews |
.253 |
.305 |
.444 |
.241 |
.277 |
.379 |
2.7 |
1.1 |
3.28 |
4.58 |
| Simeon Woods Richardson |
.239 |
.307 |
.376 |
.245 |
.311 |
.426 |
2.6 |
0.8 |
3.65 |
4.92 |
| Andrew Morris |
.265 |
.319 |
.439 |
.249 |
.298 |
.383 |
2.1 |
0.7 |
3.56 |
4.89 |
| Mick Abel |
.243 |
.333 |
.392 |
.250 |
.325 |
.403 |
2.0 |
0.5 |
3.98 |
5.05 |
| Connor Prielipp |
.265 |
.339 |
.373 |
.238 |
.308 |
.396 |
1.8 |
0.6 |
3.62 |
4.76 |
| Pierson Ohl |
.266 |
.306 |
.444 |
.260 |
.287 |
.425 |
1.9 |
0.6 |
3.47 |
4.72 |
| David Festa |
.241 |
.312 |
.388 |
.243 |
.307 |
.416 |
2.0 |
0.6 |
3.56 |
4.83 |
| Kendry Rojas |
.237 |
.308 |
.366 |
.254 |
.331 |
.414 |
1.7 |
0.4 |
3.77 |
5.01 |
| Darren McCaughan |
.256 |
.323 |
.427 |
.277 |
.329 |
.450 |
1.5 |
0.2 |
4.18 |
5.33 |
| John Klein |
.259 |
.350 |
.431 |
.253 |
.315 |
.414 |
1.3 |
0.2 |
4.23 |
5.27 |
| Travis Adams |
.261 |
.332 |
.392 |
.261 |
.313 |
.441 |
1.4 |
0.2 |
4.02 |
5.16 |
| Cole Sands |
.242 |
.312 |
.403 |
.229 |
.288 |
.336 |
1.3 |
0.2 |
3.24 |
4.86 |
| Thomas Hatch |
.284 |
.350 |
.463 |
.261 |
.324 |
.399 |
1.3 |
0.2 |
4.23 |
5.29 |
| Christian MacLeod |
.250 |
.336 |
.385 |
.261 |
.346 |
.446 |
1.1 |
0.1 |
4.22 |
5.36 |
| Ricky Castro |
.273 |
.331 |
.474 |
.260 |
.312 |
.416 |
1.0 |
0.0 |
4.28 |
5.41 |
| Trent Baker |
.253 |
.318 |
.429 |
.278 |
.344 |
.455 |
1.1 |
0.0 |
4.29 |
5.41 |
| Marco Raya |
.273 |
.364 |
.448 |
.236 |
.325 |
.382 |
1.2 |
-0.1 |
4.38 |
5.49 |
| Kody Funderburk |
.232 |
.319 |
.317 |
.244 |
.330 |
.393 |
1.1 |
0.0 |
3.31 |
4.84 |
| Chase Chaney |
.292 |
.351 |
.449 |
.272 |
.321 |
.460 |
1.1 |
0.0 |
4.53 |
5.54 |
| C.J. Culpepper |
.261 |
.350 |
.387 |
.247 |
.335 |
.418 |
0.9 |
0.1 |
4.41 |
5.41 |
| Ryan Gallagher |
.277 |
.338 |
.527 |
.255 |
.307 |
.403 |
1.1 |
-0.2 |
4.53 |
5.72 |
| Justin Topa |
.267 |
.337 |
.411 |
.250 |
.307 |
.356 |
0.8 |
0.0 |
3.30 |
5.02 |
| Eric Orze |
.209 |
.313 |
.327 |
.256 |
.326 |
.419 |
0.9 |
-0.1 |
3.38 |
4.92 |
| Sam Armstrong |
.288 |
.354 |
.481 |
.260 |
.330 |
.413 |
0.9 |
-0.2 |
4.72 |
5.72 |
| Mike Paredes |
.282 |
.343 |
.481 |
.254 |
.306 |
.402 |
1.1 |
-0.1 |
3.91 |
5.13 |
| Cory Lewis |
.250 |
.347 |
.410 |
.258 |
.354 |
.457 |
0.9 |
-0.1 |
4.51 |
5.65 |
| Alejandro Hidalgo |
.261 |
.363 |
.425 |
.253 |
.330 |
.454 |
0.7 |
-0.5 |
4.78 |
6.11 |
| Adam Plutko |
.303 |
.354 |
.503 |
.268 |
.318 |
.463 |
0.6 |
-0.4 |
4.76 |
6.04 |
| Grant Hartwig |
.250 |
.365 |
.375 |
.236 |
.303 |
.382 |
0.4 |
-0.2 |
3.71 |
5.24 |
| Brady Feigl |
.245 |
.322 |
.358 |
.269 |
.349 |
.473 |
0.4 |
-0.2 |
4.00 |
5.78 |
| Noah Davis |
.261 |
.363 |
.478 |
.250 |
.330 |
.378 |
0.6 |
-0.4 |
4.56 |
5.88 |
| Jarret Whorff |
.254 |
.336 |
.424 |
.260 |
.323 |
.418 |
0.6 |
-0.4 |
4.01 |
5.33 |
| Angel Macuare |
.279 |
.344 |
.477 |
.266 |
.331 |
.422 |
0.5 |
-0.2 |
4.41 |
5.67 |
| Anthony Misiewicz |
.232 |
.295 |
.375 |
.274 |
.346 |
.453 |
0.4 |
-0.3 |
3.69 |
5.37 |
| Connor Gillispie |
.283 |
.364 |
.476 |
.251 |
.328 |
.443 |
0.5 |
-0.5 |
4.96 |
6.10 |
| Michael Tonkin |
.267 |
.340 |
.488 |
.243 |
.323 |
.365 |
0.5 |
-0.5 |
3.59 |
5.57 |
| Jaylen Nowlin |
.270 |
.365 |
.382 |
.251 |
.360 |
.453 |
0.5 |
-0.5 |
4.66 |
5.99 |
| Erasmo Ramirez |
.284 |
.343 |
.474 |
.271 |
.319 |
.458 |
0.3 |
-0.4 |
4.20 |
5.84 |
| Brooks Kriske |
.247 |
.351 |
.407 |
.230 |
.320 |
.402 |
0.3 |
-0.6 |
3.93 |
6.04 |
| Génesis Cabrera |
.250 |
.338 |
.391 |
.250 |
.335 |
.449 |
0.3 |
-0.5 |
4.04 |
5.49 |
| Jacob Bosiokovic |
.274 |
.357 |
.435 |
.217 |
.329 |
.377 |
0.2 |
-0.4 |
4.03 |
5.70 |
| Gabriel Yanez |
.261 |
.316 |
.391 |
.277 |
.337 |
.473 |
0.3 |
-0.4 |
4.14 |
5.47 |
| Logan Whitaker |
.277 |
.347 |
.508 |
.257 |
.309 |
.392 |
0.1 |
-0.4 |
4.22 |
5.43 |
| Kade Bragg |
.243 |
.341 |
.371 |
.242 |
.335 |
.425 |
0.4 |
-0.6 |
4.12 |
5.69 |
| Alex Speas |
.255 |
.388 |
.455 |
.232 |
.349 |
.362 |
0.1 |
-0.5 |
4.34 |
6.02 |
| Sam Ryan |
.270 |
.363 |
.444 |
.254 |
.326 |
.397 |
0.3 |
-0.6 |
4.48 |
5.71 |
| Darren Bowen |
.286 |
.360 |
.474 |
.267 |
.351 |
.453 |
0.2 |
-0.5 |
5.19 |
6.23 |
| Hunter Hoopes |
.228 |
.337 |
.380 |
.250 |
.352 |
.424 |
0.1 |
-0.5 |
4.38 |
5.79 |
| Joel Cesar |
.259 |
.365 |
.407 |
.266 |
.324 |
.453 |
0.0 |
-0.5 |
4.53 |
6.27 |
| Kyle Bischoff |
.268 |
.395 |
.437 |
.239 |
.340 |
.420 |
0.0 |
-0.6 |
4.74 |
6.13 |
| Jacob Wosinski |
.290 |
.374 |
.505 |
.259 |
.333 |
.420 |
-0.1 |
-0.8 |
4.96 |
6.31 |
Players are listed with their most recent teams wherever possible. This includes players who are unsigned or have retired, players who will miss 2026 due to injury, and players who were released in 2025. So yes, if you see Joe Schmoe, who quit baseball back in August to form a Ambient Math-Rock Trip-Hop Yacht Metal band that only performs in abandoned malls, he’s still listed here intentionally. ZiPS is assuming a league with an ERA of 4.16.
Hitters are ranked by zWAR, which is to say, WAR values as calculated by me, Dan Szymborski, whose surname is spelled with a z. WAR values might differ slightly from those that appear in the full release of ZiPS. Finally, I will advise anyone against — and might karate chop anyone guilty of — merely adding up WAR totals on a depth chart to produce projected team WAR. It is important to remember that ZiPS is agnostic about playing time, and has no information about, for example, how quickly a team will call up a prospect or what veteran has fallen into disfavor.
As always, incorrect projections are either caused by misinformation, a non-pragmatic reality, or by the skillful sabotage of our friend and former editor. You can, however, still get mad at me on Twitter or on Bluesky. This last is, however, not an actual requirement.