Historically Speaking, Game 4 Was Absolutely Bananas

Watching Game 4 of the World Series, you may not have felt as exhausted as Brett Phillips did when the plane celebration ran out of fuel, but you probably came pretty close. Baseball is at its best when it’s full of unresolved tension, and until that moment of catharsis when the Rays highlight-reel celebration ensued, there were a good six or seven innings of nonstop pressure Saturday night.
Looking at the win probability graph for Game 4 illustrates the rollercoaster everyone rode:
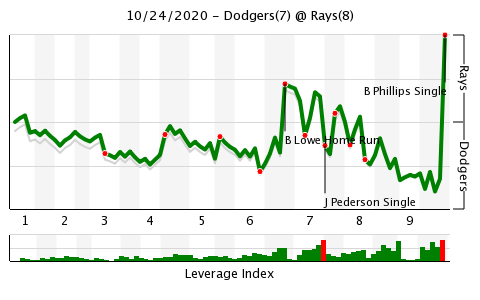
The sheer number of peaks and dips is scary. The outcome was mostly in doubt for the final two-thirds of the game and the arrow of fate couldn’t decide where it was going. For a much less suspenseful game, let’s look at an earlier Dodgers tilt this postseason, the Game 3 NLCS laugher against the Braves that started with an 11-run first inning:
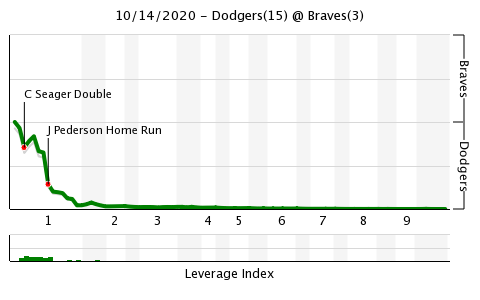
Given how little suspense there was, that might as well have been a graph of fan interest. While the Dodgers were rightly pleased to bank such an easy win, watching eight-and-a-half innings of baseball that’s all but certainly decided isn’t the most compelling viewer experience. I was still watching the game, but at that point, I was paying more attention to the Paladin I was leveling in World of WarCraft!
So how does Game 4 fit into baseball history? To answer this question, I took every win probability change for all 125,000 plays in postseason history in postseason history and tracked them on a game-by-game basis. I then crunched the numbers to determine which games had the most change in expected outcome per event and thus to see how all 1,668 games ranked in terms of volatility. If you thought you were watching a special game, you were right; the uncertainty in Game 4 was definitely meaningful on a historic level:
| Game | Total Probability Change | Plays | Probability Delta per Play |
|---|---|---|---|
| 2020 World Series Game 4, Dodgers at Rays | 6.13 | 86 | 7.12% |
| 1995 NLDS Game 1, Braves at Rockies | 5.81 | 82 | 7.09% |
| 1995 ALDS Game 1, Red Sox at Indians | 7.50 | 107 | 7.01% |
| 1980 ALCS Game 3, Royals at Yankees | 5.96 | 90 | 6.62% |
| 2011 World Series Game 6, Rangers at Cardinals | 7.17 | 109 | 6.58% |
| 1995 ALDS Game 2, Mariners at Yankees | 7.77 | 122 | 6.37% |
| 1912 World Series Game 2, Giants at Red Sox | 5.92 | 93 | 6.37% |
| 1986 ALCS Game 5, Red Sox at Angels | 5.86 | 94 | 6.23% |
| 2000 World Series Game 1, Mets at Yankees | 6.25 | 101 | 6.19% |
| 1924 World Series Game 7, Giants at Senators | 6.11 | 99 | 6.17% |
| 2017 World Series Game 5, Dodgers at Astros | 6.22 | 101 | 6.16% |
| 2004 ALCS Game 5, Yankees at Red Sox | 7.75 | 126 | 6.15% |
| 1995 ALDS Game 5, Yankees at Mariners | 5.94 | 97 | 6.12% |
| 2020 ALWC Game 2, Yankees at Indians | 5.68 | 93 | 6.11% |
| 1910 World Series Game 4, Athletics at Cubs | 4.88 | 80 | 6.10% |
| 1972 ALCS Game 1, Tigers at Athletics | 5.17 | 85 | 6.08% |
| 2009 NLDS Game 4, Phillies at Rockies | 5.22 | 86 | 6.07% |
| 1980 World Series Game 5, Phillies at Royals | 4.67 | 78 | 5.99% |
| 2001 World Series Game 4, Diamondbacks at Yankees | 4.61 | 77 | 5.99% |
| 1999 NLCS Game 5, Braves at Mets | 7.50 | 126 | 5.95% |
 Dan Szymborski
 Jay Jaffe