Author Archive: Ben Clemens

May-Be This Time: What if the Season Started May 1?

Think back to the first weeks of the season. Those few weeks of time are disproportionately important, because they shape our understanding of the baseball season in a way that two random weeks normally wouldn’t. It’s taken quite a while, for example, for everyone to realize that Christian Yelich is excellent but probably not the second coming of Babe Ruth, or that Paul DeJong is a good shortstop who isn’t one of the best five players in baseball. Marco Gonzales was a no-strikeout pitching phenom, compiling a 3.1 FIP (2.8 ERA) and 1.3 WAR. He’s been below replacement level since, but you wouldn’t know that if you didn’t take the time to look. Yes, the first few weeks of the season exert a powerful hold on our minds.

What if they didn’t, though? What if, for some crazy reason, the first month-plus of baseball didn’t happen, and the season started on May 1? The narratives and the takes would be extremely different. We don’t see them now, because a month of March and April stats camouflage the full-season lines, but here’s a glimpse of what could have been. Read the rest of this entry »


Pitchers Plan, and Mike Trout Laughs

Imagine being a pitcher who has to face the Angels this year. It’s not hard to figure out which batter you most need to prepare for. When the Angels played the Cubs last night, Albert Pujols batted third, which is a lot less imposing in 2019 than it was in 2008. Shohei Ohtani had the night off, which meant that Tommy La Stella was the best non-Trout bat in the lineup. He’s having a good year, as Jay Jaffe noted, but unfortunately for him, he’s still Tommy La Stella. Cesar Puello batted fifth, and hey, good for him. Still, though — the scouting report was probably just Mike Trout written in various fonts over and over again.

It’s safe to say that every game the Angels play, the opposing team has spent a lot of time trying to work out a way to get Trout out. Los Angeles has a robust 109 wRC+ this year among non-pitchers, which sounds good until you realize that non-Trout Angels have a 100 wRC+. The team is scuffling — two games below .500 in a division where you might need 100 wins to topple the Astros, and potentially a little lucky to be there given their BaseRuns record. The pitching staff is essentially made of duct tape and fervent prayers — Ty Buttrey leads the staff in both fWAR and RA/9 WAR, and their starting rotation looks like a horror story told to kids to keep them from becoming Angels fans.

Amidst this chaos, this unending deluge of mediocrity, Mike Trout is putting together another masterpiece of a season. It’s boring to say, almost — his 180 wRC+ is both the fourth-highest in baseball and the lowest Trout has recorded in the last three years. Being one of the best players in baseball is old hat for him. Still, he’s improving his craft incrementally, slowly shoring up weaknesses and adding to strengths. His unintentional walk rate, a gaudy 19%, is the highest of his career. His strikeout rate, a minuscule 16%, has never been lower. Trout’s 2019 might be the best he’s ever hit, a crazy thing to say about undoubtedly the best player in baseball.

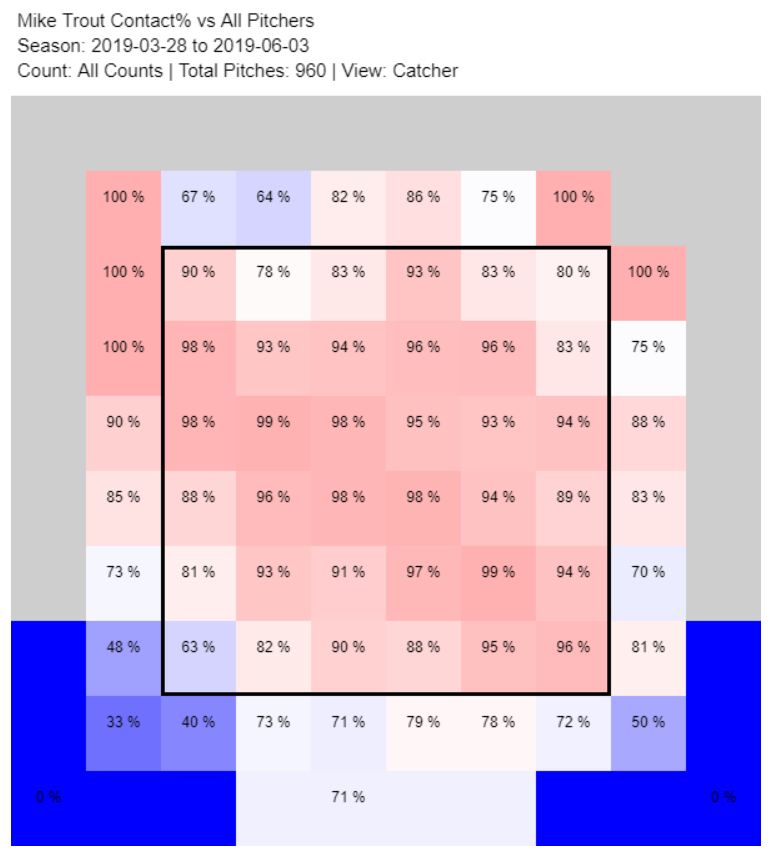
Baseball is largely a game of failure and limitations, which makes talking about Trout’s plate discipline feel somewhat surreal. Consider this — Trout has started making contact with basically everything he swings at in the strike zone. His zone contact rate of 94.9% is sixth in baseball and the highest of his career. That’s strange, because for the most part, guys who make contact with everything are contact hitters who sacrifice power to put the ball in play. David Fletcher and his .137 ISO top the list.

This makes a rough kind of sense — hitting everything you swing at in the strike zone means you are probably putting some tough pitches in play, and cutting down on your swing to make more contact means those swings generally have less behind them. That, at least, is the logic that constrains mortals. Mike Trout started hitting everything in the strike zone, and he’s still slugging .600. That slugging percentage might be selling Trout short — he has the highest xSLG (a Baseball Savant statistic that predicts slugging percentage from angle and speed of hits) of his career, a gaudy .643.

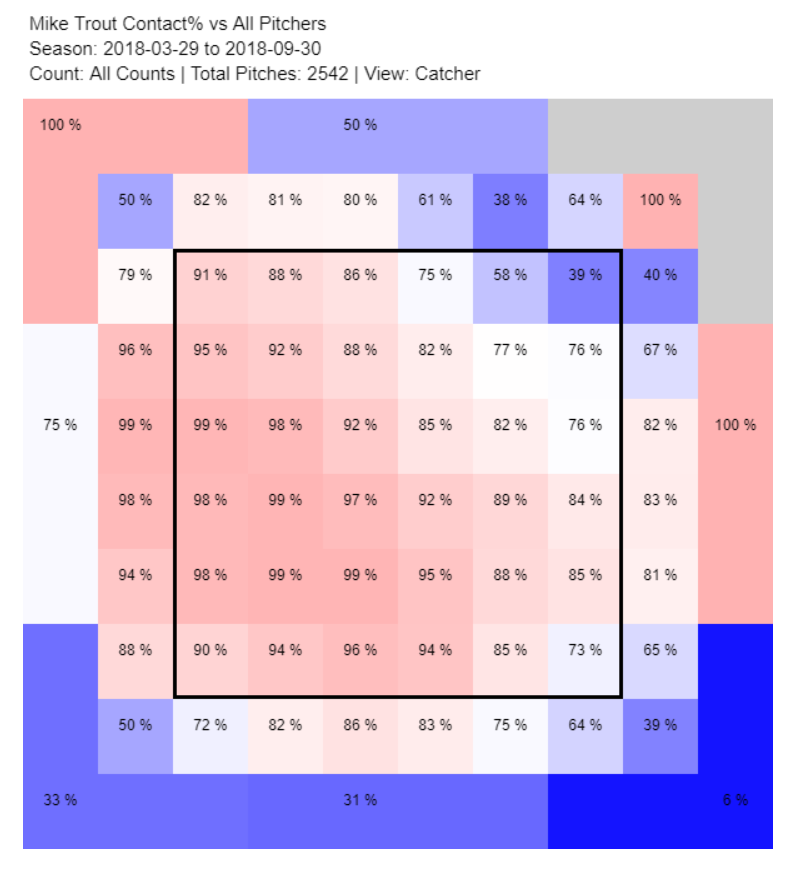
What does making contact with every pitch in the strike zone look like? Well, in 2018, Trout was great, but he was great while being only very good against high and outside pitches. Take a look at the upper righthand corner of this chart, the percentage of swings he made contact on by zone in 2018:

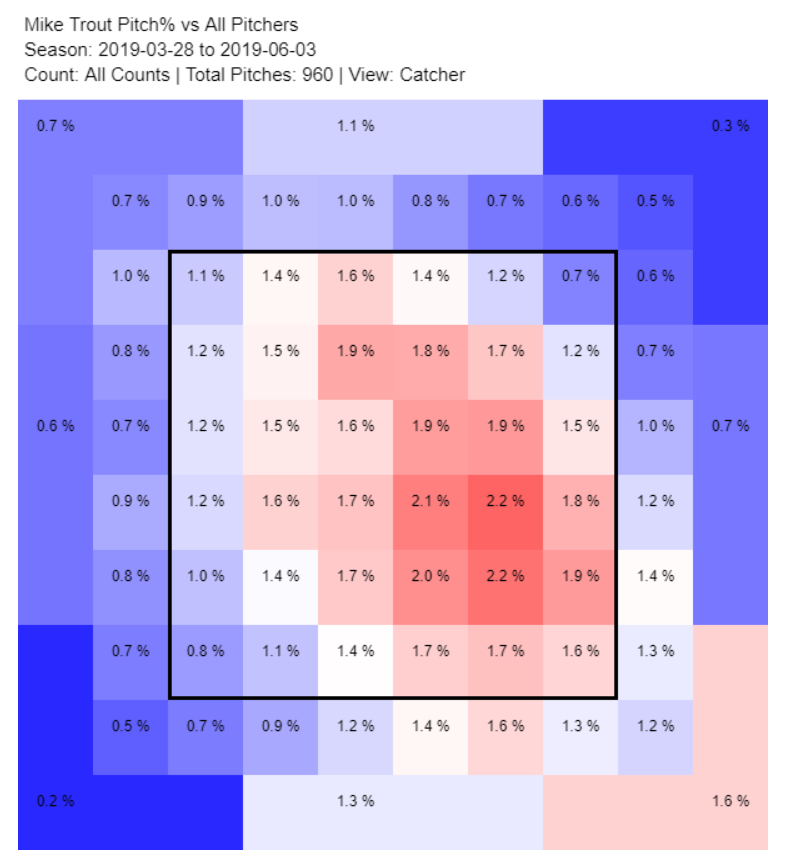
Pitchers know about this marginal weakness, and they do their best to exploit it. The book on Trout is to get him high and away. Take a look at where pitchers are attacking him in 2019:

That’s good pitching right there. Find out where a hitter is most likely to get bad results, and aim for that spot. Maybe their focal point is a little too low, but the general idea of throwing away is certainly easy to see. Major league pitchers are tremendously skilled, and they spend countless hours perfecting their craft. That should work out to their advantage, right? Well, bad news, pitchers — this is Mike Trout we’re talking about here. Look at his contact rate in 2019:

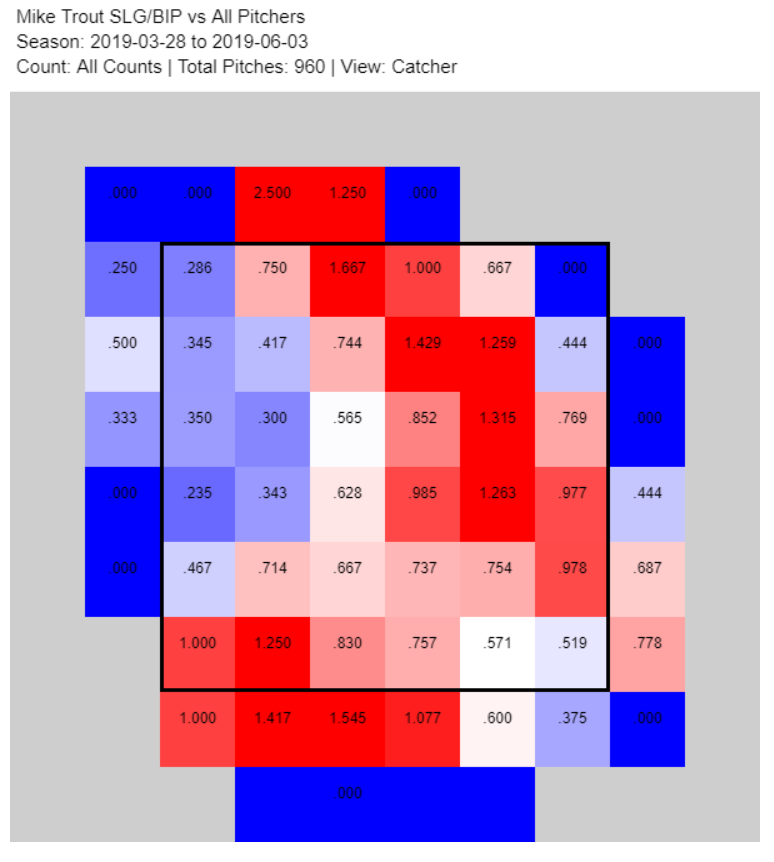
It would be one thing to protect a weak point in your swing with some defensive hacks. Plenty of good hitters punch outside pitches the other way, sacrificing power for contact on pitches that are hard to drive. Again, though, Mike Trout isn’t “plenty of good hitters.” He’s the best hitter in baseball. Trout is punishing outside and high pitches in 2019, doing a tremendous amount of damage when he puts the ball in play:

You’re reading this chart right — Trout is now getting his greatest production on balls in play in the very part of the strike zone where pitchers are attacking him most. That, in a nutshell, is what pitching to Trout is like. You might think you’re attacking a weakness, doing your research to put yourself in an advantageous position. Trout’s better at adapting than you are; he’s better than everyone. He reacts to your changes faster than he can be solved.

Pitch location isn’t the only part of Trout’s plate discipline pitchers have focused on this year. They’ve changed how they attack him on the first pitch of a plate appearance, and Trout is yet again using that to his advantage. For years, the book on Trout was that he was patient on the first pitch to the point of somnolence; he basically never swung at first-pitch breaking balls, for instance. Over the past few years, Trout has turned this trend around, becoming increasingly aggressive on the first pitch — he swung at 19.7% of first pitches in 2017 and 18.3% in 2018, the two highest rates of his career.

To combat this trend, pitchers are going out of the zone on first pitches more than they ever have. Trout is seeing strikes on 47% of first pitches, down from his career average of 55% and below the major league average of 51%. This adjustment was largely out of self-preservation. Trout slugged 1.061 with a .485 batting average when he put the first pitch into play last year. He hit five home runs on first pitches, a career high. Sticking with get-me-over first pitch fastballs was no longer an option.

In classic Trout fashion, though, he’s turned pitchers’ adjustments into another tool in his tool belt. Now that pitchers throw him fewer first-pitch strikes, he’s simply swinging less. He’s down to a 17% swing rate on first pitches this year while still swinging at 27% of pitches in the zone. He’s also missing less — he’s swung and missed at five first pitches this year, a 2% rate that would be his lowest since 2015, the last year of his extreme passivity on first pitches. Between this improved swing discipline and pitchers avoiding the zone like the plague, Trout is falling behind in the count 52.9% of the time this year, a career low and 5.2% below last year’s level.

2019 is arguably Mike Trout’s finest batting season so far. His xwOBA of .473 is the highest it’s ever been and 30 points higher than his wOBA, suggesting that he’s been unlucky this year to put up “only” a 180 wRC+, the third-highest of his career. He has the highest walk rate in baseball and a strikeout rate in the lowest 21% of qualified batters. He’s getting on base at the highest rate in his career despite the lowest BABIP in his career (excluding his brief 2011). The two changes pitchers have made to how they approach him this year sure don’t seem to have worked.

Pitchers will try to make other adjustments. They’ll start challenging him in the strike zone more on the first pitch — maybe with offspeed pitches, something that pitchers mostly haven’t tried yet. They’ll aim inside, where Trout’s power is down this year. They’ll continue to hunt holes in his game, small edges that they can use to blunt Trout’s effectiveness.

But until I see some evidence to the contrary, I don’t think it will matter. Pitchers can adjust all they want, try any gambit they’d like. For the most part, it seems like adjusting to beat Trout only plays into his hands. Someday, Mike Trout will grow old. He’ll slow down, get worse at recognizing pitches, stop instilling terror into opposing pitchers the way he does now. That day still feels infinitely far off, though. For now, he’s three steps ahead, putting up unreal numbers while shrugging off regression. Pitchers can plan all they want. Trout won’t stop laughing his way around the bases any time soon.


Gregory Groundball vs. Marty McFly: Who Allows More Big Innings?

You’ve surely heard the sentiment: that pitcher is boom-or-bust. When he’s dialed in, he’s unhittable, but sometimes he just doesn’t “have it.” It’s a non-falsifiable claim, of course. It’s nearly impossible to say what constitutes having it or not, and harder still to know if it’s predictive. For the most part, your talent level is your talent level. Great pitcher? You’ll have fewer blowup games. Bad pitcher? Random chance is going to give you your fair share of crooked numbers.

This unprovable fact, however, set me onto an interesting train of thought. What if run clustering isn’t a purely random process? What if some pitchers, not through any innate streakiness but merely by virtue of the outcomes they allow, give up runs in interesting patterns? Take a groundball-heavy pitcher, for example. When a run scores against him, it’s almost certainly due to a series of groundball singles and walks. If one run scores, there’s often another runner in scoring position right away. The state of the world upon giving up one run, for this Zack Britton-wannabe pitcher, is such that he’s immediately threatened with more runs.

Contrast that to a different type of pitcher, a Nick Anderson-style strikeouts and dingers fly ball pitcher. When our punch-outs and fly balls pitcher gives up a run, it’s often on a solo shot. When that’s the case, one run is in, but the resulting situation isn’t threatening anymore. The bases are empty, the damage done in a single instant. Wouldn’t it be reasonable to wonder whether the two allow runs in different bunches?

Still, those are a lot of words with no real evidence behind them. Who’s to say which of those pitchers allow more big innings? Who’s to say if they’re even equally good pitchers? The guy who allows a lot of home runs sounds like he might allow a lot of big innings, just by virtue of being someone who allows a lot of home runs. We need to be more precise to say anything with conviction. Read the rest of this entry »


Robert Stephenson’s Second Act

Robert Stephenson looked done. After a rocky 2017 (4.68 ERA, 13.8% walk rate), he pitched poorly enough in 2018 spring training that the Reds sent him down to Triple-A Louisville. A vote of no confidence from the Reds, of all teams, is a bad sign for a pitcher. In 2016, the Reds finished 30th in pitching WAR; in 2017, they finished 29th. As Stephenson toiled in Louisville, Reds pitching wasn’t setting the world on fire — the 2018 team finished 26th in WAR, allowing more home runs than every team in baseball other than the Orioles.

When Stephenson returned to the majors at the tail end of 2018, things looked grim. In four appearances, he compiled a 9.26 ERA with more walks than strikeouts. His control, always a limiting factor, looked like it might be his undoing — even in a serviceable Triple-A season, he’d walked 12.2% of the batters he’d faced. As 2018 came to a close, the Robert Stephenson story seemed nearly written. Stuff-first pitching prospect can’t harness his command and never makes good on his promise? Seen that one before. As 2018 was Stephenson’s last option year, he started 2019 in the majors, but time very much felt short.

To understand why Stephenson’s middling major league career was something more than just a journeyman starter’s struggles, you have to look back to his prospect pedigree. In 2015, Kiley McDaniel rated him as the top Reds prospect. In 2016, Stephenson slipped all the way to second. At each turn, though, he showed every tool imaginable. His fastball touched the upper 90s. His curveball was drool-inducing. His changeup wasn’t quite there yet, but you could dream on it. He scuffled in a September call-up in 2016, but for the most part, he looked the part of a future impact arm.

If that was the whole arc of Stephenson’s career, it would be just another cautionary tale about toolsy high school pitching prospects. Sometimes all the stuff in the world isn’t enough, you could tell yourself. Player evaluation is hard! But fortunately for the narrative, that’s not where the story ends. The Reds had to find a place for Stephenson on their 2019 roster, so they turned to the bullpen. Control-challenged starters, after all, are often just relievers waiting to be discovered. What has Stephenson done with the opportunity? Here are the top five relievers this year when it comes to getting swings and misses.

Best Swinging Strike Rate Relievers
Player SwStr% K% IP
Josh Hader 25.4 51.5 27.0
Robert Stephenson 21.6 34.3 25.0
Ken Giles 20.1 40.5 21.2
Emilio Pagan 19.2 39.1 19.0
Wandy Peralta 19 20.1 22.0

Swinging strike rates this high mostly just look like random numbers, but stop and think for a minute about what this means. A quarter of the pitches Josh Hader throws result in swinging strikes. Not a quarter of the swings — a quarter of the pitches. Stephenson isn’t far behind with his 21.6% rate, and that’s almost as wild. If Stephenson throws five pitches, one is getting a swing and a miss. Hader is a game-breaking curiosity, a mythical bullpen beast who strikes out half the batters he faces and swings playoff series. Robert Stephenson had a 5.47 career ERA coming into this season, and there he is in second place.

Sometimes, relievers are easy to spot. Take a two-pitch pitcher who needs a little velocity boost. Give them an offseason to work on throwing with maximum effort. There you have it, a reliever in a can. So did Stephenson add three ticks to his fastball and start maxing out that wipeout curveball scouts loved so much? Well, yes and no, but mostly no. Stephenson has added a pinch of velocity this year, but he’s not a completely remade pitcher or anything. In 2017 and 2018, his four-seam averaged 93.1 mph in starting appearances. In 2019, he’s dialed it up to 94.2 mph. Maybe he hasn’t gotten a huge velocity boost from relieving, but it’s still something.

When it comes to a secondary pitch, though, Stephenson has made a change. In his 2016 debut, he threw a fastball two thirds of the time, mixing in changeups and curveballs in roughly equal measure. In 2017, he threw a slider for the first time. The pitch was more of a power curve than anything else, thrown with a curveball grip and wrist action closer to a fastball, and it immediately became Stephenson’s best pitch. Batters whiffed at nearly half of the sliders they swung at; not too shabby for a pitch he’d never thrown before.

By 2018, Bob Steve had made the slider his go-to pitch, and analysts noticed. Though he didn’t record many major league innings in 2018, he threw 40% sliders when he did. Of the 99 sliders he threw, 18 drew swinging strikes, a 40% whiff-per-swing rate that beat anything he’d ever done with his curveball. The fastball/slider combination still didn’t produce great results that season, but the bare bones of an impact reliever were there; a decent-velocity fastball, wipeout secondary stuff, a willingness to throw a ton of secondary pitches.

That fastball, however, it’s fair to say wasn’t ready for prime time. By FanGraphs’ linear-weight pitch values, his fastball has been 38 runs below average in his career. It’s hardly better using Pitch Info classifications, at 34 runs below average. These linear-weight pitch values take balls in play, strikes, and balls into account, but the problem with Stephenson’s fastball is pretty straightforward — when batters swing at it, they destroy it. This isn’t a one-year thing, a small sample artifact, or anything benign like that. Every year he’s been in the majors, his results and expected results on contact have been objectively awful.

Bob Steve’s Fastball Results (on contact)
Year wOBA xwOBA League wOBA
2016 0.479 0.434 0.388
2017 0.432 0.466 0.392
2018 0.571 0.462 0.390
2019 0.524 0.434 0.410

As you can see, the fastball has been quite poor, even in 2019. Given how much his fastball has been shelled, though, Stephenson’s 2019 is even more impressive. He has a 3.96 ERA and a 2.56 FIP despite a fastball that essentially turns every batter into Cody Bellinger. How has he pulled off that trick? Well, he stopped throwing fastballs, that’s how. Take a look at the qualified relievers who have thrown the most sliders this year.

Slider-Heavy Relievers
Player Slider %
Matt Wisler 70.5
Chaz Roe 64.7
Pat Neshek 62.2
Shawn Kelley 61.3
Robert Stephenson 60.0

Want to limit the damage done on fastballs and leverage your excellent slider? Sometimes the solution is pleasingly straightforward — throw as few fastballs as possible, and replace them one-for-one with your best pitch. This play only works in relief, as you can’t exactly throw 60% sliders as a starter, but his slider is so good that even when batters know it’s coming, they can’t hit hit.

Stephenson’s slider is gorgeous when he throws it out of the zone. Jung Ho Kang surely has sliders on the brain here, but still bends the knee.

Keston Hiura manages to get the bat on the ball, but only barely, and the result is the same.

These are the kinds of sliders that end at-bats, and Stephenson is adept at hunting strikeouts with the pitch. He’s getting whiffs on 56% of swings against his slider, a frankly mind-boggling number. But as well as the slider plays as an out pitch, that’s not the only thing Stephenson uses it for.

When Stephenson first developed his slider in 2017, he used it in the way most pitchers use sliders. It came out late in counts as a hammer, a pitch that looked like a fastball early before falling off the table late. While he dabbled with it early in counts, it was largely a pitch to be used while ahead. This year, that dalliance with early-count sliders has become a full-blown romance. Stephenson is throwing sliders to open at-bats 62% of the time in 2019. If the count gets to 1-0, he still goes to his slider 43% of the time. 2-0? Still 42% sliders. On 2-1 counts, Stephenson throws 70% sliders. He’s using the pitch in every situation, whether it’s a traditional slider count or not.

This adjustment is a stroke of genius for someone who can’t afford to let batters tee off on his fastball. As a batter facing Stephenson, you desperately want to avoid a two-strike count, because a two-strike count against Stephenson’s slider is a sure way to end up in a Pitching Ninja GIF. Best, then, to swing at an early fastball. It’s the pitch you want to hit, after all. The next step in that game theoretical confrontation is for Stephenson to throw sliders in fastball counts, and either throw enough for called strikes or be deceptive enough that batters can’t just leave the bat on their shoulders.

Amazingly enough for a pitcher who came into 2019 with a 13.6% career walk rate, Stephenson has pretty good slider command. He’s locating 45% of his first-pitch sliders in the zone, enough that hitters can’t wait him out. His overall slider zone rate of 46% is comfortably better than average (43% for the big leagues as a whole). When he does miss the zone, he’s missing close — he already has nine swinging strikes on out-of-zone sliders to start at-bats this year, the most of any reliever and only three behind slider factory Patrick Corbin for most in the majors.

Though he throws the slider in the strike zone less often than his fastball, the slider has proven to be more effective at managing counts. For his career, he’s located 52% of his fastballs in the zone to open at-bats, a slim lead over the slider. The pitch generates almost no out-of-zone swings, though, which undoes the edge he gets from having more pitches in the zone, and that’s before we even get to what happens when batters do swing. When batters swing at fastballs, they might hit them, and with Stephenson’s fastball, you don’t want that. Take a look at Stephenson’s first pitch outcomes, both in his career prior to 2019 and in 2019.

First Pitch Outcomes
Result 2016-2018 2019
Ball 46.7% 37.0%
Strike 42.5% 56.0%
In Play 10.8% 7.0%

Those balls in play are mostly fastballs, and letting batters put first-pitch fastballs into play isn’t where you want to be when your fastball is as flat as Stephenson’s. Emphasizing the slider has moved all three results the way you’d like to see them move, and even if it’s a small sample size, it’s encouraging to see such promising first-pitch numbers. The league as a whole has a .364 wOBA after a 1-0 count and a .267 wOBA after 0-1. Those 13% of plate appearances that Stephenson has moved from the 1-0 or in play bucket to the 0-1 bucket are like facing Brandon Drury instead of Ronald Acuña 13% of the time — that’ll do nicely.

Maybe you’re a skeptic. Maybe you think that anything can happen in 25 innings, that the dead can walk and a minor leaguer can look like an effective reliever, if only briefly. Maybe you’d prefer to point to Stephenson’s 3.96 ERA and say that even if this is a new skill level, a high-3 ERA reliever hardly merits a deep dive. I don’t see that, though. I see a celebrated prospect who was legitimately not good enough to stick in the major leagues by doing what he’d done his whole life. I see that celebrated prospect making up a new pitch on the fly, throwing that pitch 60% of the time, and excelling in the major leagues with it. Robert Stephenson was a cautionary tale, and now he’s an impact reliever with a hellacious put-away pitch he can throw in any count. In what has so far been a frustrating Reds season, it’s great to see a former prospect make good.


The Astros are Ludicrous

Friend, you’re a baseball fan. You don’t need me to tell you that the Astros are great, because you already know it. You probably know they’re playing .650 baseball so far this year. If you look at their run differential, you might notice that their Pythagorean record is actually better than their record — they “should” have one more win based on their run differential. Heck, if you look at BaseRuns standings, which look at underlying production rather than runs, they “should” have three more wins. Their offensive and defensive statistics work out to a projected .700 winning percentage. That’s a 113-win pace for a full season, and playing well enough to have a 113-win season with neutral luck is outrageous.

You also don’t need me to tell you that the Astros offense is great. Their team batting line so far this year is .275/.349/.488, good for a 126 wRC+. If the entire Astros offense were a player, they’d be a top-60 hitter in all of baseball. Not the Astros starters. Not qualifying Astros batters. The entire team, backup catchers and minor league call-ups and all, is producing slightly better than Ronald Acuna this year. Ronald Acuna signed a $100 million contract this year and people protested how underpaid he is. Again, the entire Astros team is hitting like that.

The thing is, though, you also already knew that. Astros offense superlatives and near-superlatives are endless. They strike out less than any team but the Angels. They hit for more power than any team other than the Twins. They get on base more than any team in baseball. In a stadium that doesn’t help offense, they’re scoring 5.2 runs a game, with underlying statistics that look like they should be scoring 5.5. They’re hitting for the highest batting average in baseball and simultaneously have the third-most home runs, all without having played the Orioles. Average or power? Porque no los dos?

Yes, finding new and interesting things to say about the Astros offense is challenging. I’m going to try, though. One of the strengths of this Astros team is their incredible star power. George Springer is vying with Mike Trout for the most WAR in the American League, with a 172 wRC+ that’s sixth in baseball. Alex Bregman is replicating his breakout 2018 — a 152 wRC+ with more walks than strikeouts. He’s running a BABIP of .237 despite an xBABIP of .316 — he could actually be due for some positive regression! Michael Brantley has turned the Astros’ one lineup hole from 2018, left field, into a point of strength. He’s striking out a what-are-you-talking-about 9.5% of the time while hitting for power on his way to a 144 wRC+.

Those three players have been worth a combined seven wins above replacement. They have a collective 156 wRC+. The only teams with a better-hitting top three (minimum 100 PA per batter) are the Dodgers and the Cubs (the Pirates are a close fourth). The Astros’ stars, in other words, are the envy of nearly all of baseball. As an aside, the best three Marlins batters have put up a cumulative 99 wRC+. What’s an article about a great offense without a fun fact about the inverse?

That’s all well and good — the cream of the Astro crop is incredible. You probably knew that, because all three players are drawing headlines. Great, cool, amazing. What you might not know, though, is that the rest of the offense is incredible as well. Think of it this way: George Springer just went on the 10-day IL with a hamstring strain. How will the Astros offense fare without him? Well, the rest of their team has combined for a 122 wRC+ this year, which would be the second-best batting team in the majors, behind only the equally hot Twins.

We can take this further. Let’s get rid of Bregman as well. Without Bregman and Springer, the Astros would have a 116 wRC+, good for the fifth-best non-pitcher wRC+. Two MVP candidates down, the Astros are nipping at the Cubs’ heels for fourth-best offense in baseball. Heck, let’s go further and take out Brantley. With all three of the Astros’ top trio removed (and again, they’re one of the best groups in baseball), the remaining Astros have compiled a 112 wRC+ this year. That batting line would be fifth-best in baseball, just ahead of the Braves. The Braves have a dynamic offense, with sensational young talent backed by Freddie Freeman. That’s how good the Astros are after you get rid of three MVP candidates. If that doesn’t make much sense to you, well — good. It’s outrageous!

We can go further. The weighted wRC+ of the Astros’ 4th-6th best hitters (Carlos Correa, Jake Marisnick, and Robinson Chirinos) is 137. Want to replace Marisnick’s small sample with a larger sample of a worse batting line from Josh Reddick? It’s still 133. As you might expect, this group of 4th-6th offensive options is the best such group in baseball. The Rangers’ trio of Logan Forsythe (not as washed up as I expected), Elvis Andrus, and Danny Santana are within striking distance at a 127 wRC+, but no one is particularly close to matching the Astros’ trio. Heck, this Astros group is better than 15 other teams’ top three hitters, even if you use the lower-wRC+ Reddick group. The Astros’ mid-tier guys are simply unlucky — they’d be the best three guys on plenty of teams.

Let’s get really crazy now. Let’s exclude the six best hitters from the Astro lineup. I’m cutting Reddick out here in the interest of making the remaining lineup score as poorly as possible. With none of their top six hitters, the Astros have a remaining team wRC+ of 98. The back half of the team, the part that is largely comprised of fifth outfielders and utility infielders and backup catchers, is almost as good at batting as the league as a whole.

If that sounds absurd, it’s because it is. There’s an MVP candidate having a so-so year in this group (Jose Altuve and his 117 wRC+), which is only notable because it’s not one of the best eight batting lines on the team. Aledmys Diaz has a 118 wRC+, which would rank among the top 10 second basemen in baseball if he could get on the field enough to qualify. Heck, even Tony Kemp’s 86 wRC+ isn’t too bad — it’s certifiably great for a fifth outfielder, but it’s not even embarrassing for the worst regular starter on a team, which Kemp most emphatically is not.

How stacked is this Astros team? If the top six Astros weren’t allowed to bat and instead of replacing them with minor leaguers, the team filled in the missing plate appearances with the remaining players’ 2019 lines, the team would project to score roughly 4.5 runs a game after accounting for park factors. With the team’s great pitching (3.53 runs per game allowed), their Pythagorean winning percentage would be .611. The hobbled Astros would have the fifth-best Pythagorean winning percentage in baseball. Want it in BaseRuns? That still works out to a .610 expected winning percentage, fourth-best in baseball.

Now, in reality, this is more of a fun fact about the Astros pitching staff than one about their hitters. Replace the historically dominant Astros offense with a sub-100 wRC+ bunch, and the team would still be one of the best in baseball. Their pitching is just that good. But it’s also an Astros offense fun fact because that 100-ish wRC+ team just so happens to be the Astros’ offense after subtracting out their six best hitters in 2019.

Just to drive the point home, here’s a table of the Astros offense, only subtracting out their x best hitters. The distance you have to go down the line to make a bad team is staggering. The Astros minus their top nine hitters would have the same wRC+ as the Indians this year!

Astros Offense, With Missing Persons
No. of Hitters Removed Remaining wRC+
1 122
2 116
3 112
4 106
5 103
6 98
7 92
8 88
9 77

The 2019 Astros are an exercise in baseball absurdity. Their best hitters are as good as any team’s best hitters. Their mid-tier hitters are better than a bunch of other teams’ best hitters. Their worst hitters are league average. If it’s hard to wrap your head around how good this team is, that’s reasonable. Teams don’t bat this well for full seasons. Since 1900, the only team with a better league-adjusted full-season line is the 1927 Yankees, who were literally nicknamed Murderer’s Row. Teams that hit like the Astros are dimly remembered myths, not flesh-and-blood modern concerns. That’s not a comparison you can make in your head, most likely, because it isn’t one I can make in mine.

Getting rid of the good players makes a comparison a little more mentally reasonable. Remove three MVP candidates, and the Astros are still one of the best-hitting teams in baseball. Remove three more of the best hitters in baseball, and the dregs of the team still hit like the A’s or the Nationals. So don’t focus on the aggregate line, the pure statistical absurdity of the 2019 Astros. Focus on how well every part of the Astros lineup is hitting, how their utility infielder hits like your All-Star second baseman. This performance almost certainly won’t keep up, but it’s still amazing to marvel at the extent of their excellence in 2019.


Let’s Find a Multi-Inning Reliever

The height of fashion in baseball analysis three years ago was finding a reliever who could pitch multiple innings. Some people called it the Andrew Miller role, though Miller was never a perfect example of it — aside from the memorable 2016 playoffs, Miller was more of a setup man who occasionally threw the seventh in his tenure on the Indians. Chris Devenski and Chad Green were trendy examples in 2017, and Mets swingmen Seth Lugo and Robert Gsellman both performed admirably in long relief in 2018.

Whichever example you turn to, the value of having a reliever who can perform over multiple innings of work is clear to see. As starters throw fewer innings across baseball, having relievers who can handle larger workloads is increasingly important. A two-inning reliever might have been a luxury in 2009, when a seven-man bullpen would cover two or three innings a night, but 2019 bullpens go eight deep and pick up nearly four innings a game. Using relievers to cover more innings naturally results in weaker relievers getting into games, so getting extra frames out of good relievers has never been more valuable.

That’s the theory, anyway. In practice, the role isn’t easy to fill. If you’re looking for someone to throw a few innings of relief, they have to be a decent pitcher. There’s not really much point in filling bulk innings with replacement-level stuff — you could just use the back of the bullpen for that. There’s just one problem with that: a good pitcher who can throw multiple innings mostly describes a starter, and getting rid of a good starter to create a good reliever doesn’t make that much sense. Blake Snell, for example, would probably make a great reliever, but that would be a waste of his talent. Read the rest of this entry »


Luke Weaver, Retooled and Reimagined

The book on Luke Weaver was written before he had played a game of professional baseball. Great changeup, good fastball, no third pitch. I mean “the book” metaphorically here, but I also mean it literally. Here’s Eric Longenhagen on Weaver before the 2017 season:

“Those who have questioned Weaver’s upside (myself included) did so because, in college, he lacked a good breaking ball. Weaver’s fringey curveball remains so today, but he’s a good athlete who has developed plus command and added an average cutter to his repertoire in pro ball.”

Cardinals fans got two years of data to back up that assessment — a scintillating 2017 (3.17 FIP, 28.6% K-rate) and a frustrating 2018 (4.45 FIP, fewer strikeouts and more walks) were worth a combined 2.7 WAR, but between underperforming his FIP and losing his rotation spot in the second half of 2018, Weaver felt like a surplus arm. The changeup and sneaky good fastball were as good as advertised, but batters consistently teed off on his curve. When Weaver and top catching prospect Carson Kelly were sent to the Diamondbacks in exchange for Paul Goldschmidt, it felt like a needed change of scenery for both of them.

If the book on Weaver was written while he was still in college, it’s a safe bet that he’s had time to read that book. He has worked towards developing a better breaking ball more or less every offseason of his pro career, and 2019 was no exception. This time, though, he had technological help. He bought a Rapsodo, a portable pitch-tracking camera, and used it to work on his curve. He took his cutter (or is it a slider?) out of mothballs, telling David Laurila he was picking up the hybrid pitch after years of being mainly fastball/change/curve.
Read the rest of this entry »


Josh Bell, Now With Power

Freeze baseball at the end of last year, and Josh Bell fit into an ignominious archetype. A former top prospect, he’d fallen into the power-light first base role previously occupied by the likes of James Loney and Sean Casey. The good power vibes from a homer-happy 2017 (26 dingers, .211 ISO) had faded after his slap-hitting 2018 (12 home runs and a .150 ISO). FanGraphs’ Depth Charts projections penciled him in for a .172 ISO and a wRC+ around 113 — roughly average offensive production for a first baseman.

If that projection was surprising, it was only because Bell looks the part of a slugger. At 6-foot-4 and 235 pounds, he’s an imposing presence at the plate. His minor league numbers had never showed great thump — his best showing was a credible .173 ISO with 14 homers in 2016. After that 2016 season, Eric Longenhagen graded him as having 50 game power — dead average, with the chance to improve to a 55 eventually. Bell’s frame always carried the promise of greater power numbers, but neither scouts nor projection systems thought it was a likely outcome.

That’s all well and good, but uh, have you seen Josh Bell’s 2019? He’s recorded a ludicrous .364 ISO, fifth-best in the majors. He already has 14 home runs and 14 doubles (and, perplexingly, two triples), besting last year’s home run output in only 188 plate appearances. This prodigious power, along with a .366 BABIP, has propelled him to a 185 wRC+, third-best in baseball. The power that was promised by Bell’s physical gifts has finally come in, and it’s come in all at once.

When someone puts up a line like Bell’s (an ISO that looks like a BABIP, a season-long wRC+ higher than any previous month of his career), my natural inclination as an analyst is to look for flukes. Maybe he’s hitting an unsustainable number of line drives, or 75% of his fly balls are turning into home runs. Perhaps he’s faced abysmal pitching in hitters’ parks. Surely any of those explanations is more likely than a sudden, real power spike that dwarfs his previous career. Read the rest of this entry »


Further Adventures In Starting vs. Relieving

Last week, I investigated the changing performance of starters relative to relievers. There’s nothing too crazy about that — FanGraphs is a baseball analysis website, after all, and the starter/reliever divide is a rich topic for analysis. I have to confess, though, that the reception of the article was pretty exciting for me. You see, I got into baseball statistics when a friend recommended The Book to me, and there was Tom Tango, writing about my piece.

Aside from making me feel validated, Tango went over a few methodological improvements I could make to strip a little more noise out of the data. That, in essence, is what all of this analysis is doing — removing noise piece by piece, hoping to find the sweet, sweet signal underneath it all. In my initial article, I covered three topics: pitchers the first time through the order, starters vs. relievers but only using good pitchers, and swingmen. Today, I’d like to look at each of the three with a slightly different aim.

First, let’s talk about performance the first time through the order. Focusing on this consistent set of data (first time through the order, batters 1-7) for both starters and relievers lets us strip out distributional effects from starter workload changes. Merely looking at these splits, however, left out one key factor: home vs. away performance. Mitchel Lichtman has found that home field advantage isn’t a constant — it’s highest in the first inning. Road batters have a pronounced disadvantage relative to home batters in the first inning, which fades away somewhat afterwards. Credit it to having to hit cold, or go the other way and say that road starters are off their game in the first inning, but it’s worth exploring home and away splits to see if there’s anything there. Read the rest of this entry »


Appreciating Kirby Yates

The title gives the suspense of this one away, I know. I thought about leaving it as a mystery, a tease. “Five great MLB relievers — you won’t believe number four!” After thinking about it for a bit, though, I decided suspense was overrated. Kirby Yates has been great the past two years. Like, really great. Even if you think that Kirby Yates has been great, you probably are underestimating just how great he’s been. Here, guess the top five relievers of the past two years by FanGraphs’ WAR.

Top Relievers, 2018-2019
Player ERA FIP WAR
Blake Treinen 1.17 2.09 4.2
Edwin Diaz 2.02 1.92 3.7
Josh Hader 2.5 2.31 3.4
Kirby Yates 1.95 2.15 3.1
Felipe Vazquez 2.23 2.21 3

Now, I don’t know about you, but I got four of the five names. Given that you’re reading an article about Kirby Yates, you presumably didn’t make the same mistake that I did. Context clues and all. Maybe you read Matthew Trueblood’s article about him at Baseball Prospectus yesterday and had him on the brain. Still, though, even FIP can be fluky. How about the best K-BB rates over the last two years?

Top Relievers by K-BB, 2018-2019
Player K% BB% K-BB%
Josh Hader 48.7 9.8 38.9
Edwin Diaz 43.3 6.4 36.9
Nick Anderson 43.5 7.3 36.2
Dellin Betances 42.3 9.6 32.7
Kirby Yates 38.3 7.5 30.7

Hey Nick Anderson, looking good. And there, again, is Yates, striking out the world and walking no one. Read the rest of this entry »