Author Archive

The 2019 AL Cy Young Voting Guide

With just over a week to go in the regular season, Justin Verlander and Gerrit Cole are running neck and neck as favorites for the American League Cy Young award. Verlander leads the league in innings (212) and ERA (2.50). Cole has the lead in strikeouts with 302 with Verlander 19 behind. Even after accounting for Verlander’s 34 homers, his 3.28 FIP is still one of the best marks in the league. On Cole’s side are the strikeouts, a league-leading 2.78 FIP and a 6.7 WAR half a win clear of Verlander. Several other pitchers, like Charlie Morton and Lance Lynn, boast strong resumes, and with five slots on voters’ ballots, many pitchers will receive down-ballot consideration worthy of discussion.

While awards voting is a mostly objective process, when trying to differentiate between a group of very good pitchers, personal preferences are likely to play into the selections. When voters rely on particular stats, be it FIP, ERA, or some other metric, they are making decisions about the importance of defense, park, opponent, and how much talent a big league pitcher is expected to exhibit when it comes to contact quality. Before we get to all of those issues, let’s identify the candidates. There’s a fairly clear top seven among AL starting pitchers (Liam Hendriks might deserve some consideration as well) with Eduardo Rodriguez also included due to his rank based on Baseball-Reference’s WAR.

Here are the eight pitchers under consideration, with some traditional and more advanced statistics:

AL Cy Young Candidates
Gerrit Cole Lance Lynn Justin Verlander Charlie Morton Shane Bieber Lucas Giolito Mike Minor Eduardo Rodriguez
IP 200.1 195.2 212 182.1 201.1 176.2 194.2 185.1
K% 39.1% 27.2% 35.3% 30.0% 30.5% 32.3% 23.4% 24.2%
BB% 6.0% 6.9% 5.0% 7.1% 4.9% 8.1% 7.7% 8.7%
HR/9 1.26 0.92 1.44 0.69 1.34 1.22 1.20 1.12
BABIP .274 .321 .212 .303 .288 .273 .283 .311
ERA 2.61 3.77 2.50 3.16 3.26 3.41 3.33 3.64
ERA- 59 75 56 71 67 75 66 75
FIP 2.73 3.24 3.28 2.84 3.39 3.44 4.08 4.00
FIP- 61 68 73 64 74 74 85 88
WAR 6.7 6.1 6.1 5.6 5.2 5.1 4.2 3.2
1st=Blue, 2nd=Orange, 3rd=Red

A look above shows Gerrit Cole leading in the more advanced statistics, with Verlander gaining the nod from traditional metrics, and Lance Lynn and Charlie Morton sort of splitting the difference between the two Astros. Shane Bieber and Lucas Giolito are a bit behind, with Giolito unable to add anything to his file after being shut down for the season. Mike Minor’s case is made by his low ERA combined with his difficult park, as his strikeouts and walks lag behind the other candidates. Eduardo Rodriguez is the poor man’s version of Minor.

If we looked at FanGraphs WAR, we’d see Cole as the leader due to his incredible strikeout rate and ability to limit homers, at least somewhat. Though he has a 20-inning deficit compared to Verlander, the strikeouts and homers make enough of a difference for Cole to take the day. Verlander and Lynn are in a dead heat when it comes to WAR, with the huge difference in home runs balancing Verlander’s lead in strikeouts and walks and Lynn’s more difficult park in which to keep balls in the field of play. Comparing Lynn to Morton, we see Morton with the homer advantage, but the innings deficit, combined with Tampa Bay being a hard park to homer in, gives Lynn the edge. Read the rest of this entry »


Craig Edwards FanGraphs Chat–9/12/2019

Read the rest of this entry »


When Teams Have Walked, Walked, Walked It Off

In Tuesday’s game between the Padres and Cubs, the two teams entered the bottom of the 10th inning tied up. Steve Cishek came into the game and induced a groundball out from Ty France; Luis Urías followed with an infield single. Then, things got out of control.

Austin Hedges, who at the time had a 52 wRC+ on the season, walked on five pitches. The first three pitches were all borderline, but outside the zone and were called balls. After a pitch right down the middle, Cishek couldn’t make a competitive pitch:

Then in stepped Travis Jankowski, with a career 79 wRC+ in nearly 1,000 major-league plate appearances, but also a robust 10% walk rate. After working the count to 2-2, Jankowski was nearly hit by a pitch. The play was reviewed and it was called a ball. After a 3-2 four-seamer down the middle was fouled off, Cishek threw a sinker well out of the zone:

Read the rest of this entry »


The Cardinals’ Great (and Boring) Defense

At the All-Star Break, the St. Louis Cardinals were an even 44-44 with an 11% shot at the division and a 21% chance at the playoffs. Since the All-Star Break, the team is an NL-best 37-18, just a half-game back of the Houston Astros during that time. The team has gotten great individual performances from Jack Flaherty, whose 3.0 second-half WAR trails only Justin Verlander among pitchers, and Kolten Wong, whose 2.2 WAR in the second half puts him in the top 20 for position players. The team has enjoyed a very good bullpen all season long, and it ranks fourth in baserunning, but on its face, this Cardinals team doesn’t have the look of a 90-plus win division winner. Sometimes a solid defense gets overlooked.

There are currently 47 players in the big leagues with at least four wins on the season. None play for the Cardinals. And St. Louis doesn’t really make up for a lack of star-power with high-end depth, either. Of the 102 players with at least three wins on the season, the Cardinals have just three (Wong, Flaherty, and Paul DeJong). Individually, they might look like the roughly average team they were at the All-Star Break. Even collectively, the numbers don’t impress. As a team, their 99 wRC+ from non-pitchers ranks 17th. Including their good baserunning numbers only ups their offensive rank to 16th in baseball. On the pitching side, their 9.6 WAR from their starters ranks 14th while their bullpen, with the unknown Giovanny Gallegos as their best pitcher, does better at seventh with 4.6 WAR, though the bullpen fails to make a dent overall; the staff still sits in 14th place.

The Cardinals have a thoroughly average offense and an average staff, but are currently projected to win 90 games and only need to go 9-10 the rest of the way to do so. We might chalk some of this up to luck, but their Pythagorean record based on run-differential equals their actual record, and their BaseRuns record is only two games behind their wins in the standings. That means that of the roughly 10 wins that would need to turn to losses to make the Cardinals a .500 team, only a couple have to do with sequencing and getting better results with runners on base than when the bases are empty. Read the rest of this entry »


Beating FIP

For the most part, a pitcher’s FIP is going to line up pretty well with his ERA over the course of a season or a career. There are 240 starting pitchers with at least 1,000 innings over the last 25 years and all but seven of them have a FIP within half a run of their ERA. Even over the course of an individual season, we typically see most pitchers with an ERA and a FIP around the same mark. Over the last 25 seasons covering more than 3,500 individual pitching seasons of at least 100 innings, the r-squared is .61. This season, there are over 100 pitchers with at least 100 innings; the graph below shows their FIPs and ERAs (all stats are through September 5):
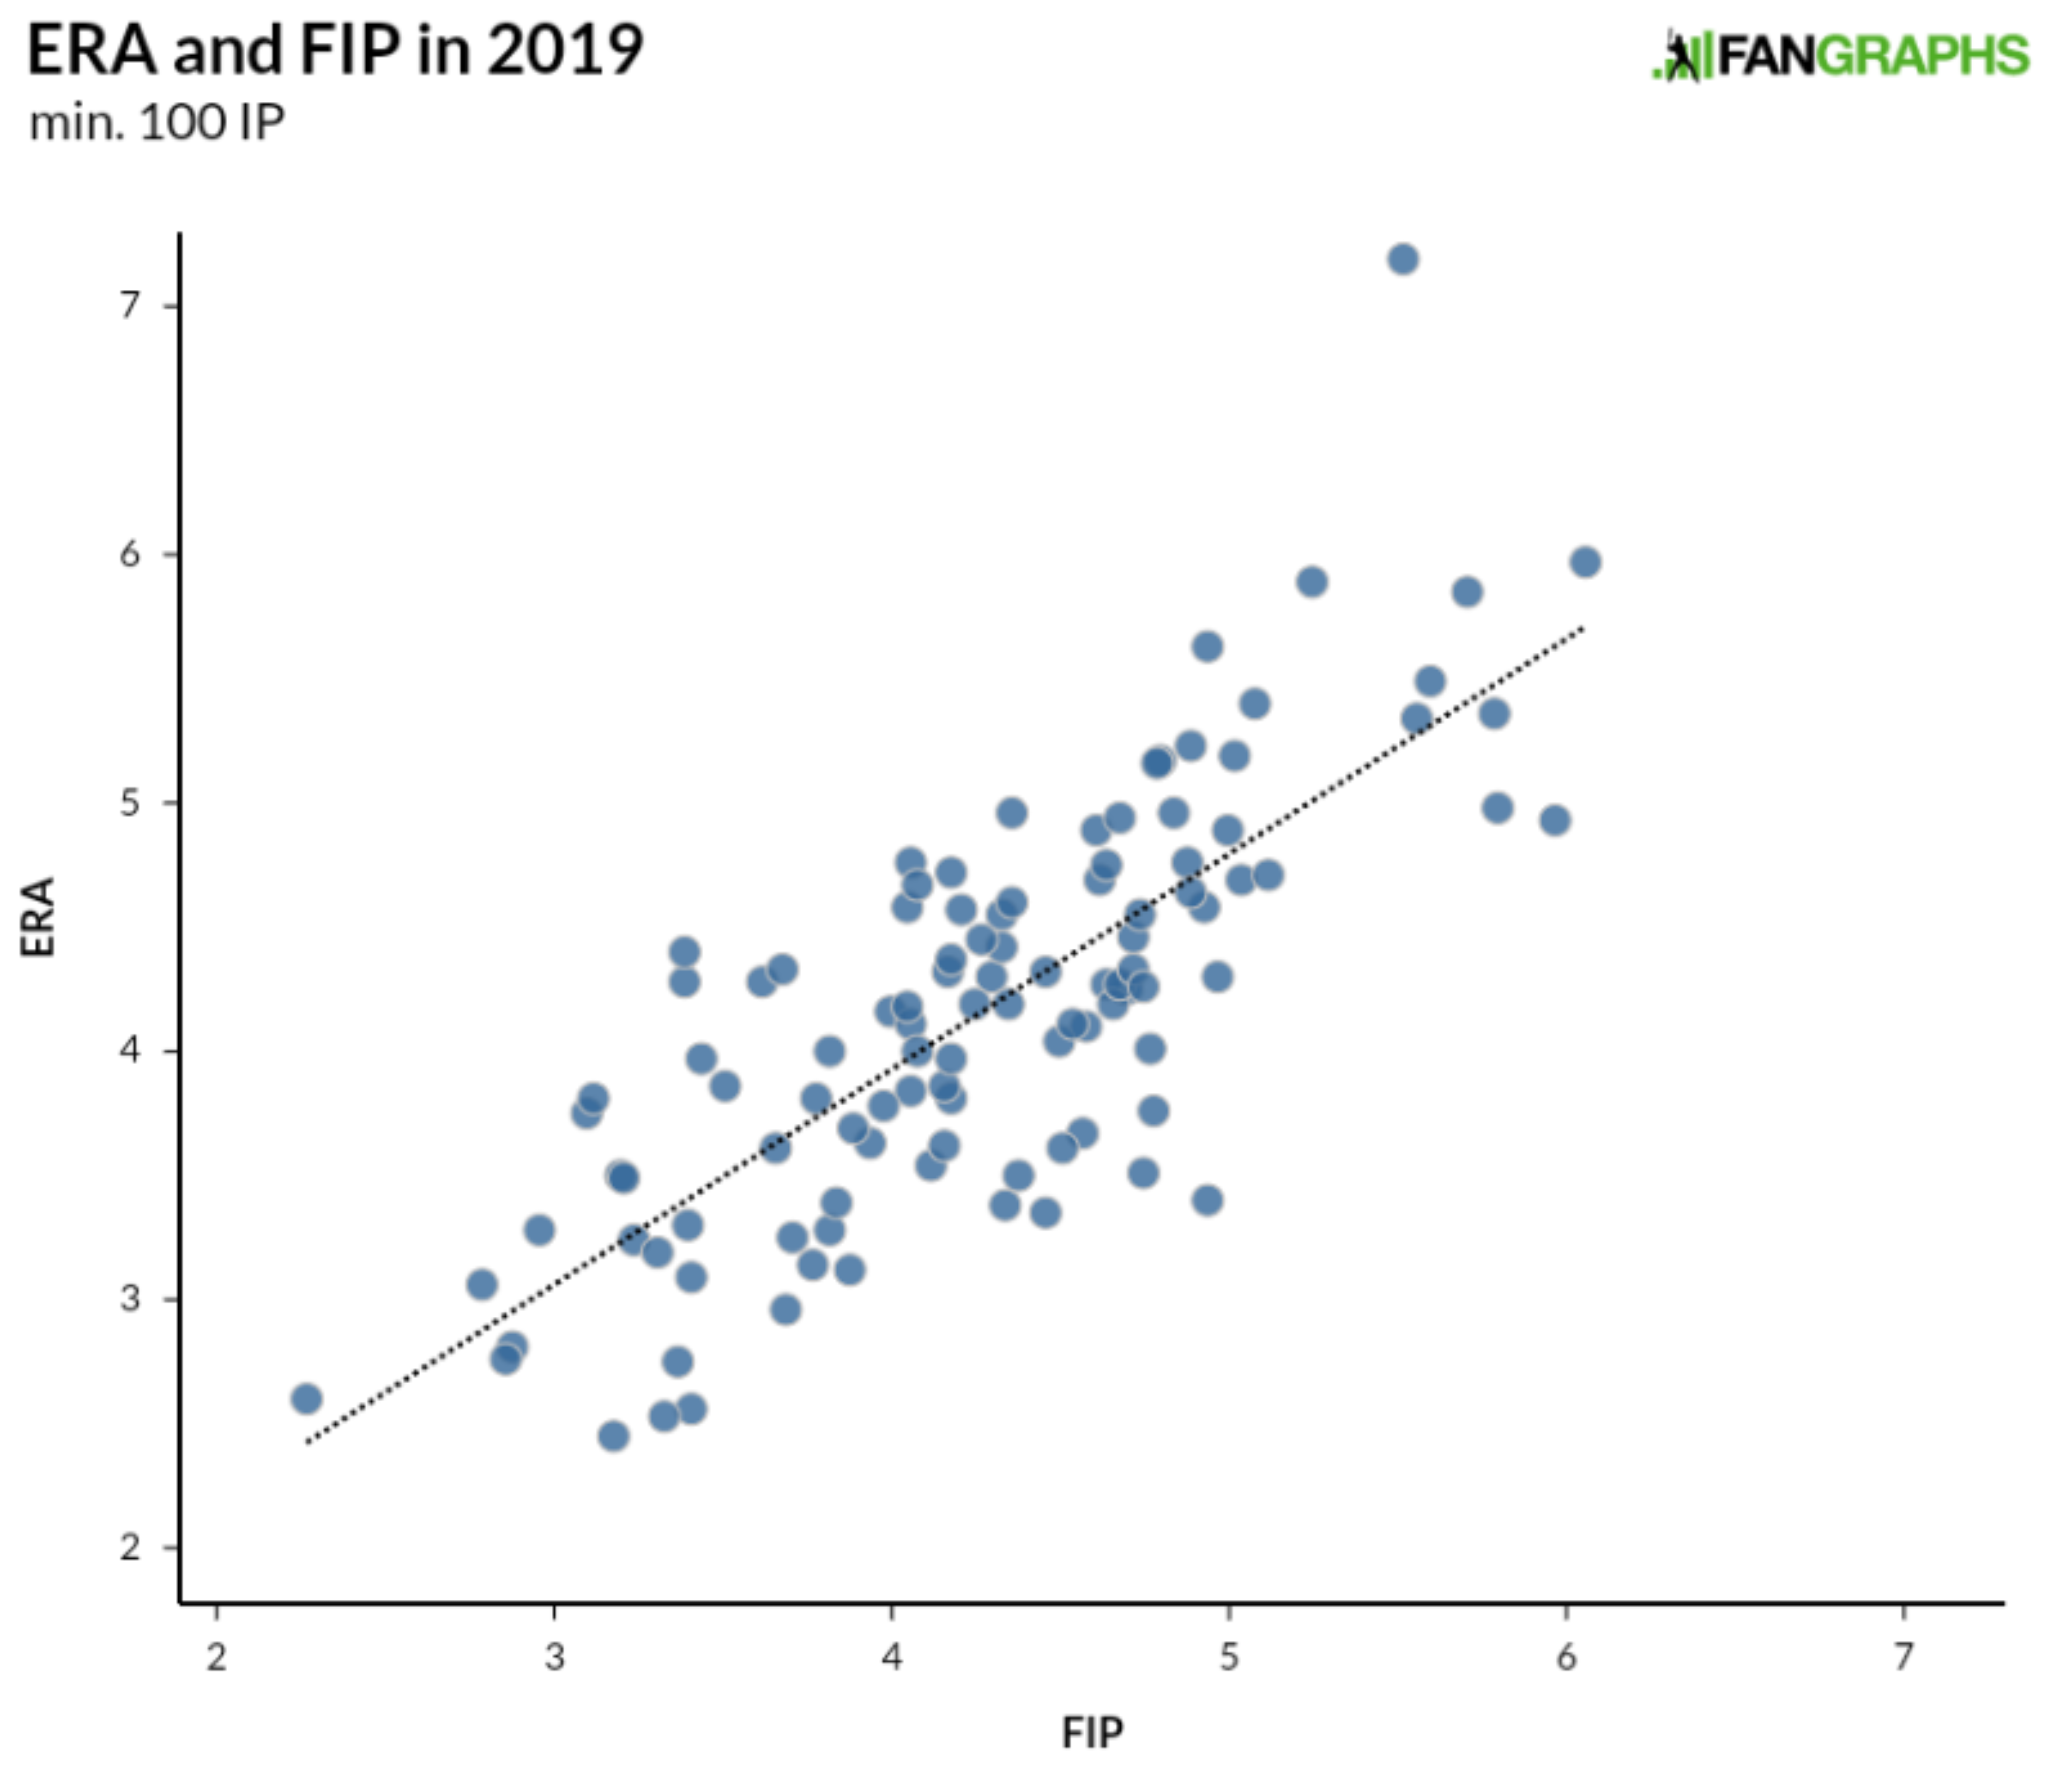
With the exception of Antonio Senzatela way up top, we see a pretty distinct pattern moving up and to the right. Within this cluster of players, there isn’t a perfect relationship. A perfect relationship would make one of the stats duplicative and useless. ERA and FIP both measure results on the field, with ERA accounting for the players who cross home plate after getting on base when the pitcher was on the mound (and the trip home wasn’t made possible by an error), while FIP measures strikeouts, walks, and homers. Every year, a good number of pitchers have an ERA higher than their FIP and vice versa. As far as explaining the difference between the two numbers using readily available statistics goes, BABIP and left-on-base percentage explain much of the gap between the two numbers.

That LOB% would explain some of the gap makes a lot of sense given that stranding more runners than expected is going to keep a pitcher’s runs allowed (ERA) lower than his general performance (FIP). We can see the relationship between ERA-FIP and LOB% for pitchers this season below:
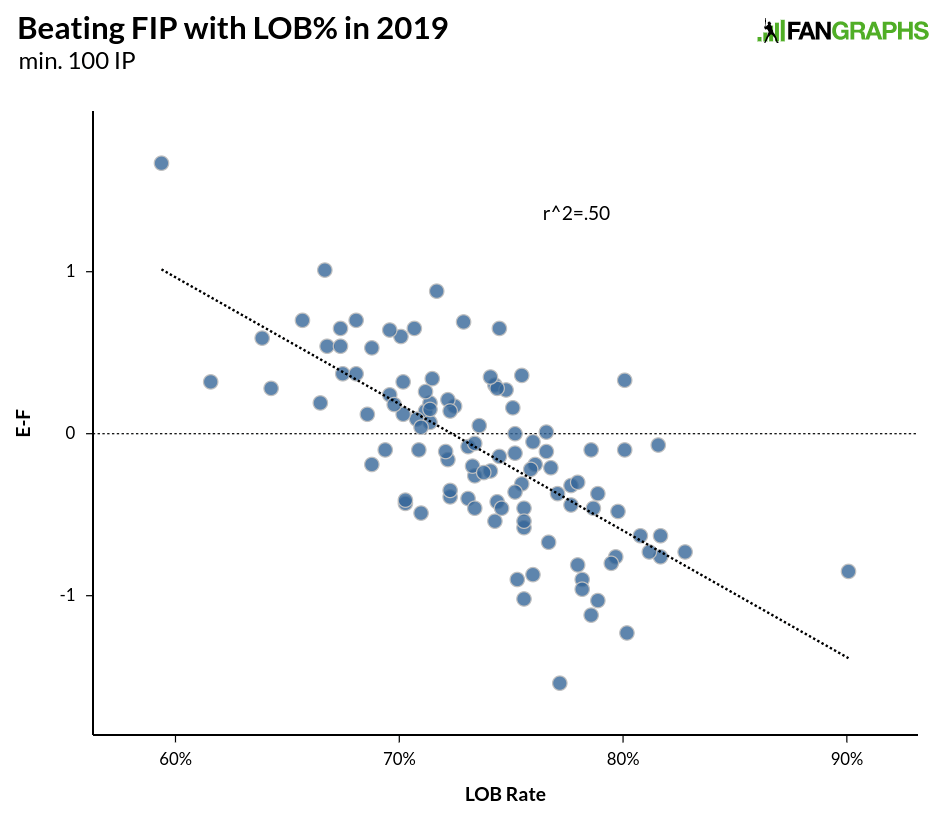
Without delving into whether there’s a skill involved in stranding runners (though better pitchers tend to have higher LOB% due to just being better at getting outs generally), we can see that the more runners stranded and the higher the LOB%, the more likely it is that a pitcher’s ERA is going to be lower than his FIP. The relationship over the past 25 years for individual seasons is stronger than the one above, with an r-squared of .56, but even over just one season, the pattern is apparent. What we are dealing with above is sequencing and what happens when runners are on base compared to overall performance. Generally speaking, pitcher’s perform similarly with runners on base and with the bases empty, with a slight increase in FIP for everyone with runners on base:
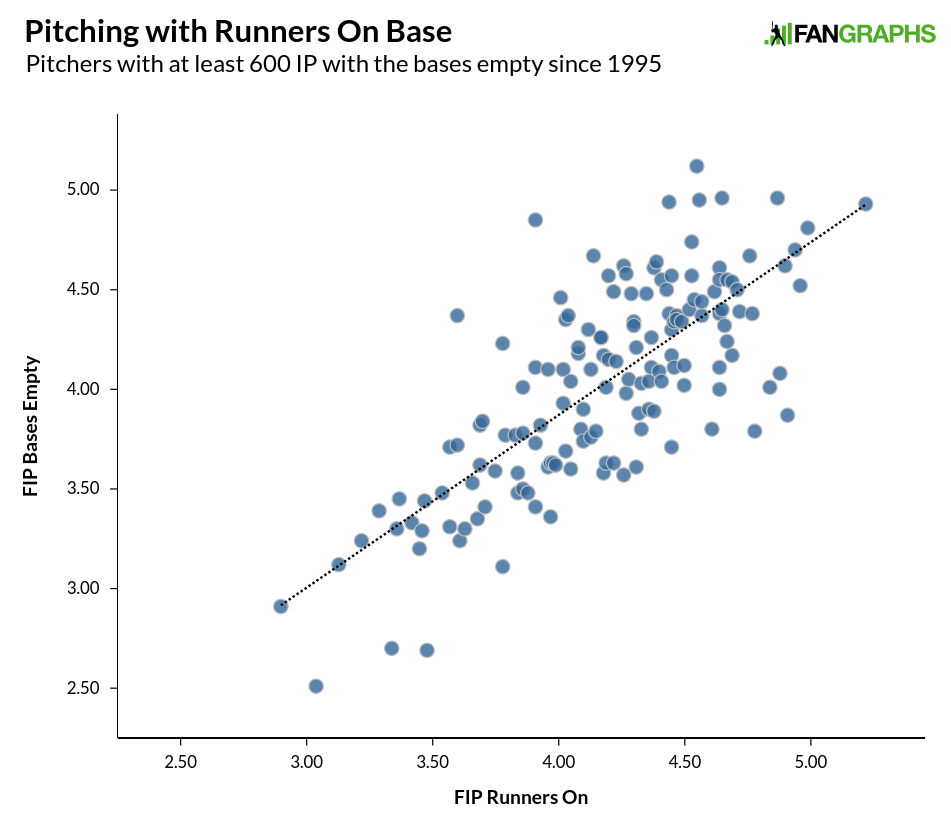
This isn’t to say that some pitchers aren’t worse pitching from the stretch, or that some pitchers don’t change their strategy to more effectively get batters out with runners on base. But generally speaking, pitchers perform a little bit worse with runners on base, though in a fairly uniform pattern as seen in the graph above. Unless you are Doug Davis, Scott Kazmir, Jeff Suppan, or Iván Nova, then with runners on base, you were within half a run with runners on base or worse.

We’ll get back to LOB% in a minute, but first, we should address BABIP. Here’s the relationship between BABIP and the difference between ERA and FIP:
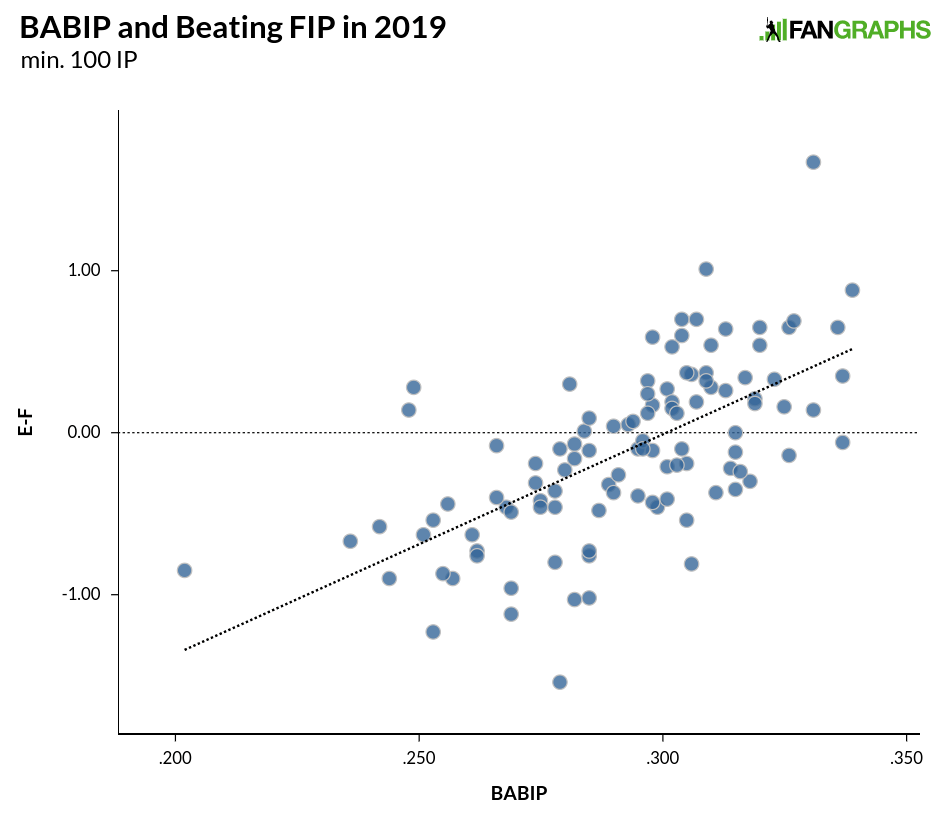
The relationship isn’t as strong as LOB%, but with an r-squared of .41 this season, we can still see a pattern. Over 25 years of individual seasons, the r-squared is .52, nearly the same as LOB% over the same time. While we know that pitchers exert some control over the quality of their contact, over 90% of pitchers with at least 1,000 innings since 1995 are between .270 and .310, and 65% of pitchers are between .285 and .305 (around 10 hits per year at the edges), so even at the extremes we are talking about maybe three or four extra hits per month. That’s not nothing, but over long stretches of time, we generally see the seasonal outliers get closer to their peers.

As for just how much BABIP and LOB% capture the difference between ERA and FIP, the answer is they account for the great majority of it. I took all individual seasons from 1995 through last season and ran them through a multiple regression calculator to come up with a formula for predicting the difference between ERA and FIP. The r-squared for the formula for the 3,400 seasons was .75, so BABIP and LOB% are doing a huge amount of the heavy lifting when it comes to explaining the difference between ERA and FIP. I put the same formula into this year’s numbers and this is how they came out:
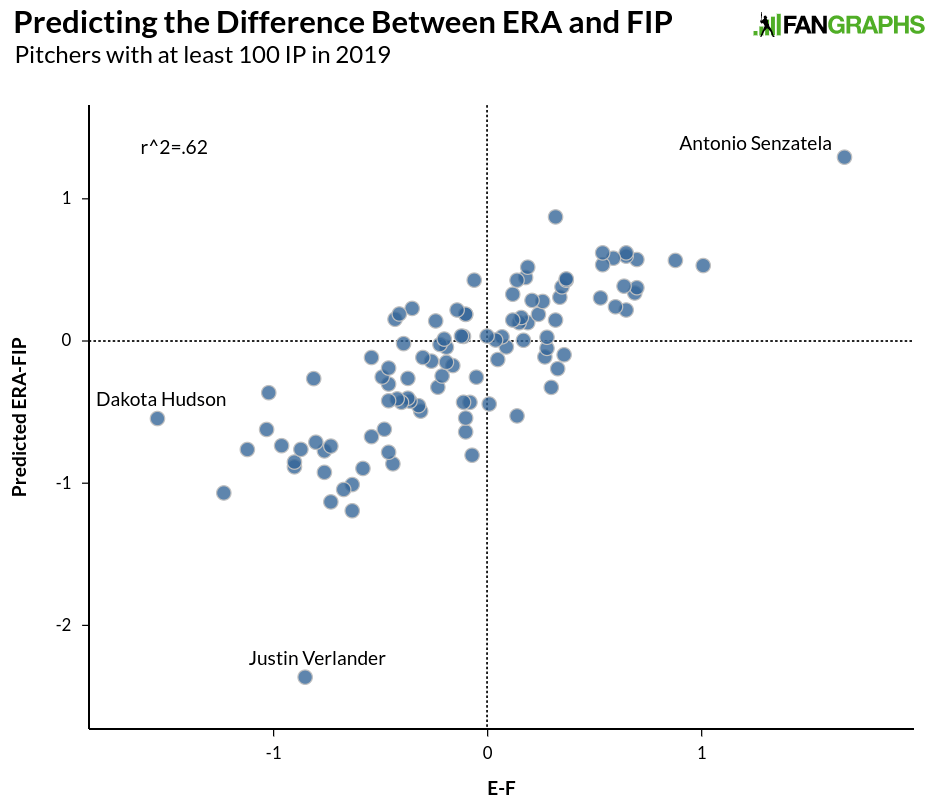
We still see some outliers, but overall, the formula did a very good job predicting the difference between ERA and FIP using LOB% and BABIP. There are a few outliers. Dakota Hudson jumps out, but his larger ERA-FIP discrepancy is pretty easily explained by 15 unearned runs. If he had a more normal five earned runs, the difference would be under a run and he’d be in the big group with everybody else. Justin Verlander, on the other hand, appears to be breaking the formula entirely. To see how, here are 3,500-plus individual pitcher seasons with over 100 innings since 1995, and their LOB% and BABIP:
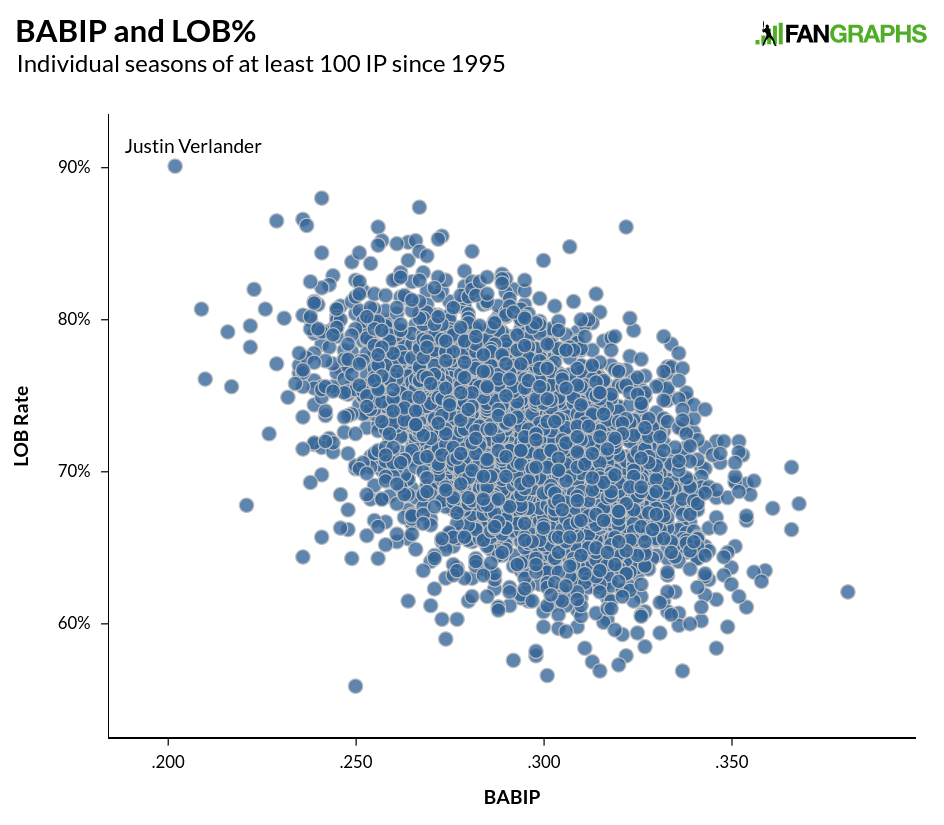
Quite simply, Verlander is having one of the most unusual seasons we’ve ever seen, with the highest LOB% and lowest BABIP in the last 100 years in the same season. As we can see above, there is some correlation between LOB% and BABIP, with an r-squared of .2, but that’s not as strong as either statistic’s relationship with FIP-ERA, and a pitcher’s BABIP’s relationship with his team’s BABIP is around the same strength, with team BABIP and team UZR having a slightly stronger relationship.

While there is certainly a case to be made that pitchers have control over the quality of contact they yield to some extent — no one would deny the existence of groundball pitchers or fly ball pitchers — BABIP doesn’t even necessarily measure contact quality. It counts every batted ball in the park as either a hit or an out, doesn’t include homers at all, and it varies greatly from year to year. Even xwOBA, which includes homers and dials in on the quality of contact, has difficulty finding a relationship year over year on contact. Looking just at in-season results, wOBA on contact has a difficult time becoming reliable.

It’s only natural to want to find a reason why a pitcher’s ERA and FIP are so different, and for that reason to be related to something the pitcher is or isn’t doing. Unfortunately, that isn’t always likely to be the case. In any single season, there are going to be outliers due to the relatively small sample of plate appearances we are dealing with, and almost all of the difference between ERA and FIP can be explained by BABIP and LOB%. While not all of a pitcher’s BABIP and LOB% are due to a pitcher’s defense, sequencing luck, and just general good fortune, a decent amount is just that. Baseball is a team sport and defenses play a large role in run prevention. While it isn’t always easy to admit, luck plays a role as well.


Craig Edwards FanGraphs Chat–9/5/2019

Read the rest of this entry »


The Mystery of Justin Verlander’s Home Runs

In the second half of the season, Justin Verlander has been the best pitcher in baseball. On the heels of a no-hitter over the weekend, Verlander lowered his second-half FIP to a major league-leading 1.91 and his ERA to an AL-leading 1.76, and raised his WAR to 3.2, more than half a win better than second-place Jack Flaherty. On the season, it’s less clear whether Verlander has been the game’s best pitcher. His 2.56 ERA does lead the AL, but his 3.41 FIP is seventh in the league, and even with his 193 innings tops in the game, he’s still nearly a full win behind Lance Lynn in WAR, with Gerrit Cole and Charlie Morton ahead of Verlander’s 5.2 figure as well.

The reason Verlander has performed relatively poorly — even if he’s only the fourth-best pitcher in the AL, he’s having a great season — is due to all of the home runs he has given up. Only Mike Leake and Matthew Boyd have allowed more than the 33 homers offered up by the 36-year-old righty. In some ways, Verlander’s home run troubles are just an extension of the 2018 season. Home runs have gone up from 1.16 per nine innings last year to 1.45 this year; Verlander gave up 1.18 homers per nine innings last year and has given up 1.54 this season. Even if Verlander’s increase was exactly in line with the rest of baseball’s, we’d only be talking about a difference of two home runs, and a 3.28 FIP instead of the 3.41 he currently holds. But that’s still a pretty big difference from his 2.69 ERA, and requires some explanation.

The simple answer behind all of Justin Verlander’s homers is that he’s a fly ball pitcher who throws pitches more prone to homers than most pitchers. A year ago, it might have been that Verlander was a bit unlucky with the long ball. Based on Statcast’s numbers, Verlander’s xwOBA on homers last year was 1.042, which was about 300 points below league average, so he might have had his share of bad luck in that regard. This season, the xwOBA on Verlander homers is 1.317, right in line with the rest of the majors. The same is true when we drop the standards to batted balls with an expected ISO of at least .200. Verlander’s xwOBA on those 97 batted balls was .876 compared to a major league-wide .857, and the resulting wOBA for Verlander was .921 compared to .902 for the rest of the sport. Twenty-five percent of those balls ended up out of the ballpark for the league compared to 31% for Verlander, which isn’t a huge difference. Based on the quality of the contact, Verlander has absolutely earned his home run totals this season. Read the rest of this entry »


Right Place, Right Time for Nicholas Castellanos and Cubs

Looking at this year’s stat line for Nicholas Castellanos yields almost no surprises. He’s putting up a .291/.340/.521 slash line good for a 121 wRC+. At the beginning of the season, our Depth Charts projected Castellanos to put up a 121 wRC+, and over the last three seasons before this one, he put up a .285/.336/.495 slash line with a 121 wRC+. His performance has gone almost exactly like we would expect it to this year, and if Castellanos were still on the Tigers, we wouldn’t have even noticed what the 27-year-old outfielder has done over the last month. Since Castellanos moved from Detroit to the Cubs at the trade deadline, we have a fairly obvious demarcation for his season, and his great performance with the Cubs might lead us to believe that something with him has changed. That’s a bit more difficult to show, however.

Over his first 30 games with the Cubs, Castellanos has hit 11 homers and put up a 167 wRC+ (before last night’s homer brought his total up to 12 and his wRC+ to 173) thanks to those huge power numbers and a .365 BABIP. He’s been one of the 20 most productive hitters in the game. A look at his results says something has changed with his ISO and BABIP way up, but his walks a little down with pretty consistent strikeout numbers compared to what he was doing in Detroit earlier this season. His plate discipline numbers in terms of swings have changed, though his contact percentage has gone down as he’s whiffing on more pitches outside the strike zone. It’s possible he’s been more willing to make mistakes outside the zone and is instead hitting pitches in the zone harder. That could be considered a change, but it is basically what he did last season when he put up a .361 BABIP and a career-high 130 wRC+. He had a similar plate discipline profile in 2016, when he also ran a high .345 BABIP.

It’s probably more important to keep in mind that the difference in walk rate with the Cubs compared to when he was with the Tigers only amounts to about two walks over the last month. While Castellanos has been very good, almost none of this is new when we isolate Castellanos’ first 30 games with the Cubs compared to any other 30-game stretch. That 4.6% walk rate? He’s done that a bunch of times. Read the rest of this entry »


Justin Verlander Earned That No-Hitter

Entering Sunday’s games, 30 pitchers since 1908 had thrown multiple no-hitters. The list is an impressive one, including names like Warren Spahn, Max Scherzer, Walter Johnson, and Randy Johnson. There are also some less exciting names on the list with Homer Bailey, Mike Fiers, and Jake Arrieta all accomplishing the same feat in recent seasons. Of those 30 players with at least two no-hitters since 1908, 27 of the 30 had thrown exactly two such games, including Justin Verlander. After a 14-strikeout, one-walk no-hitter on Sunday, Verlander joins Bob Feller, Cy Young, and Larry Corcoran in all of baseball history three no-hitters, sitting behind only Sandy Koufax (4) and Nolan Ryan (7).

All no-hitters are impressive, as navigating an entire game without allowing a hit is a feat unto itself and generally comes with an excellent defensive performance combined with a great outing from the pitcher. Verlander’s no-hitter is one of the most impressive in recent history due to how little he relied on his teammates to complete the task. Only seven times before has a pitcher put up more than Verlander’s 14 strikeouts in a no-hitter. Scherzer put up 17 in his October 2015 no-hitter and Ryan did the same back in 1973. Ryan also struck out 16 and 15 in other no-hitters, with Clayton Kershaw getting 15 Ks in 2014 while Warren Spahn and Don Wilson also reached 15 strikeouts in their performances. Verlander’s 14 matches four others including Ryan, Koufax, Matt Cain, and Nap Rucker back in 1908. Cain, Koufax, and Rucker did not walk any batters, and the only other pitchers with at least 14 strikeouts and one walk or none were Scherzer and Kershaw. Read the rest of this entry »


King of the Soft-Tossing Lefties

A little over a decade ago, the soft-tossing lefty was all over the place. There was Barry Zito, Mark Buehrle, and Ted Lilly. Late-career Tom Glavine, Kenny Rogers, and Jamie Moyer were getting by on guile, too. Even Mark Redman and Chris Capuano were getting outs without much velocity. Looking around today’s game, we have Jason Vargas trying to hang on and CC Sabathia declining with age, along with diminished velocity and stuff from Dallas Keuchel and Gio Gonzalez. The last four years have seen just three low-velocity left-handers put up three-win seasons, and the only pitcher with two such campaigns is Marco Gonzales, king of the soft-tossing lefties.

On June 2, Gonzales gave up 10 runs to the Angels on the heels of giving up eight runs to the Rangers. It ended a five-start stretch that saw him allow 30 runs in 24.2 innings. He struck just 15 batters and walked nine in that span. Still, due to a solid start to the year, his FIP stood at a decent 4.33 and his ERA was a little worse than average at 4.89. Since that game, roughly half a season of starts has passed and Gonzales has been one of the better pitchers in the game with an ERA and FIP both around 3.50 and his 2.3 WAR ranking 11th, just behind Justin Verlander and just ahead of Lucas Giolito. Gonzales isn’t a great pitcher, but he’s uniquely good, and this is the second straight season he’s accomplished that feat.

There are only 10 qualified starting pitchers in the game who put up a three-win season last year (3.4 for Gonzales) and have already eclipsed that mark this season (3.5 for Gonzales). Verlander, Max Scherzer, Patrick Corbin, Jacob deGrom, Trevor Bauer, and Gerrit Cole are the easier guesses. Zack Wheeler, Jose Berrios, and German Marquez are also in there along with Gonzales. His 6.9 WAR ranks ahead of only Berrios in that group, but it is worth mentioning even lowering the bar to two 2.5-WAR seasons in a row only adds Jake Odorizzi, Charlie Morton, Zack Greinke, Aaron Nola, Jon Gray, Kyle Hendricks, and Kyle Gibson. We are still talking about a relatively small group. Read the rest of this entry »