Author Archive

In 2019, Team Payroll and Wins Are Closely Linked

Over the last decade, we’ve seen a change in the demographics of baseball, with playing time shifting away from older, declining veterans toward younger players still in their prime. There’s a good reason for that, as each new generation of player entering the majors has been getting better and better relative to their older peers. Baseball’s owners have capitalized on this development — those younger, better players are also much cheaper. And teams have not reinvested those gains elsewhere on their rosters, as major league payrolls have stagnated the last few seasons while amateur talent expenditures have become hard-capped. Given the emphasis on younger players, it might be reasonable to believe that when it comes to fielding a winning team, payroll matters less than ever. But that hasn’t been the case this season.

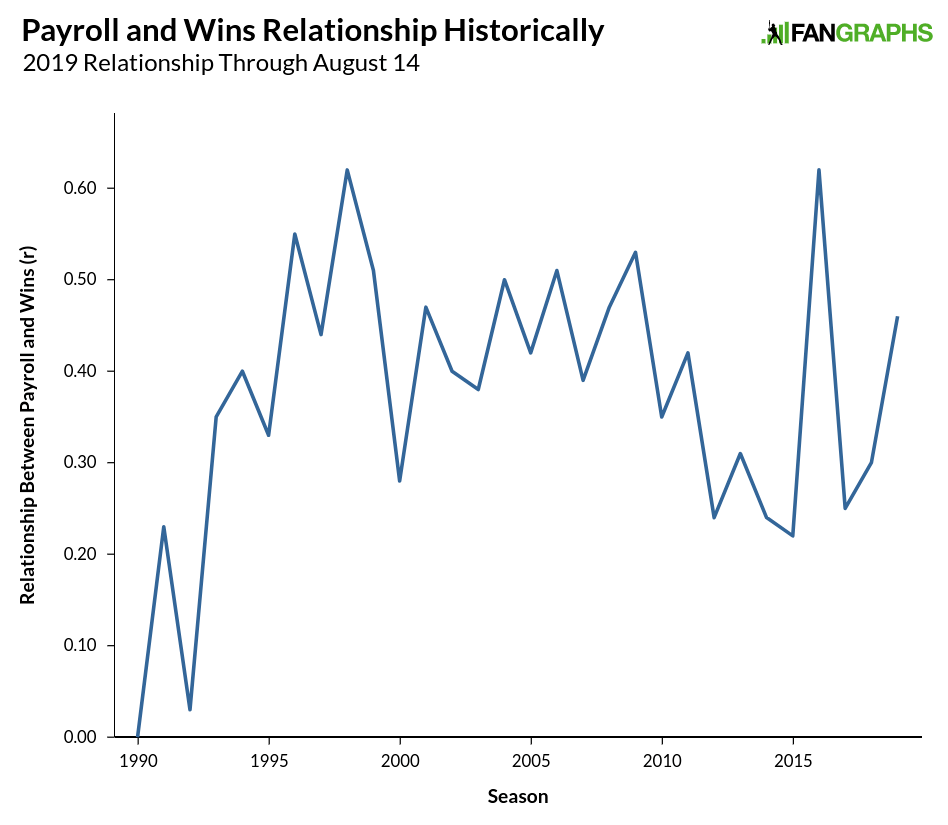
This piece marks the fifth season during which I’ve taken a look at the standings in August and compared them to Opening Day payrolls (2015, 2016, 2017, 2018) and for the most part, the relationship between Opening Day payrolls and wins has been relatively low. I’ve used the Pearson correlation coefficient “r” to track the strength of the relationship between the two and from the end of the strike through 2011, the average correlation per year was .45. In the last seven seasons heading into this season, though, the correlation coefficient between the two was higher than .31 only once, when it was a high .62 back in 2016.

In past years, I’ve noted that while individual season correlations have remained low, looking at either sustained spending or using Forbes franchise valuations to gauge a team’s overall financial might tends to show that the relationship between spending, wealth, and winning remains strong. That logic remains for this season, and indeed, the relationship between wins and payroll trails only that of 2016 season this decade:

Read the rest of this entry »


Craig Edwards FanGraphs Chat–8/15/2019

Read the rest of this entry »


The Old School Approach Failed José Ramírez

Nearly three months into this season, José Ramírez was one of the worst hitters in the game. On June 24, Ramírez had played in 77 games, come to the plate 328 times, and put up a 66 wRC+ which ranked 153rd out of 160 qualified batters. Only good baserunning and decent defense kept Ramírez above replacement level. Since June 25, Ramírez has come to bat 172 times and put up a 143 wRC+ and 1.8 WAR, with both figures ranking among the top 25 players in the game. Before the season, Ramírez was projected for a 138 wRC+ and 6.3 WAR, so he went from one of the worst hitters in baseball for half a season to nearly the exact player he was projected for the last quarter of a season. While slumps and streaks invariably have a lot of contributing factors, it certainly seems like Ramírez spent the first part of the season not trying to crush the game and simply flipped a switch in late June.

The dates used above aren’t exactly arbitrary. On June 25, I wrote a post entitled José Ramirez Isn’t That Far Off. In that piece, I discussed a few different theories behind Ramírez’s struggles, including too many fly balls at poor angles and failures in attempting to adjust to the shift. Ultimately, I went down a plate approach rabbit hole and concluded Ramírez was swinging and making contact on too many pitches when behind in the count instead of just looking and swinging at pitches he could drive. I concluded with this:

Ramírez simply isn’t commanding the strike zone like he used to, and it is showing up in increased swings on breaking and offspeed pitches out of the zone. Ramírez needs to be able to hunt for those fastballs in the plate, and to do so, he has to be able to avoid the breaking stuff. He hasn’t done a poor job of that relative to other players, but part of what made Ramírez a very good hitter was getting in favorable counts and taking advantage. The league might have caught up to him a little bit, but the problem appears to be more on Ramírez’s end and swinging at pitches he didn’t used to. That also means the issue could be fixable. Bad luck has certainly played some role in Ramírez’s big drop, as it might not be as bad as it appears, and if Ramírez can control the plate like he has in seasons past, he just might turn things around.

Ramírez has certainly made me look good over the past couple months, but we can take a closer look at the analysis from June and see if the reasoning still fits. First, let’s look at Ramírez’s swings by count type compared to last year, the early part of this season, and his recent hot streak. Read the rest of this entry »


José Altuve Recovers Health and MVP Form

Over the four-year period from 2015 to 2018, José Altuve’s 24 wins above replacement ranked third among all position players in baseball behind only Mike Trout and Mookie Betts. His 143 wRC+ ranked 10th in the sport and his 2017 MVP win cemented his status as one of the best players in the game. After a strong start to the 2018 season, Altuve suffered a right knee injury last July that eventually required surgery in October. Although he started this season healthy, he began to slump, then hit the disabled list with a hamstring problem and stayed on the disabled list due to lingering pain in his knee. Based on this second half batting leaderboard, it appears his injury and slump are behind him:

Second Half Hitting Leaders
Name PA HR BB% K% ISO BABIP wRC+
Giovanny Urshela 108 11 3.7 % 13.9 % .447 .403 233
Nelson Cruz 106 16 11.3 % 24.5 % .567 .292 232
Jorge Soler 128 12 18.0 % 18.8 % .420 .323 207
Jose Altuve 135 11 8.1 % 14.8 % .350 .380 204
Yordan Alvarez 124 10 12.9 % 22.6 % .349 .391 196
Yuli Gurriel 119 9 4.2 % 10.9 % .339 .363 193
J.D. Davis 96 5 11.5 % 21.9 % .268 .448 185
Mike Trout 120 11 15.8 % 23.3 % .433 .254 182
Alex Bregman 113 5 18.6 % 11.5 % .292 .319 180
Keston Hiura 121 7 9.9 % 30.6 % .346 .476 180

Back in May, Jay Jaffe noted that Altuve’s stint on the injured list coincided with a rare slump for the Astros’ diminutive (obligatory height reference) second baseman. Jaffe discussed how Altuve’s results on batted balls out of the zone were much lower than in previous seasons.

Altuve’s batting average on pitches in the zone is down 57 points relative to last year and 81 points relative to his combined 2015-18 performance; even so, it’s been offset by a higher slugging percentage because of the homers. It’s his contact with pitches outside the zone where the numbers look particularly grim; removing the non-contact plate appearances, he’s 5-for-28 (.179) on such balls this year, all singles, where last year, he was 40-for-119 (.336) with a .437 slugging percentage.

Read the rest of this entry »


Jack Flaherty Is Reaching His High Expectations

Before the season started, expectations for Jack Flaherty were pretty high. After posting a 3.86 FIP, a 3.34 ERA, and 2.4 WAR in 151 innings in his first full season in 2018, projections expected Flaherty to be even better with a 3.74 FIP. After a rough start in Seattle on July 2 in which Flaherty failed to make it out of the fifth inning by walking four and giving up four runs including a homer, the season looked to be a step back rather than a step forward. With a 4.82 FIP and 4.90 ERA on the year, Flaherty’s stats represented a half season of below-average numbers.

Since then, he’s been one of the best pitchers in baseball.

Pitching WAR Leaders 7/7/2019 to 8/7/2019
Name IP K% BB% HR/9 BABIP LOB% ERA FIP WAR
Justin Verlander 31 44.9 % 5.1 % 0.9 .286 91.4 % 1.45 1.64 1.7
Noah Syndergaard 35.1 27.9 % 5.7 % 0.0 .293 75.0 % 1.78 1.77 1.6
Jack Flaherty 38.1 34.3 % 7.0 % 0.5 .210 95.6 % 0.94 2.20 1.6
Jacob deGrom 33 34.4 % 7.8 % 0.3 .301 91.8 % 1.09 1.85 1.5
Lance Lynn 40 33.7 % 7.4 % 0.9 .319 79.2 % 2.70 2.74 1.5
Patrick Corbin 35.1 31.3 % 7.5 % 0.5 .364 78.2 % 3.06 2.28 1.3
Shane Bieber 37 28.7 % 4.9 % 0.5 .278 73.1 % 2.92 2.51 1.3
Charlie Morton 36 28.2 % 5.4 % 0.8 .333 69.6 % 4.00 2.63 1.3
Reynaldo Lopez 31.2 25.4 % 8.2 % 0.3 .291 77.1 % 2.56 2.71 1.2
Gerrit Cole 40 37.1 % 6.0 % 1.6 .228 99.2 % 2.25 3.37 1.1
Clayton Kershaw 31 32.3 % 9.7 % 0.6 .243 88.7 % 1.74 2.64 1.1
Matthew Boyd 31 34.9 % 7.8 % 1.2 .319 73.3 % 4.06 3.06 1
Yu Darvish 29 33.9 % 1.8 % 0.9 .273 87.2 % 2.17 2.46 1

As for what happened, here’s a brief comparison of his numbers over the last month versus the first three months of the season.

Jack Flaherty Got Hot
IP K% BB% HR/9 HR/FB BABIP LOB% P/PA ERA FIP
Through 7/2 90 26.4% 8.1% 1.9 20.9% .288 74.4% 4.22 4.90 4.82
7/7-8/7 38.1 34.3% 7.0% 0.5 5.7% .210 95.6% 4.01 0.94 2.20

We can see from the BABIP and LOB% that there’s probably some luck going on here with the sub-1.00 ERA, and even if there’s a little bit of luck on the home run rate, his 2.20 FIP wouldn’t be impacted that much. A decrease in homers might be luck evening out, but a big increase in strikeouts while seeing the walks go down shows that there’s clearly more than chance that’s pushing Flaherty to great results. It’s not the opponents either, as two of his six starts have come against the two best offenses in the game in the Astros and Dodgers, with the Cubs boasting a top-six offense as well. The biggest change is more fully embracing his best pitch, the slider. Read the rest of this entry »


Craig Edwards FanGraphs Chat–8/8/2019

Read the rest of this entry »


Mike Trout Without WAR

As Mike Trout celebrates his 28th birthday today, he’s arguably the greatest baseball player of all time at his age. The case is a fairly easy one to make. Here’s what our Leaderboards look like for all players through their age-27 season.

Best Position Players Through Age-27 Seasons
Name Team G PA WAR
Mike Trout Angels 1173 5157 72.5
Ty Cobb Tigers 1241 5258 68.8
Mickey Mantle Yankees 1246 5409 67.9
Rogers Hornsby Cardinals 1119 4768 64.6
Jimmie Foxx Athletics 1256 5239 64.6
Alex Rodriguez – – – 1275 5687 62.0
Mel Ott Giants 1438 5988 61.5
Ken Griffey Jr. Mariners 1214 5262 57.0
Tris Speaker – – – 1065 4551 54.4
Eddie Collins Athletics 1013 4294 53.7
Eddie Mathews Braves 1177 5139 53.5
Albert Pujols Cardinals 1091 4741 53.5
Arky Vaughan Pirates 1149 5055 52.9
Joe DiMaggio Yankees 979 4417 52.5
Hank Aaron Braves 1194 5201 52.4
Babe Ruth – – – 795 3130 51.9
Johnny Bench Reds 1236 5193 50.4
Lou Gehrig Yankees 921 4024 49.7
Stan Musial Cardinals 915 4026 49.7
Willie Mays Giants 914 3981 49.3

Trout is at the very top, and by the end of the season, he’s projected to add another 2.7 WAR to bolster his lead. Right now, the gap between Trout and 10th-place Eddie Collins is the same as the gap between Collins and 54th-ranked Joe Torre. To calculate WAR, we know the run-values of many of the plays on the field. We know how many runs a single, a walk, and a homer are worth, and we can make those determinations based on the ballpark they are hitting in and the run-scoring environment at the time in order to compare players across eras. We do the same for stolen bases and extra bases taken and look at a player’s value on defense. We can put in all that information and determine that Trout is the best player this game has ever seen through a 27-year-old season. He’s already 52nd among position players all time, and a solid finish to this season and an average Trout season in 2020 might put him in the top 30. Read the rest of this entry »


The Cardinals’ Deadline Failure Was a Long Time Coming

When the Cardinals beat the Cubs 2-1 last Tuesday, the team took control of first place in the National League Central by one game over Chicago and two games over Milwaukee. That was the last game for St. Louis ahead of the trade deadline. While the season had been an up and down one for the Cardinals, with a great April, a terrible June and July, and a big surge after the All-Star break, the team put itself in position to make a run at the division title. While the offense had struggled for a few months, the club didn’t really need a bat to fortify itself, and there wasn’t much help available at the trade deadline, anyway. The bullpen had been a somewhat unexpected strength all season, and even with Jordan Hicks out, Andrew Miller‘s resurgence, Giovanny Gallegos‘ rise, and Carlos Martinez’s move to relief (plus the arms available in the minors), meant the relievers didn’t need a lot of help, even if another lefty would have been acceptable. But Cardinals had a very clear need in the rotation, and they did nothing to address it.

St. Louis’ front office has gotten a lot of criticism for the team’s failure to make the postseason the past three years. Some of that criticism is deserved, but sometimes, it misses the mark. It’s true that the Cardinals haven’t been very active at the trade deadline in recent seasons, but then, there hasn’t been much need for a lot of activity. The table below shows the Cardinals’ playoff odds on the day before the trade deadline, since 2014:

Cardinals Playoff Odds Before the Trade Deadline
Division Wild Card Playoffs Division Series
2014 32.2% 25.4% 57.6% 44.6%
2015 79.0% 20.4% 99.4% 89.1%
2016 3.9% 43.0% 47.0% 24.5%
2017 6.8% 16.0% 22.8% 15.4%
2018 0.7% 12.3% 13.1% 7.0%
2019 30.1% 22.8% 52.9% 41.0%

The Cardinals haven’t had more than a 25% chance of making the division series, or even a 10% chance of winning the division at the trade deadline, since 2015. In that season, the team was virtually assured of a playoff spot, so they added a few relievers and a bench bat. Without going over all of those seasons in detail, the Cardinals haven’t found themselves in a position where an infusion of talent at the trade deadline would have meaningfully tipped their playoff odds since 2014, when they traded two young players off their active roster in Joe Kelly and Allen Craig for John Lackey, who was signed through 2015. The Cardinals’ failure to address their needs this trade deadline is a departure from past seasons, not a continuation. Read the rest of this entry »


Second Wild Card Didn’t Ruin the Trade Deadline

As the trade deadline came and went, there seems to have been a feeling of disappointment about its activity, or perceived lack thereof. Too many players stayed put, while too many teams failed to improve. Ken Rosenthal went so far as to say that “life was getting sucked out of the sport.” Rosenthal cited the Dodgers, Cardinals, and Yankees as clubs that failed to do anything of significance, with the Angels, Phillies, and Red Sox as other teams who failed to do much at the deadline. Rosenthal includes a quote from White Sox GM Rick Hahn and floats the idea that the one-game Wild Card doesn’t provide enough incentive for teams to want to win. That statement isn’t really supported by this deadline, though.

Rosenthal correctly identifies that baseball’s economic system, which has fallen behind the times when it comes to rewarding players monetarily for their play on the field, is broken, and he’s hardly alone in suggesting that the second Wild Card helped to cause a trade deadline that lacked movement (or, more specifically, big movement — as Ben Clemens noted, the deadline was incredibly busy). Jayson Stark included a quote from an executive in his piece on the deadline:

“If you do that, you’re putting a lot of your future on playing one game,” said one NL exec. “It doesn’t make sense [to go all in to play one game]. If you made the Wild Card two out of three, I bet you’d see more teams willing to do something. At least that’s a series. But who’s going to make a big trade for a chance to play one game?”

Read the rest of this entry »


Craig Edwards FanGraphs Chat – 8/1/2019

Read the rest of this entry »