2019 ZiPS Projections – Detroit Tigers

After having typically appeared in the hallowed pages of Baseball Think Factory, Dan Szymborski’s ZiPS projections have now been released at FanGraphs for more than half a decade. The exercise continues this offseason. Below are the projections for the Detroit Tigers.
Batters
2014 sure seems a long time ago when you look at these offensive projections, doesn’t it? What’s especially troubling when you consider them is that as a whole is there just isn’t all that much upside. It wasn’t so long ago that Miguel Cabrera was hitting at an All-Star level, but the reality is that he’s only played in 168 games over the last two seasons and hit an un-Miggy-like .260/.344/.410. It’s good news of a sort that his back wasn’t one of the injury culprits in 2018, but for a 36-year-old (in April) still just a year removed from having two herniated discs, I may be searching for good news.
Nicholas Castellanos has developed into a very good hitter, but like his predecessor, J.D. Martinez, he’s one who really shouldn’t play the field. It was a good idea to give Castellanos a chance in the outfield, but it turns out he’s not much better as an outfielder than he was as a third baseman. If the Tigers want to win a few more games in 2019, I’d just stick him at designated hitter. That is, assuming he’s not traded in the next few weeks as he hopes. Castellanos is likely the only player on the roster who ought to be a trade target; Cabrera’s contract makes him unmovable without eating an obscene amount of cash and the Tigers shouldn’t deal Jeimer Candelario.
Otherwise, the amount of offensive talent, with the exception of Castellanos and Candelario, is almost shockingly scant. With Jose Iglesias not counting since he’s a free agent, minor-league defensive wizard Jake Rogers projects as the fourth-most valuable Tiger given a whole season of play. It’s unusual for a replacement-level offensive player to project so well. ZiPS projected the Marlins and Orioles to have, respectively, nine and 10 position players in their organizations worth 0.6 WAR or better, a murderers’ row compared to Detroit’s four.
ZiPS could, of course, be wrong. The Steamer projections are far more positive. If you’re a fan of the Tigers, that’s the system you’re hoping will be right this year, at least when it comes to the starting lineup.
Pitchers
This is a bit of a flip from the batters, in that ZiPS likes the pitching more than Steamer does. Now, the top-end projections in the rotation don’t even sniff at All-Star level, but there’s a lot more of interest here than there is with the hitters. ZiPS projects a rebound season from Michael Fulmer, but one in which he looks like a solid No. 2 starter rather than the ace the Tigers believed they had after his 3.06 ERA, AL Rookie of the Year debut in 2016. Rating Fulmer’s abilities too highly is what made Detroit so reluctant to trade him absent an enormous return, and I still believe they’ll come to regret it. Don’t get me wrong, Fulmer still has trade value, but as a good-not-great pitcher who still hasn’t proven to be much of a workhorse, the Tigers would get less now than they would have after 2016 or 2017.
There’s a bit of a trap here for Detroit. With Matt Moore, Tyson Ross, and Jordan Zimmermann under contract, to go along with Fulmer and Matt Boyd, the Tigers could very well start the season without any of the mildly interesting prospects and hangers-ons they have haunting Comerica Park roaming the field. I’m not even talking about the organization’s top four or five pitching prospects, which seem to be some combination of Casey Mize, Franklin Perez, Matt Manning, Beau Burrows, and Alex Faedo (stay-tuned to Kiley McDaniel and Eric Longenhagen for more on this than this brief little writeup). I’m talking about Daniel Norris; the Tigers really need to figure out whether or not he is a bust rather than let another rebuilding team do so. I’m talking about exploring Blaine Hardy’s potential as a starter more. Matt Hall isn’t a top prospect, but his curve keeps getting batters out as he moves up the ladder and he was excellent in 10 starts for Triple-A Toledo. Even an extended look at a non-prospect like Spencer Turnbull strikes me as more productive than the current rotation plan; there’s little flip potential in Moore, Ross and Zimmermann.
You don’t find Corey Klubers or Dallas Keuchels without taking chances on lesser prospects and non-prospects. Being able to get an extended look at these kinds of players is one of the advantages a rebuilding team has over contenders.
Bench and Prospects
The general hope is that the pitching will largely take care of itself. There’s a lot of truth to this; if two of the five pitching prospects named in the last section are good major leaguers, the Tigers are a long way towards becoming contenders again. The chances of building an offense from the minor leagues, on the other hand, look quite low, even if, for the sake of argument, we accept that Christin Stewart meets Steamer’s significantly higher expectations. Daz Cameron has very high variance in the projections, enough to make him a far better prospect than one would initially think from his fairly ugly 2019 projection, but after that, the quality drops off tremendously. Now, a projection system doesn’t really have much to say — yet — about players with limited professional experience like Kody Clemens or Parker Meadows, but every team has several prospects they can say that about. Detroit needs some real wins from the position players or when the pitching is playoff-ready, they’ll likely have to write some big checks to assemble a lineup to match.
One pedantic note for 2019: for the WAR graphic, I’m using FanGraphs’ depth chart playing time, not the playing time ZiPS spits out, so there will be occasional differences in WAR totals.
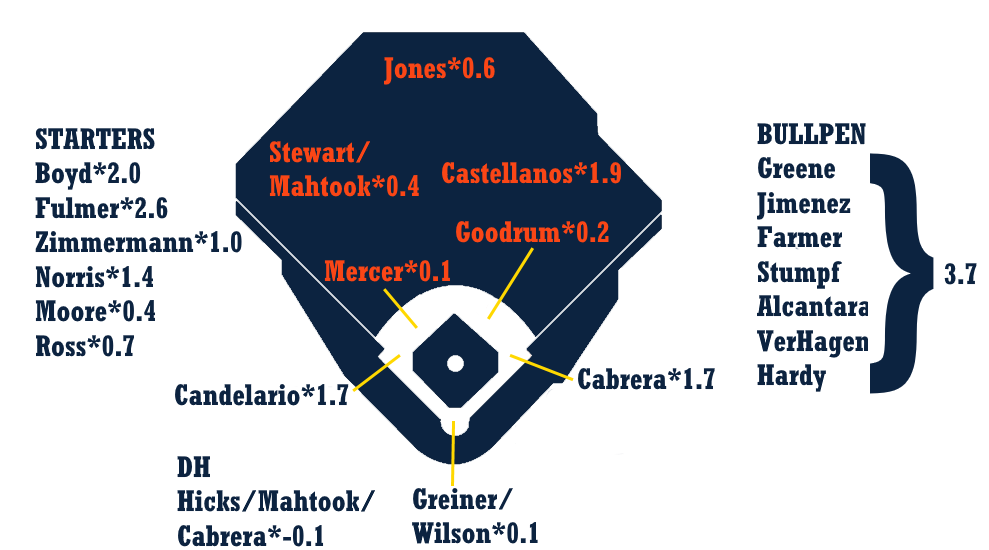
Ballpark graphic courtesy Eephus League. Depth charts constructed by way of those listed here at site.
| Player | B | Age | PO | G | AB | R | H | 2B | 3B | HR | RBI | BB | SO | SB | CS |
|---|---|---|---|---|---|---|---|---|---|---|---|---|---|---|---|
| Nicholas Castellanos | R | 27 | RF | 156 | 596 | 72 | 165 | 38 | 6 | 27 | 91 | 45 | 151 | 2 | 3 |
| Jeimer Candelario | B | 25 | 3B | 146 | 540 | 72 | 127 | 33 | 3 | 17 | 62 | 59 | 151 | 2 | 1 |
| Miguel Cabrera | R | 36 | 1B | 106 | 389 | 47 | 107 | 20 | 1 | 15 | 58 | 52 | 86 | 0 | 1 |
| Jose Iglesias | R | 29 | SS | 131 | 458 | 50 | 121 | 27 | 2 | 5 | 42 | 22 | 53 | 12 | 6 |
| Jake Rogers | R | 24 | C | 99 | 372 | 44 | 74 | 15 | 2 | 12 | 43 | 32 | 126 | 6 | 4 |
| JaCoby Jones | R | 27 | CF | 128 | 451 | 53 | 93 | 20 | 4 | 12 | 43 | 30 | 165 | 14 | 5 |
| Christin Stewart | L | 25 | LF | 135 | 500 | 68 | 116 | 23 | 3 | 23 | 76 | 55 | 151 | 1 | 1 |
| Kaleb Cowart | B | 27 | 3B | 128 | 438 | 51 | 100 | 25 | 3 | 10 | 49 | 34 | 118 | 11 | 3 |
| Ronny Rodriguez | R | 27 | SS | 124 | 467 | 52 | 118 | 21 | 3 | 14 | 55 | 18 | 101 | 8 | 6 |
| Gordon Beckham | R | 32 | 2B | 114 | 371 | 41 | 87 | 18 | 1 | 7 | 37 | 31 | 63 | 3 | 2 |
| John Hicks | R | 29 | C | 94 | 323 | 37 | 77 | 15 | 1 | 9 | 36 | 19 | 90 | 3 | 2 |
| Grayson Greiner | R | 26 | C | 86 | 296 | 30 | 61 | 13 | 1 | 7 | 31 | 28 | 92 | 0 | 0 |
| Niko Goodrum | B | 27 | 2B | 123 | 435 | 52 | 100 | 22 | 3 | 14 | 50 | 36 | 135 | 12 | 5 |
| Willi Castro | B | 22 | SS | 134 | 524 | 58 | 126 | 24 | 3 | 10 | 45 | 26 | 126 | 16 | 7 |
| Jordy Mercer | R | 32 | SS | 126 | 432 | 45 | 105 | 21 | 2 | 8 | 45 | 37 | 87 | 2 | 1 |
| Hector Sanchez | B | 29 | C | 55 | 152 | 18 | 36 | 8 | 0 | 6 | 23 | 10 | 38 | 0 | 0 |
| Mikie Mahtook | R | 29 | LF | 128 | 445 | 52 | 102 | 19 | 5 | 14 | 52 | 30 | 125 | 7 | 3 |
| Dustin Peterson | R | 24 | LF | 115 | 440 | 47 | 100 | 24 | 1 | 10 | 46 | 31 | 116 | 2 | 1 |
| Kade Scivicque | R | 26 | C | 89 | 329 | 33 | 75 | 13 | 1 | 6 | 29 | 18 | 73 | 0 | 0 |
| Brandon Dixon | R | 27 | 1B | 121 | 391 | 45 | 88 | 20 | 2 | 14 | 47 | 23 | 137 | 10 | 4 |
| Edwin Espinal | R | 25 | 1B | 115 | 416 | 42 | 100 | 19 | 0 | 8 | 41 | 27 | 82 | 0 | 0 |
| Chad Huffman | R | 34 | 1B | 93 | 309 | 39 | 68 | 15 | 2 | 11 | 36 | 29 | 86 | 2 | 1 |
| Bobby Wilson | R | 36 | C | 63 | 189 | 17 | 36 | 7 | 0 | 4 | 20 | 13 | 54 | 0 | 0 |
| Jacob Robson | L | 24 | CF | 116 | 460 | 54 | 104 | 21 | 3 | 9 | 42 | 45 | 147 | 12 | 8 |
| Kody Eaves | L | 25 | 3B | 103 | 372 | 39 | 74 | 16 | 3 | 8 | 35 | 31 | 121 | 5 | 4 |
| Jason Krizan | L | 30 | 2B | 112 | 410 | 45 | 97 | 19 | 2 | 8 | 41 | 36 | 68 | 4 | 3 |
| Dawel Lugo | R | 24 | 2B | 148 | 593 | 60 | 148 | 26 | 4 | 8 | 54 | 18 | 88 | 7 | 3 |
| Harold Castro | L | 25 | 3B | 116 | 413 | 38 | 100 | 14 | 2 | 3 | 27 | 10 | 80 | 8 | 6 |
| Pete Kozma | R | 31 | SS | 126 | 347 | 32 | 67 | 16 | 1 | 2 | 23 | 19 | 79 | 6 | 3 |
| Victor Martinez | B | 40 | DH | 111 | 399 | 29 | 100 | 16 | 0 | 7 | 45 | 28 | 50 | 0 | 0 |
| Troy Montgomery | L | 24 | CF | 102 | 368 | 41 | 79 | 12 | 3 | 5 | 29 | 41 | 106 | 10 | 8 |
| Daz Cameron | R | 22 | CF | 129 | 498 | 56 | 110 | 23 | 6 | 9 | 48 | 38 | 152 | 20 | 13 |
| Sergio Alcantara | B | 22 | SS | 126 | 486 | 46 | 111 | 16 | 3 | 2 | 29 | 34 | 108 | 9 | 8 |
| Cam Gibson | L | 25 | LF | 112 | 404 | 44 | 78 | 12 | 4 | 10 | 38 | 35 | 133 | 13 | 8 |
| Josh Lester | L | 24 | 1B | 121 | 462 | 51 | 100 | 22 | 3 | 14 | 53 | 35 | 131 | 2 | 1 |
| Jarrod Saltalamacchia | B | 34 | C | 71 | 210 | 20 | 32 | 7 | 1 | 6 | 21 | 24 | 91 | 1 | 0 |
| Victor Reyes | L | 24 | LF | 133 | 416 | 51 | 101 | 15 | 5 | 3 | 30 | 16 | 89 | 14 | 5 |
| Brady Policelli | R | 24 | C | 98 | 358 | 34 | 71 | 16 | 3 | 7 | 30 | 22 | 100 | 12 | 9 |
| Derek Hill | R | 23 | CF | 100 | 352 | 33 | 66 | 9 | 3 | 4 | 25 | 27 | 125 | 24 | 12 |
| Daniel Woodrow | L | 24 | RF | 96 | 371 | 36 | 86 | 13 | 2 | 2 | 25 | 24 | 93 | 15 | 10 |
| Will Maddox | L | 27 | 2B | 108 | 430 | 40 | 101 | 14 | 2 | 3 | 30 | 19 | 93 | 8 | 8 |
| Player | BA | OBP | SLG | OPS+ | ISO | BABIP | RC/27 | Def | WAR | No. 1 Comp |
|---|---|---|---|---|---|---|---|---|---|---|
| Nicholas Castellanos | .277 | .330 | .497 | 120 | .220 | .330 | 6.0 | -9 | 1.9 | Mike Brown |
| Jeimer Candelario | .235 | .315 | .402 | 93 | .167 | .296 | 4.5 | 2 | 1.7 | Kory Casto |
| Miguel Cabrera | .275 | .361 | .447 | 118 | .172 | .319 | 6.0 | 0 | 1.5 | Pedro Guerrero |
| Jose Iglesias | .264 | .305 | .365 | 81 | .100 | .290 | 4.1 | 5 | 1.3 | Gary DiSarcina |
| Jake Rogers | .199 | .269 | .347 | 65 | .148 | .265 | 3.1 | 8 | 0.7 | Danny Ardoin |
| JaCoby Jones | .206 | .265 | .348 | 64 | .142 | .296 | 3.2 | 10 | 0.5 | Jason Robertson |
| Christin Stewart | .232 | .314 | .428 | 98 | .196 | .285 | 4.7 | -5 | 0.5 | Kevin Barker |
| Kaleb Cowart | .228 | .285 | .368 | 75 | .139 | .290 | 3.8 | 3 | 0.5 | Mike Turgeon |
| Ronny Rodriguez | .253 | .281 | .400 | 82 | .148 | .295 | 4.0 | -3 | 0.4 | Ronny Cedeno |
| Gordon Beckham | .235 | .298 | .345 | 74 | .111 | .266 | 3.6 | 3 | 0.4 | Mike Bordick |
| John Hicks | .238 | .281 | .375 | 76 | .136 | .304 | 3.7 | -1 | 0.3 | Damian Miller |
| Grayson Greiner | .206 | .274 | .328 | 63 | .122 | .274 | 3.1 | 4 | 0.3 | Matt Garrick |
| Niko Goodrum | .230 | .292 | .391 | 83 | .161 | .301 | 4.0 | -5 | 0.2 | Sean Berry |
| Willi Castro | .240 | .281 | .355 | 71 | .115 | .299 | 3.6 | 0 | 0.2 | Greg Gagne |
| Jordy Mercer | .243 | .307 | .356 | 80 | .113 | .288 | 3.9 | -3 | 0.1 | Charlie Hayes |
| Hector Sanchez | .237 | .287 | .408 | 85 | .171 | .278 | 4.1 | -3 | 0.1 | Joe Oliver |
| Mikie Mahtook | .229 | .287 | .389 | 81 | .160 | .288 | 3.9 | 2 | 0.0 | Nick Gorneault |
| Dustin Peterson | .227 | .284 | .355 | 72 | .127 | .287 | 3.5 | 6 | -0.1 | Ken Weislak |
| Kade Scivicque | .228 | .275 | .328 | 63 | .100 | .276 | 3.2 | 0 | -0.2 | Gary Bennett |
| Brandon Dixon | .225 | .271 | .394 | 77 | .169 | .308 | 3.8 | 4 | -0.2 | Pat Rooney |
| Edwin Espinal | .240 | .289 | .344 | 71 | .103 | .282 | 3.5 | 7 | -0.3 | Jeremy West |
| Chad Huffman | .220 | .302 | .388 | 85 | .168 | .269 | 4.1 | -4 | -0.4 | Reed Secrist |
| Bobby Wilson | .190 | .244 | .291 | 44 | .101 | .244 | 2.4 | 1 | -0.4 | Tony Pena |
| Jacob Robson | .226 | .296 | .343 | 73 | .117 | .313 | 3.5 | -5 | -0.5 | Andy Tomberlin |
| Kody Eaves | .199 | .263 | .323 | 58 | .124 | .272 | 2.8 | 4 | -0.5 | Jim Mason |
| Jason Krizan | .237 | .296 | .351 | 75 | .115 | .266 | 3.6 | -7 | -0.5 | Chuck Hiller |
| Dawel Lugo | .250 | .273 | .347 | 67 | .098 | .282 | 3.4 | -1 | -0.6 | Steven Singleton |
| Harold Castro | .242 | .261 | .308 | 54 | .065 | .294 | 2.8 | 6 | -0.7 | Scott Candelaria |
| Pete Kozma | .193 | .240 | .262 | 36 | .069 | .244 | 2.1 | 8 | -0.7 | Ray Oyler |
| Victor Martinez | .251 | .302 | .343 | 75 | .093 | .272 | 3.7 | 0 | -0.7 | Ray Knight |
| Troy Montgomery | .215 | .295 | .304 | 64 | .090 | .288 | 2.9 | -2 | -0.7 | Mark Budzinski |
| Daz Cameron | .221 | .284 | .345 | 70 | .124 | .300 | 3.3 | -5 | -0.8 | Michael Saunders |
| Sergio Alcantara | .228 | .279 | .286 | 54 | .058 | .290 | 2.6 | 2 | -0.8 | Eddy Martinez |
| Cam Gibson | .193 | .262 | .317 | 56 | .124 | .261 | 2.7 | 7 | -0.9 | Duane Singleton |
| Josh Lester | .216 | .273 | .368 | 72 | .152 | .271 | 3.5 | 2 | -0.9 | Kevin Reimer |
| Jarrod Saltalamacchia | .152 | .241 | .281 | 41 | .129 | .230 | 2.2 | -4 | -1.0 | George Mitterwald |
| Victor Reyes | .243 | .272 | .325 | 61 | .082 | .302 | 3.2 | 1 | -1.2 | Nathan Haynes |
| Brady Policelli | .198 | .252 | .318 | 53 | .120 | .255 | 2.5 | -5 | -1.2 | Jon Aceves |
| Derek Hill | .188 | .250 | .264 | 40 | .077 | .278 | 2.2 | 1 | -1.4 | Yuber Rodriguez |
| Daniel Woodrow | .232 | .279 | .294 | 56 | .062 | .304 | 2.7 | 1 | -1.5 | Brent Bish |
| Will Maddox | .235 | .270 | .298 | 54 | .063 | .293 | 2.6 | -6 | -1.9 | Freddie Benavides |
| Player | T | Age | W | L | ERA | G | GS | IP | H | ER | HR | BB | SO |
|---|---|---|---|---|---|---|---|---|---|---|---|---|---|
| Michael Fulmer | R | 26 | 9 | 8 | 4.04 | 26 | 26 | 142.7 | 140 | 64 | 17 | 41 | 113 |
| Matt Boyd | L | 28 | 10 | 10 | 4.47 | 30 | 30 | 159.0 | 160 | 79 | 23 | 50 | 136 |
| Blaine Hardy | L | 32 | 5 | 4 | 3.84 | 42 | 11 | 84.3 | 85 | 36 | 9 | 23 | 66 |
| Daniel Norris | L | 26 | 7 | 6 | 4.40 | 24 | 21 | 106.3 | 108 | 52 | 13 | 45 | 99 |
| Drew VerHagen | R | 28 | 6 | 5 | 4.24 | 47 | 11 | 93.3 | 93 | 44 | 10 | 35 | 76 |
| Joe Jimenez | R | 24 | 5 | 3 | 3.50 | 68 | 0 | 61.7 | 54 | 24 | 5 | 23 | 70 |
| Spencer Turnbull | R | 26 | 7 | 7 | 4.77 | 25 | 24 | 117.0 | 121 | 62 | 13 | 55 | 90 |
| Matt Manning | R | 21 | 7 | 7 | 4.66 | 22 | 22 | 102.3 | 100 | 53 | 10 | 64 | 92 |
| Matt Hall | L | 25 | 6 | 6 | 4.75 | 36 | 17 | 115.7 | 118 | 61 | 14 | 57 | 99 |
| Tyson Ross | R | 32 | 7 | 7 | 4.68 | 25 | 20 | 117.3 | 121 | 61 | 13 | 53 | 88 |
| Jordan Zimmermann | R | 33 | 7 | 8 | 4.83 | 24 | 24 | 126.7 | 142 | 68 | 22 | 29 | 92 |
| Beau Burrows | R | 22 | 8 | 10 | 5.02 | 26 | 26 | 123.7 | 134 | 69 | 17 | 57 | 91 |
| Tyler Alexander | L | 24 | 7 | 8 | 5.07 | 26 | 24 | 138.3 | 169 | 78 | 24 | 24 | 74 |
| Alex Wilson | R | 32 | 3 | 2 | 3.88 | 57 | 0 | 58.0 | 59 | 25 | 6 | 14 | 37 |
| Shane Greene | R | 30 | 5 | 4 | 4.09 | 64 | 0 | 61.7 | 59 | 28 | 7 | 22 | 59 |
| Matt Moore | L | 30 | 7 | 8 | 5.06 | 33 | 19 | 126.3 | 139 | 71 | 19 | 47 | 99 |
| Warwick Saupold | R | 29 | 5 | 5 | 4.79 | 42 | 9 | 88.3 | 99 | 47 | 10 | 36 | 54 |
| Louis Coleman | R | 33 | 3 | 2 | 4.14 | 54 | 0 | 54.3 | 53 | 25 | 5 | 26 | 46 |
| Zac Reininger | R | 26 | 3 | 3 | 4.33 | 55 | 0 | 70.7 | 74 | 34 | 8 | 25 | 53 |
| Zac Houston | R | 24 | 1 | 1 | 4.15 | 44 | 0 | 52.0 | 43 | 24 | 5 | 32 | 62 |
| Gregory Soto | L | 24 | 7 | 8 | 5.18 | 24 | 23 | 104.3 | 106 | 60 | 7 | 85 | 78 |
| John Schreiber | R | 25 | 5 | 4 | 4.19 | 46 | 0 | 53.7 | 53 | 25 | 6 | 20 | 43 |
| Joe Navilhon | R | 25 | 5 | 4 | 4.31 | 35 | 1 | 54.3 | 56 | 26 | 8 | 14 | 46 |
| Anthony Castro | R | 24 | 6 | 8 | 5.21 | 24 | 22 | 112.3 | 126 | 65 | 12 | 61 | 65 |
| Francisco Liriano | L | 35 | 7 | 9 | 5.06 | 26 | 23 | 121.0 | 125 | 68 | 18 | 61 | 102 |
| Alex Faedo | R | 23 | 7 | 8 | 5.23 | 24 | 24 | 108.3 | 127 | 63 | 18 | 40 | 71 |
| Buck Farmer | R | 28 | 4 | 4 | 4.50 | 70 | 1 | 72.0 | 73 | 36 | 9 | 34 | 60 |
| Victor Alcantara | R | 26 | 4 | 4 | 4.56 | 56 | 1 | 75.0 | 79 | 38 | 8 | 33 | 53 |
| Kyle Funkhouser | R | 25 | 4 | 6 | 5.16 | 18 | 18 | 83.7 | 90 | 48 | 12 | 45 | 66 |
| Caleb Thielbar | L | 32 | 4 | 3 | 4.20 | 37 | 0 | 45.0 | 48 | 21 | 5 | 12 | 30 |
| Logan Shore | R | 24 | 4 | 5 | 5.20 | 18 | 18 | 88.3 | 104 | 51 | 15 | 23 | 52 |
| Daniel Stumpf | L | 28 | 3 | 3 | 4.35 | 62 | 0 | 51.7 | 53 | 25 | 7 | 18 | 46 |
| Kevin Comer | R | 26 | 3 | 3 | 4.58 | 47 | 1 | 57.0 | 59 | 29 | 7 | 26 | 48 |
| Reed Garrett | R | 26 | 3 | 3 | 4.50 | 46 | 0 | 50.0 | 52 | 25 | 5 | 24 | 40 |
| A.J. Ladwig | R | 26 | 7 | 10 | 5.43 | 25 | 23 | 126.0 | 158 | 76 | 23 | 24 | 66 |
| Eduardo Jimenez | R | 24 | 3 | 3 | 4.64 | 41 | 0 | 52.3 | 55 | 27 | 5 | 25 | 36 |
| Nick Ramirez | L | 29 | 6 | 7 | 4.66 | 43 | 1 | 65.7 | 71 | 34 | 6 | 33 | 40 |
| Eduardo Paredes | R | 24 | 1 | 1 | 4.76 | 54 | 0 | 64.3 | 67 | 34 | 8 | 28 | 49 |
| Kevin Chapman | L | 31 | 2 | 2 | 4.69 | 35 | 0 | 40.3 | 41 | 21 | 4 | 22 | 35 |
| Franklin Perez | R | 21 | 3 | 4 | 5.37 | 14 | 13 | 53.7 | 61 | 32 | 8 | 25 | 33 |
| Chris S. Smith | R | 30 | 3 | 4 | 4.86 | 44 | 0 | 50.0 | 53 | 27 | 9 | 18 | 44 |
| Johnny Barbato | R | 26 | 2 | 2 | 5.02 | 44 | 2 | 52.0 | 56 | 29 | 8 | 24 | 42 |
| Josh Smoker | L | 30 | 2 | 3 | 4.89 | 53 | 0 | 57.0 | 61 | 31 | 9 | 25 | 51 |
| Jacob Turner | R | 28 | 4 | 6 | 5.38 | 30 | 16 | 102.0 | 119 | 61 | 15 | 42 | 59 |
| Christian Binford | R | 26 | 5 | 7 | 5.62 | 22 | 16 | 107.3 | 132 | 67 | 20 | 28 | 58 |
| Kurt Spomer | R | 29 | 2 | 3 | 5.36 | 38 | 0 | 45.3 | 53 | 27 | 6 | 19 | 22 |
| Paul Voelker | R | 26 | 4 | 5 | 5.52 | 44 | 1 | 58.7 | 65 | 36 | 11 | 25 | 45 |
| Jose Manuel Fernandez | L | 26 | 3 | 4 | 5.52 | 55 | 0 | 62.0 | 64 | 38 | 9 | 40 | 50 |
| Ryan Carpenter | L | 28 | 6 | 9 | 5.73 | 23 | 21 | 113.0 | 135 | 72 | 25 | 31 | 83 |
| Nick Tepesch | R | 30 | 4 | 6 | 6.10 | 21 | 16 | 90.0 | 112 | 61 | 18 | 31 | 41 |
| Phillippe Aumont | R | 30 | 2 | 4 | 6.44 | 26 | 5 | 50.3 | 55 | 36 | 11 | 36 | 43 |
| Spenser Watkins | R | 26 | 6 | 9 | 6.19 | 24 | 17 | 104.7 | 126 | 72 | 20 | 51 | 62 |
| Sandy Baez | R | 25 | 4 | 7 | 6.50 | 34 | 16 | 101.0 | 122 | 73 | 23 | 50 | 67 |
| Player | TBF | K/9 | BB/9 | HR/9 | BABIP | ERA+ | ERA- | FIP | WAR | No. 1 Comp |
|---|---|---|---|---|---|---|---|---|---|---|
| Michael Fulmer | 605 | 7.13 | 2.59 | 1.07 | .288 | 105 | 95 | 4.12 | 2.1 | Chien-Ming Wang |
| Matt Boyd | 683 | 7.70 | 2.83 | 1.30 | .294 | 98 | 102 | 4.41 | 1.9 | Chris Hammond |
| Blaine Hardy | 357 | 7.04 | 2.45 | 0.96 | .296 | 114 | 88 | 3.86 | 1.5 | Lee Guetterman |
| Daniel Norris | 469 | 8.38 | 3.81 | 1.10 | .308 | 100 | 100 | 4.26 | 1.3 | Brandon Claussen |
| Drew VerHagen | 405 | 7.33 | 3.38 | 0.96 | .296 | 103 | 97 | 4.17 | 1.2 | Greg Booker |
| Joe Jimenez | 261 | 10.22 | 3.36 | 0.73 | .306 | 125 | 80 | 3.20 | 1.1 | Josh Wahpepah |
| Spencer Turnbull | 525 | 6.92 | 4.23 | 1.00 | .300 | 92 | 109 | 4.65 | 1.1 | Jaime Cocanower |
| Matt Manning | 471 | 8.09 | 5.63 | 0.88 | .302 | 94 | 106 | 4.70 | 1.1 | Dick Ruthven |
| Matt Hall | 521 | 7.70 | 4.44 | 1.09 | .302 | 92 | 108 | 4.67 | 1.0 | Bryan Clark |
| Tyson Ross | 524 | 6.75 | 4.07 | 1.00 | .298 | 91 | 110 | 4.62 | 0.9 | Ray Moore |
| Jordan Zimmermann | 545 | 6.54 | 2.06 | 1.56 | .302 | 88 | 114 | 4.74 | 0.8 | Mickey Weston |
| Beau Burrows | 559 | 6.62 | 4.15 | 1.24 | .302 | 87 | 115 | 5.02 | 0.8 | Justin Sturge |
| Tyler Alexander | 603 | 4.81 | 1.56 | 1.56 | .306 | 86 | 116 | 5.01 | 0.8 | Bobby Livingston |
| Alex Wilson | 244 | 5.74 | 2.17 | 0.93 | .286 | 113 | 89 | 4.05 | 0.8 | Jim Brosnan |
| Shane Greene | 265 | 8.61 | 3.21 | 1.02 | .299 | 107 | 93 | 3.93 | 0.7 | Chad Paronto |
| Matt Moore | 560 | 7.05 | 3.35 | 1.35 | .308 | 87 | 115 | 4.77 | 0.6 | Jeff Musselman |
| Warwick Saupold | 399 | 5.50 | 3.67 | 1.02 | .304 | 91 | 109 | 4.83 | 0.6 | Ed Klieman |
| Louis Coleman | 242 | 7.62 | 4.31 | 0.83 | .298 | 106 | 95 | 4.31 | 0.5 | Ted Abernathy |
| Zac Reininger | 308 | 6.75 | 3.18 | 1.02 | .300 | 101 | 99 | 4.27 | 0.5 | Jack Cassel |
| Zac Houston | 232 | 10.73 | 5.54 | 0.87 | .295 | 105 | 95 | 4.09 | 0.5 | Brad Voyles |
| Gregory Soto | 503 | 6.73 | 7.33 | 0.60 | .304 | 85 | 118 | 5.17 | 0.5 | Derek Thompson |
| John Schreiber | 233 | 7.21 | 3.35 | 1.01 | .292 | 105 | 96 | 4.29 | 0.5 | Willie Mueller |
| Joe Navilhon | 232 | 7.62 | 2.32 | 1.33 | .298 | 102 | 98 | 4.31 | 0.5 | John Doherty |
| Anthony Castro | 522 | 5.21 | 4.89 | 0.96 | .302 | 84 | 119 | 5.20 | 0.5 | Rick Berg |
| Francisco Liriano | 545 | 7.59 | 4.54 | 1.34 | .298 | 84 | 119 | 5.03 | 0.5 | Tommy Byrne |
| Alex Faedo | 489 | 5.90 | 3.32 | 1.50 | .308 | 84 | 119 | 5.27 | 0.4 | Zach McClellan |
| Buck Farmer | 321 | 7.50 | 4.25 | 1.13 | .298 | 97 | 103 | 4.65 | 0.4 | Joe Hudson |
| Victor Alcantara | 335 | 6.36 | 3.96 | 0.96 | .300 | 96 | 104 | 4.60 | 0.4 | Hal Reniff |
| Kyle Funkhouser | 385 | 7.10 | 4.84 | 1.29 | .304 | 85 | 118 | 5.23 | 0.4 | Rick Berg |
| Caleb Thielbar | 193 | 6.00 | 2.40 | 1.00 | .299 | 104 | 96 | 4.19 | 0.4 | Erasmo Ramirez |
| Logan Shore | 390 | 5.30 | 2.34 | 1.53 | .302 | 84 | 119 | 5.13 | 0.4 | Nate Cornejo |
| Daniel Stumpf | 224 | 8.01 | 3.14 | 1.22 | .305 | 101 | 99 | 4.29 | 0.4 | John Cummings |
| Kevin Comer | 255 | 7.58 | 4.11 | 1.11 | .304 | 96 | 105 | 4.59 | 0.3 | Mike Gardner |
| Reed Garrett | 225 | 7.20 | 4.32 | 0.90 | .307 | 94 | 106 | 4.47 | 0.3 | Joe Hudson |
| A.J. Ladwig | 557 | 4.71 | 1.71 | 1.64 | .310 | 81 | 124 | 5.24 | 0.2 | Heath Totten |
| Eduardo Jimenez | 236 | 6.19 | 4.30 | 0.86 | .299 | 94 | 106 | 4.62 | 0.2 | Gary Ross |
| Nick Ramirez | 300 | 5.48 | 4.52 | 0.82 | .300 | 91 | 110 | 4.81 | 0.2 | Jim Roland |
| Eduardo Paredes | 287 | 6.85 | 3.92 | 1.12 | .298 | 92 | 109 | 4.74 | 0.2 | Joe Davenport |
| Kevin Chapman | 183 | 7.81 | 4.91 | 0.89 | .308 | 93 | 107 | 4.49 | 0.1 | Randy Choate |
| Franklin Perez | 246 | 5.53 | 4.19 | 1.34 | .299 | 82 | 122 | 5.42 | 0.1 | Jesus Silva |
| Chris S. Smith | 220 | 7.92 | 3.24 | 1.62 | .301 | 90 | 111 | 4.99 | 0.1 | Steve Mintz |
| Johnny Barbato | 235 | 7.27 | 4.15 | 1.38 | .304 | 87 | 115 | 5.09 | 0.1 | Casey Daigle |
| Josh Smoker | 256 | 8.05 | 3.95 | 1.42 | .310 | 87 | 115 | 4.89 | 0.0 | Carmen Cali |
| Jacob Turner | 464 | 5.21 | 3.71 | 1.32 | .303 | 79 | 127 | 5.29 | 0.0 | Galen Cisco |
| Christian Binford | 479 | 4.86 | 2.35 | 1.68 | .305 | 78 | 128 | 5.44 | -0.1 | Bill King |
| Kurt Spomer | 207 | 4.37 | 3.77 | 1.19 | .299 | 82 | 122 | 5.36 | -0.2 | Gary Wagner |
| Paul Voelker | 265 | 6.90 | 3.84 | 1.69 | .298 | 79 | 126 | 5.49 | -0.3 | Richie Barker |
| Jose Manuel Fernandez | 288 | 7.26 | 5.81 | 1.31 | .296 | 79 | 126 | 5.50 | -0.4 | Dean Brueggemann |
| Ryan Carpenter | 502 | 6.61 | 2.47 | 1.99 | .308 | 74 | 135 | 5.54 | -0.4 | Scott Downs |
| Nick Tepesch | 410 | 4.10 | 3.10 | 1.80 | .298 | 72 | 139 | 6.04 | -0.5 | Jason Roach |
| Phillippe Aumont | 241 | 7.69 | 6.44 | 1.97 | .297 | 66 | 152 | 6.61 | -0.7 | Chris Hook |
| Spenser Watkins | 489 | 5.33 | 4.39 | 1.72 | .304 | 71 | 141 | 6.11 | -0.7 | Mark Woodyard |
| Sandy Baez | 474 | 5.97 | 4.46 | 2.05 | .303 | 67 | 148 | 6.48 | -1.1 | R.A. Dickey |
Disclaimer: ZiPS projections are computer-based projections of performance. Performances have not been allocated to predicted playing time in the majors — many of the players listed above are unlikely to play in the majors at all in 2019. ZiPS is projecting equivalent production — a .240 ZiPS projection may end up being .280 in AAA or .300 in AA, for example. Whether or not a player will play is one of many non-statistical factors one has to take into account when predicting the future.
Players are listed with their most recent teams, unless I have made a mistake. This is very possible, as a lot of minor-league signings go generally unreported in the offseason.
ZiPS’ projections are based on the American League having a 4.29 ERA and the National League having a 4.15 ERA.
Players who are expected to be out due to injury are still projected. More information is always better than less information, and a computer isn’t the tool that should project the injury status of, for example, a pitcher who has had Tommy John surgery.
Both hitters and pitchers are ranked by projected zWAR — which is to say, WAR values as calculated by me, Dan Szymborski, whose surname is spelled with a z. WAR values might differ slightly from those which appear in full release of ZiPS. Finally, I will advise anyone against — and might karate chop anyone guilty of — merely adding up WAR totals on a depth chart to produce projected team WAR.