One of the fun parts of writing about baseball is the image services. We use Imagn Images, which is owned by USA Today. Like all image services, it licenses pictures taken by professional photographers all over the world to news organizations without their own photographers. That very much includes FanGraphs. We’re not photographers. I’m definitely not a photographer. Here’s the most recent picture I took. It’s a bunch of dusty foam acoustic panels, and I think you’ll agree that the composition is garbage.
Luckily, the image service allows us to use pictures from actual talented photographers. These people take superlative action shots, and then we grab a convenient one for the top of each article. The system works, but it leaves so, so many cool pictures unused. Today, I’d like to highlight one category of pictures that is a particular favorite of mine: Outfielders smushing themselves into the wall as they try to make a leaping catch. As subgenres go, it’s a delight, and so we’re going to honor the best it has to offer. Read the rest of this entry »
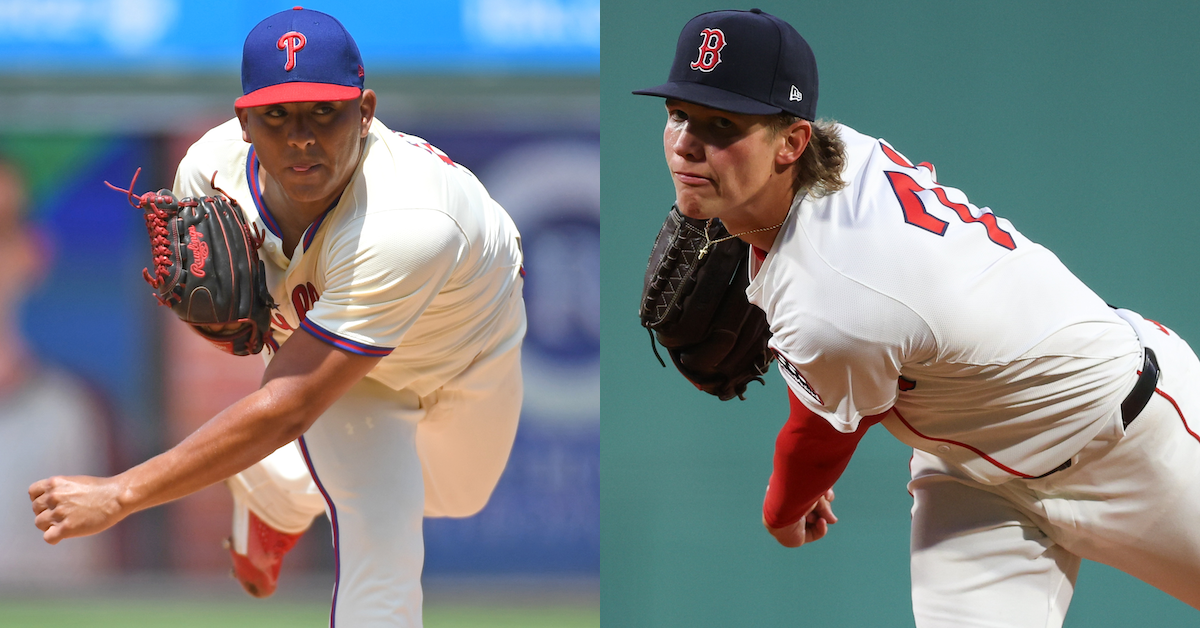
When Eric Longenhagen put together our 2018 Philadelphia Phillies top prospects list, he described southpaw Ranger Suárez as “small but athletic and mechanically efficient, unfurling a sinker/slider combination that has a chance to play at the back of a rotation.” Having yet to pitch above High-A, the 22-year-old Suárez was assigned a 40 FV and a 2020 ETA.
He has gone on to exceed expectations. Not only did Suárez reach the majors earlier than anticipated — July of that same season — he has evolved into a frontline starter. After first establishing himself as a reliever, the Pie de Cuesta, Venezuela native moved into the Phillies rotation in August 2021, and since then, he boasts a 3.39 ERA and a 3.45 FIP over 654 frames. Moreover, he has gone 4-1 with a 1.48 ERA in the postseason, a contributing factor to his desirability in the free agent market. As chronicled by my colleague Davy Andrews, the Red Sox inked Suárez to a five-year, $130-million deal earlier this month.
When Sonny Gray met with the Boston media after being acquired via trade from the St. Louis Cardinals in late November, I asked the veteran right-hander if he feels settled in to who he’ll be going forward, or if he foresees making any changes to his repertoire or pitch usage. I haven’t had an opportunity to ask that question to Suárez, but I did present a version of it to Red Sox chief baseball officer Craig Breslow. Does the organization’s pitching brain trust anticipate suggesting any tweaks, or do they view the 30-year-old lefty as someone who already optimizes his talents? Read the rest of this entry »
I was thinking about Rob Refsnyder recently for two reasons. First, I think about Rob Refsnyder a lot. I try to be professional in this forum, but everyone has their own sports fan nemeses, and Refsnyder is one of mine.
Back in 2012, Refsnyder — then a University of Arizona Wildcat — was the Most Outstanding Player of the College World Series, in part because he went berserk in the two-game final against South Carolina: 4-for-6 with two walks and a home run. He drove in the winning run in Game 1 and scored the winning run in Game 2. My beloved Gamecocks were denied a third straight national championship and haven’t been back to Omaha since. I’ll die mad about this series, and I’ll never forgive Refsnyder in particular.
I did not, however, expect to still be writing about Refsnyder — then a punchy, athletically unremarkable second baseman — in 2026. The previous year’s College World Series MOP, Scott Wingo, was an 11th-round pick; he never came close to making the majors and has spent the past decade as a college assistant coach. (He was most recently in the news in 2024 as the Home Run Derby pitcher for Alec Bohm.) Read the rest of this entry »
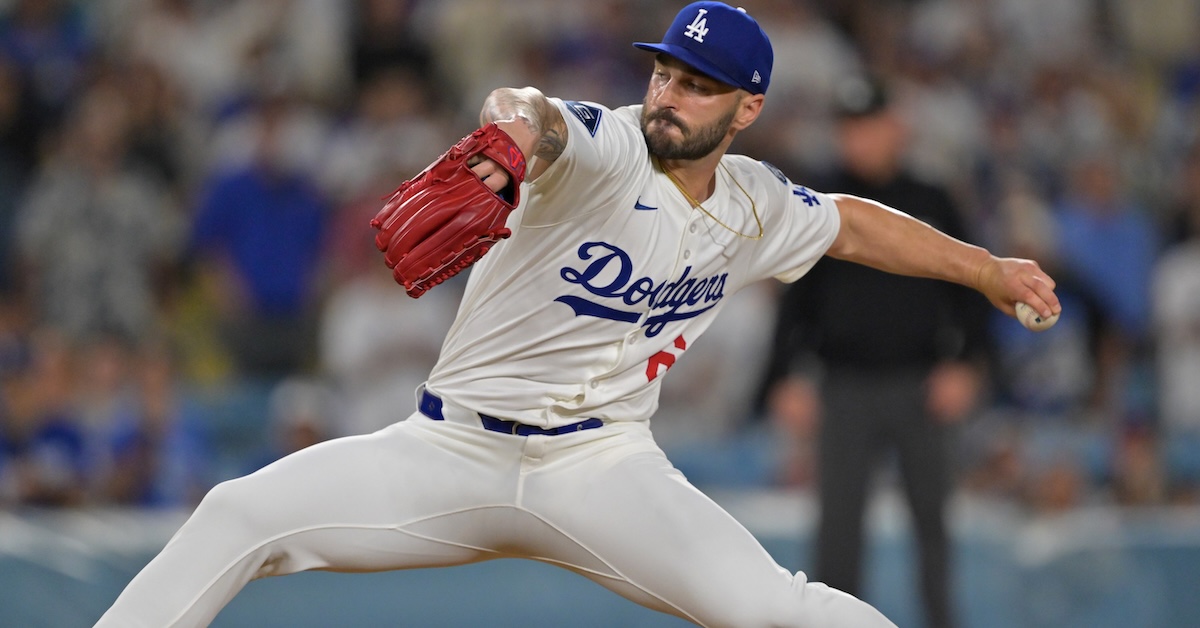
Let’s start with a thought experiment, then we’ll get to the guy in the picture up there. Say you’ve got an unhittable fastball. Every time an opposing batter swings at it, they miss. With such a pitch, you’d want to hit the strike zone every time. Only good things can happen in the strike zone. Either the batter takes and you earn a called strike, or they swing and you earn a swinging strike. Outside the zone, you’d run the risk of throwing a ball because the batter lays off it.
Now, say you’ve got an extremely hittable fastball. Not only does it never generate a whiff, but every time the batter swings at it, they also hit a home run. You’d never want to throw that pitch in the zone. You wouldn’t want to throw it much at all. Maybe you’d use it as a waste pitch to change the batter’s eye level, just every once in a while, and so far outside the zone that they wouldn’t even think about swinging at it. But that’s it.
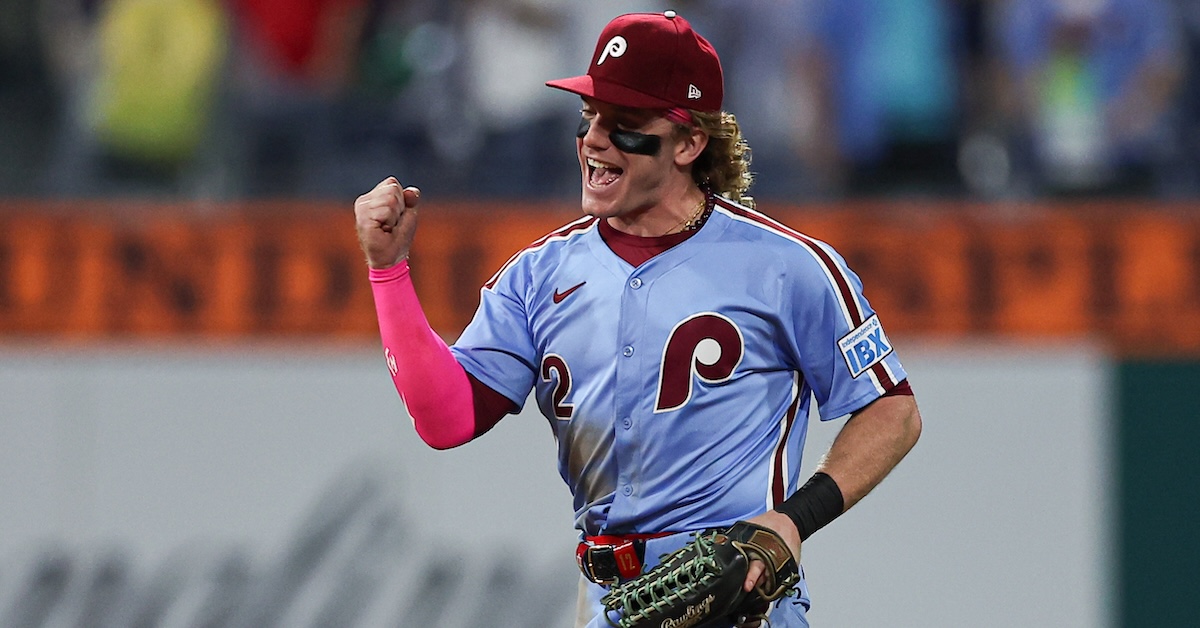
Those are extreme examples, but my point is to introduce the concept of an ideal zone rate. Every pitcher (and every pitch) in baseball lives somewhere between those two extremes. Some pitchers should live in the zone and some should avoid it. All sorts of factors inform that ideal zone rate: how likely the pitch is to earn a whiff, how likely it is to earn a chase, how hard it tends to gets hit, whether it tends to gets hit in the air or on the ground, how it interacts with the rest of your repertoire, how it performs in different locations, how well you’re able to locate it, how confident you feel in it, the count, batter, situation, and so on, and so on.
Lately, the calculus has shifted somewhat. The zone rate has been rising because pitchers have been instructed to aim down the middle and trust in their stuff. In 2024, 49.6% of all pitches were in the strike zone and 26.5% were specifically in the heart zone (the area at least one baseball’s width from the edge of the zone). Both of those numbers were the highest rates we’d seen since the start of the pitch tracking era in 2008, and both of those numbers were surpassed in 2025, when for the first time ever, more pitches hit the strike zone than missed it. Across baseball, the ideal zone rate has increased.
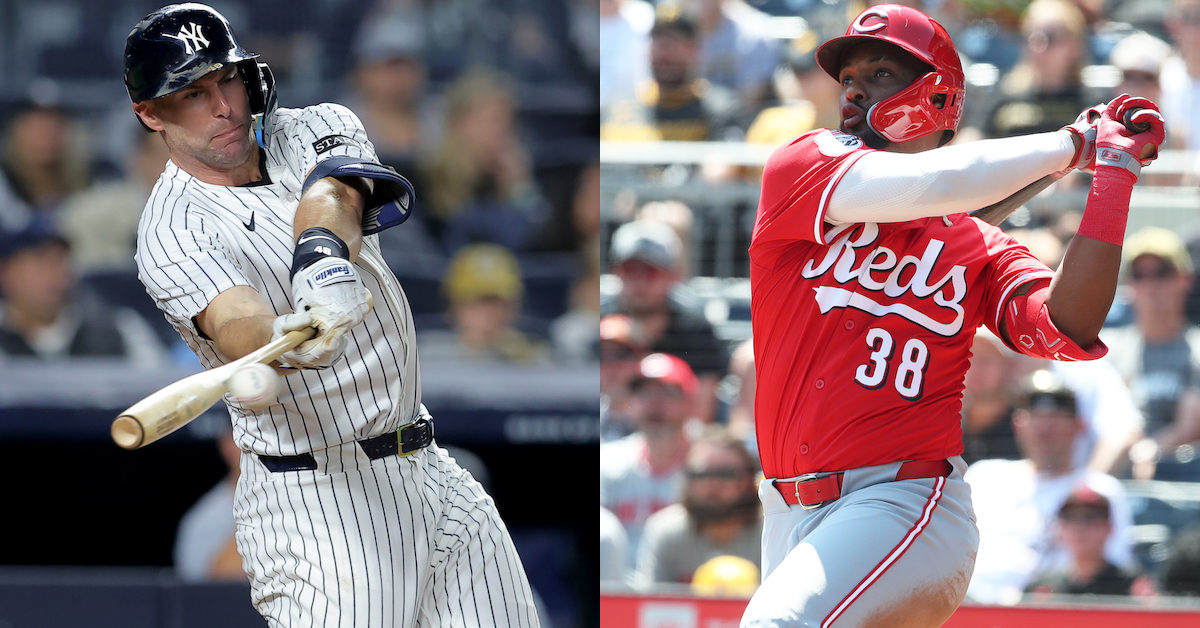
The San Francisco Giants, with their unique front office leadership and unconventional manager, have gone the traditional route. “Acquire Harrison Bader” is a tried-and-true team-building strategy for a would-be contender; the former Florida Gator is on his way to his seventh organization in the past four-and-a-half years.
The Giants, unlike Bader’s previous employers, seem interested in keeping him around long enough to unpack all his furniture: Bader’s new contract is for two years and $20.5 million.
Regardless of any analysis to follow, this move makes the Giants stronger in 2026. Bader is a legitimate center fielder who’ll relieve the defensive pressure on the freshly emancipatedJung Hoo Lee (who’s stretched in center) and Heliot Ramos (who’s stretched at any position that requires him to wield a glove). Guys who can play center field comfortably and have a clue at the plate are harder to find than you’d think — especially in free agency — and the Giants got one. Read the rest of this entry »
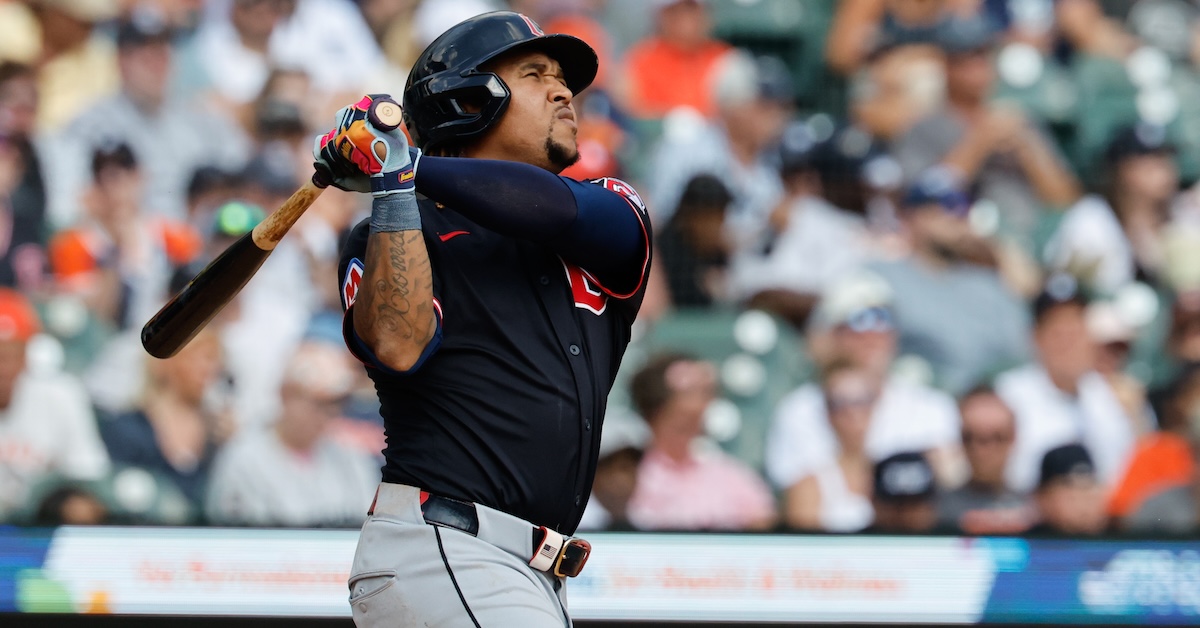
One day, José Ramírez will get old. One day, he’ll dodder out to the grass in front of the pitcher’s mound on the arm of an adorable grandchild and lollipop the ball into the dirt in front of home plate to the warm cheers of the Cleveland faithful. That’s sure to happen at some indeterminate point in the future. This weekend, however, the Guardians expressed their belief that Ramírez’s inevitable decline is a long way off, inking the 33-year-old future Hall of Famer to a seven-year contract extension that will keep him in the fold through the 2032 season. When the extension expires, Ramírez will be 40.
We’ll break down all the numbers and the dollars, but the biggest story here is the most obvious one. This is great news for anybody who loves Ramírez, the Guardians, or baseball. Ramírez has full no-trade rights, and there’s every reason to expect him to stay for the rest of his career. It’s time to talk about statues and plaques and how nice it is that we’ll never have to know just how wrong it would feel to see him in a jersey that doesn’t say Cleveland on it. This is the third extension Ramírez has signed. The first came in 2016, and it bought out his arbitration years plus two option years. The second came in 2022, and, like this one, it bought out the final three years of the previous extension. Ramírez wanted to stay in Cleveland, and with those first two extensions, he forfeited tens of millions of dollars on the open market to do so.
This extension is slightly more complicated, and the details matter quite a bit. Ramírez was already signed though the 2028 season as part of the previous seven-year extension, so it’s not as if there was a pressing need to get this done. He was owed $69 million over the next three years. This deal reworks his compensation over that period and adds four more years. Over the next seven seasons, Ramírez will earn $25 million per year, with $10 million per year deferred. (Each of those deferrals lasts 10 years, and then pays out $1 million per year for 10 years. So he’ll get $1 million in 2036, $2 million in 2037, and so on until he gets his final $1 million payment in 2051.) The deal also came with perks like increased bonuses for awards and high finishes in the MVP voting, an extra hotel room on road trips, and use of a private jet to and from the All-Star Game plus one extra time per year. Read the rest of this entry »
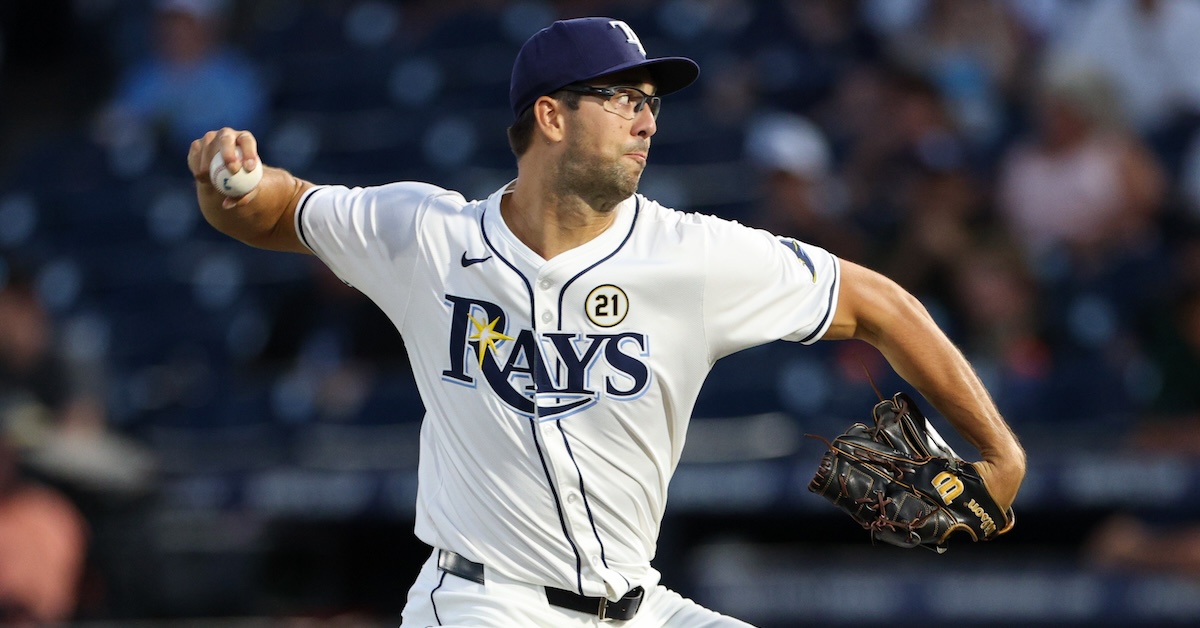
Joe Boyle is emerging as a late-bloomer success story. Now 26 years old, the Tampa Bay Rays right-hander is coming off a campaign during which he not only continued to display a power arsenal, but began to rein in his command as well. Over 86 innings with Triple-A Durham, Boyle paired a 32.9% strikeout rate with an 11.8% walk rate; across 52 innings with the big league club, those numbers were 25.7% and 12.4%. While admittedly far from George Kirby-esque, those free-pass percentages were nonetheless a meaningful step in the right direction.
Boyle’s relationship with the strike zone has long been tenuous. In May 2024, Eric Longenhagen wrote that while “Boyle has had huge stuff for his entire life as a prospect, [he has] also been very wild.” Fast forward to December of that same year, and our lead prospect analyst again cited the nastiness of the 6-foot-8, 250-pound hurler’s offerings, adding a caveat that he has “zero feel for location.”
Something else that Longenhagen wrote 13 months ago bears noting:
“It’s possible that the Rays will attempt to do with Boyle what they successfully accomplished with Tyler Glasnow: Simplify his delivery to make it more consistent and hope it’s enough for him to be a five-inning starter.”
Currently projected as the Rays’ fifth starter by RosterResource, Boyle is now with his third organization. Selected in the fifth round of the 2020 draft by the Cincinnati Reds out of the University of Notre Dame, he was subsequently swapped to the Oakland Athletics in 2023, and then to Tampa Bay the following winter. It is understandable that the pitching-savvy Rays were, and remain, enamored with his potential. While Boyle’s success at the major league level has been spotty — his ERA last season was 4.67 — his comps stick out like a sore thumb. Baseball Savant’s list of the pitchers most similar to Boyle based on velocity and movement comprises Chase Burns, Jacob deGrom, Dylan Cease, Hunter Greene, and Bubba Chandler. Read the rest of this entry »
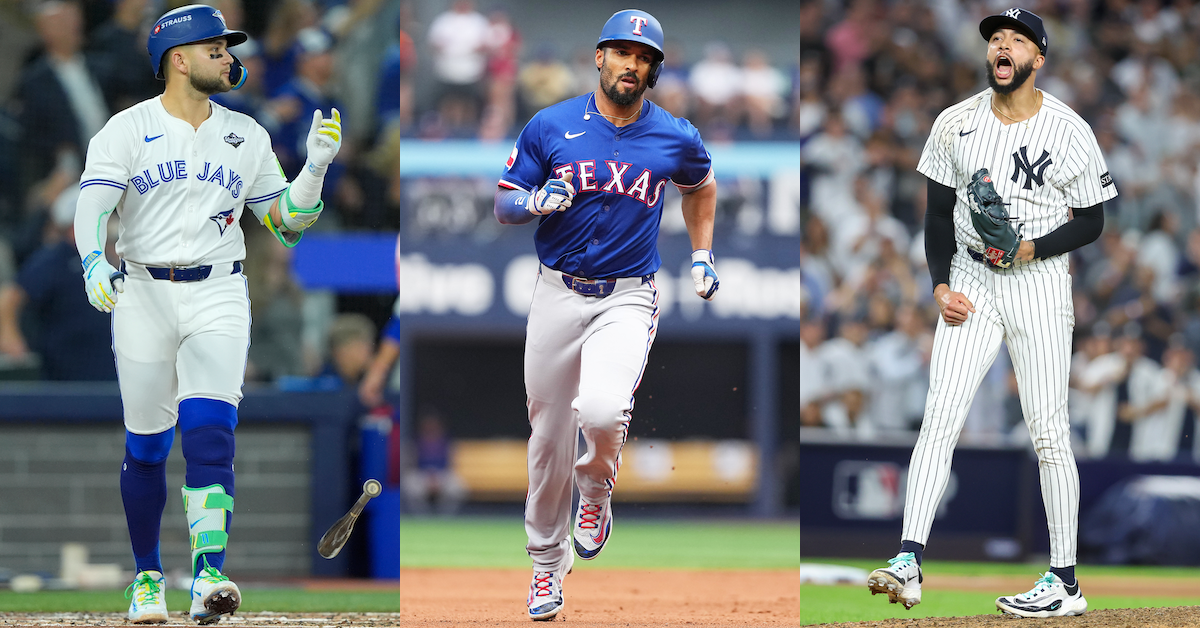
John E. Sokolowski, Nick Turchiaro, Wendell Cruz-Imagn Images
You already know how it works: January is for signings, trades, and articles that grade those signings and trades. Everything gets a letter, every transaction has a winner and loser, and positive thinkers like me hand out thumbs up left and right. I’ve rarely seen a signing I didn’t like. I think that most trades help out both sides. What about the aggregate effect of all the signings and trades, though? Which teams play the offseason game the best or the worst? Looking at the Mets this winter got me thinking.
How should we evaluate a front office, particularly in the offseason when we don’t have games to look at? I’ve never been able to arrive at a single framework. That’s only logical. If there were one simple tool we could use to evaluate the sport, baseball wouldn’t be as interesting to us as it is. The metrics we use to evaluate teams, and even players, are mere abstractions. The goal of baseball – winning games, or winning the World Series in a broad sense – can be achieved in a ton of different ways. We measure a select few of those in most of our attempts at estimating value, or at figuring out who “won” or “lost” a given transaction. So today, I thought I’d try something a little bit different.
Instead of a single number, I’m going to evaluate the decisions that David Stearns and the Mets made this winter on three axes. The first is what I’m calling Coherence of Strategy. If you make a win-now trade but then head into the season with a gaping hole in your roster, that’s not coherent. If you trade a star for teenage prospects and then extend a 33-year-old, that’s not coherent. Real-world examples are never that simple, but you get the idea. Some spread in decisions is inevitable, but good teams don’t work against themselves more than they have to.
Next, Liquidity and Optionality. One thing we know for sure about baseball is that the future rarely looks the way we expect it to in the present. Preserving an ability to change directions based on new information is important. Why do teams treat players with no options remaining so callously? It’s because that lack of optionality really stings. Why do teams prefer high-dollar, short-term contracts over lengthy pacts in general? It’s because you don’t know how good that guy is going to be in year six, and you certainly don’t know how good your team will be or whether you’ll have another player for the same position. All else equal, decisions that reduce future optionality are bad because they limit a team’s ability to make the right move in the future.
Finally, maximizing the Championship Probability Distribution. We like to talk about teams as chasing wins, but that’s not exactly what’s going on. Teams are chasing the likelihood of winning a World Series, or some close proxy of that. That’s often correlated to wins, but it’s not exactly the same. Building a team that outperforms opponents on the strength of its 15th-26th best players being far superior to their counterparts might help in the dog days of August, when everyone’s playing their depth pieces and cobbling together a rotation, but that won’t fly in October. Likewise, high-variance players with decent backup options don’t show up as overly valuable in a point estimate of WAR, but they absolutely matter. Teams are both trying to get to the playoffs as often as possible and perform as well as they can after arriving there. That’s not an easy thing to quantify, but we can at least give it a shot.
Let’s begin with a look at the transactions that reshaped the lineup. The biggest of these has to be the infield turnover, with Pete Alonso out and Bo Bichette, Jorge Polanco, and Marcus Semien in. Since we’re including Semien, we’ll have to include the departure of outfielder Brandon Nimmo as well. These decisions are clearly coherent; Alonso’s leaving meant space in the infield and an offensive deficit, and the Mets signed multiple free agents to account for that. I’ll analyze the Coherence of Strategy axis at the end of this write-up, but for each individual deal, I’ll focus on the other two axes of analysis. Read the rest of this entry »
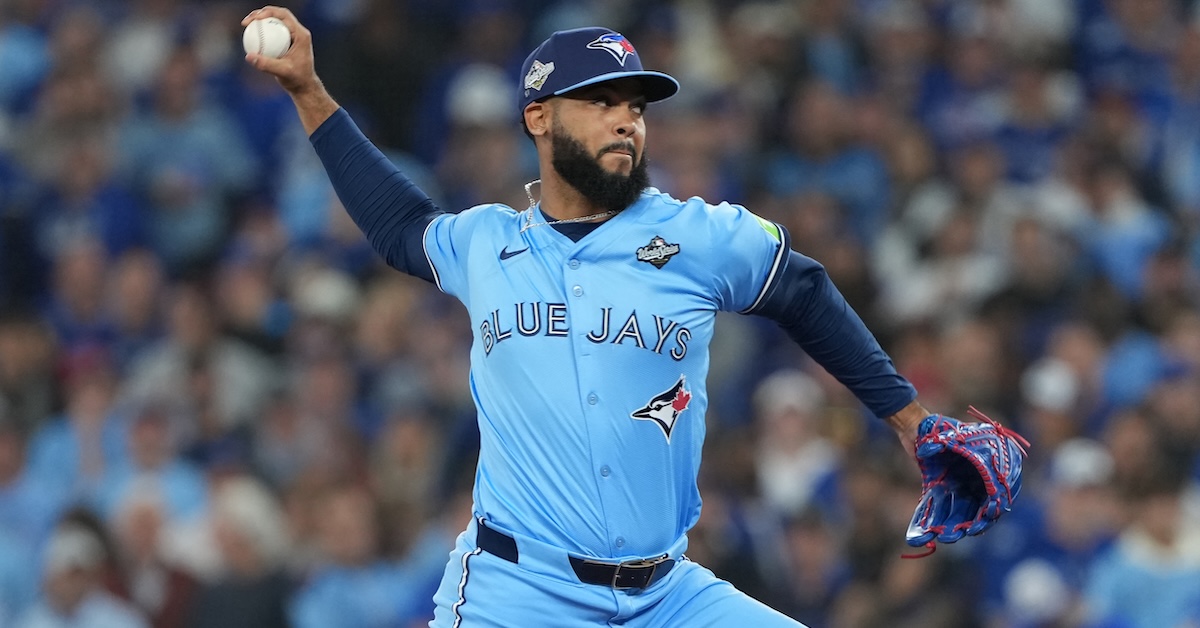
Last week, the White Sox admitted defeat in their handling of Luis Robert Jr.’s contract, shipping him out to the Mets for two lottery tickets and salary relief. That salary relief must have been burning a hole in their pocket, though. Or perhaps someone looked at their books, said “Guys, we play in Chicago but we’re projected for the lowest payroll in baseball and people are going to talk,” and handed GM Chris Getz a list of players who hadn’t yet signed. In any case, Seranthony Domínguez and the White Sox have agreed to terms on a two-year deal worth $20 million, as ESPN’s Jeff Passan first reported.
The right-handed Domínguez is no stranger to high-pressure relief work. In both the 2022 and 2023 postseasons, he appeared in mid- and high-leverage situations for the Phillies, and he handled them quite well (1.13 ERA, 0.78 FIP in 16 innings). In 2024, Philadelphia didn’t have much use for his services after his slow start, and so they sent him and Cristian Pache to the Orioles for platoon bat Austin Hays (whom they promptly non-tendered after the season). The O’s employed Domínguez for a year (he made two appearances for them in the playoffs), then dealt him and cash to the Blue Jays in exchange for Juaron Watts-Brown, a 40-FV relief prospect. He pitched for the Jays in October, and memorably had some ups and downs in their long run.
In other words, playoff teams have been employing Domínguez for years, but they haven’t been placing particularly high importance on his performance. He’s twice been traded to contenders in deadline deals, and at no point did his suitors offer much to get him. Those teams considered him a mid-leverage option; even the Blue Jays had him as a second-tier option out of their weak-link bullpen that flailed its way through October. Read the rest of this entry »
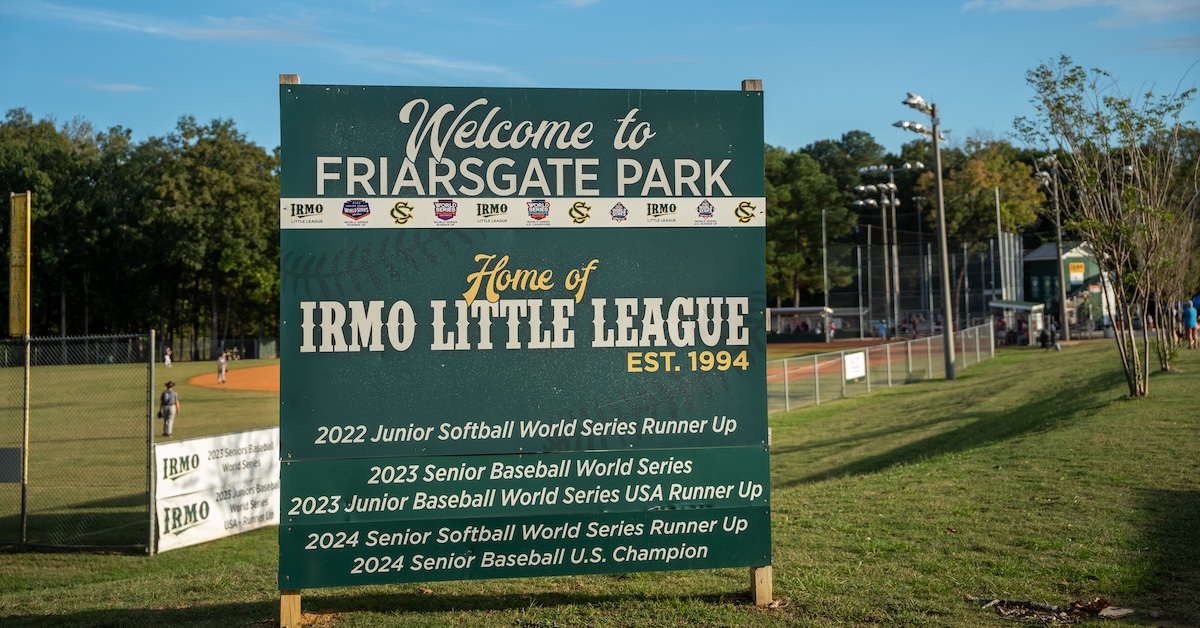
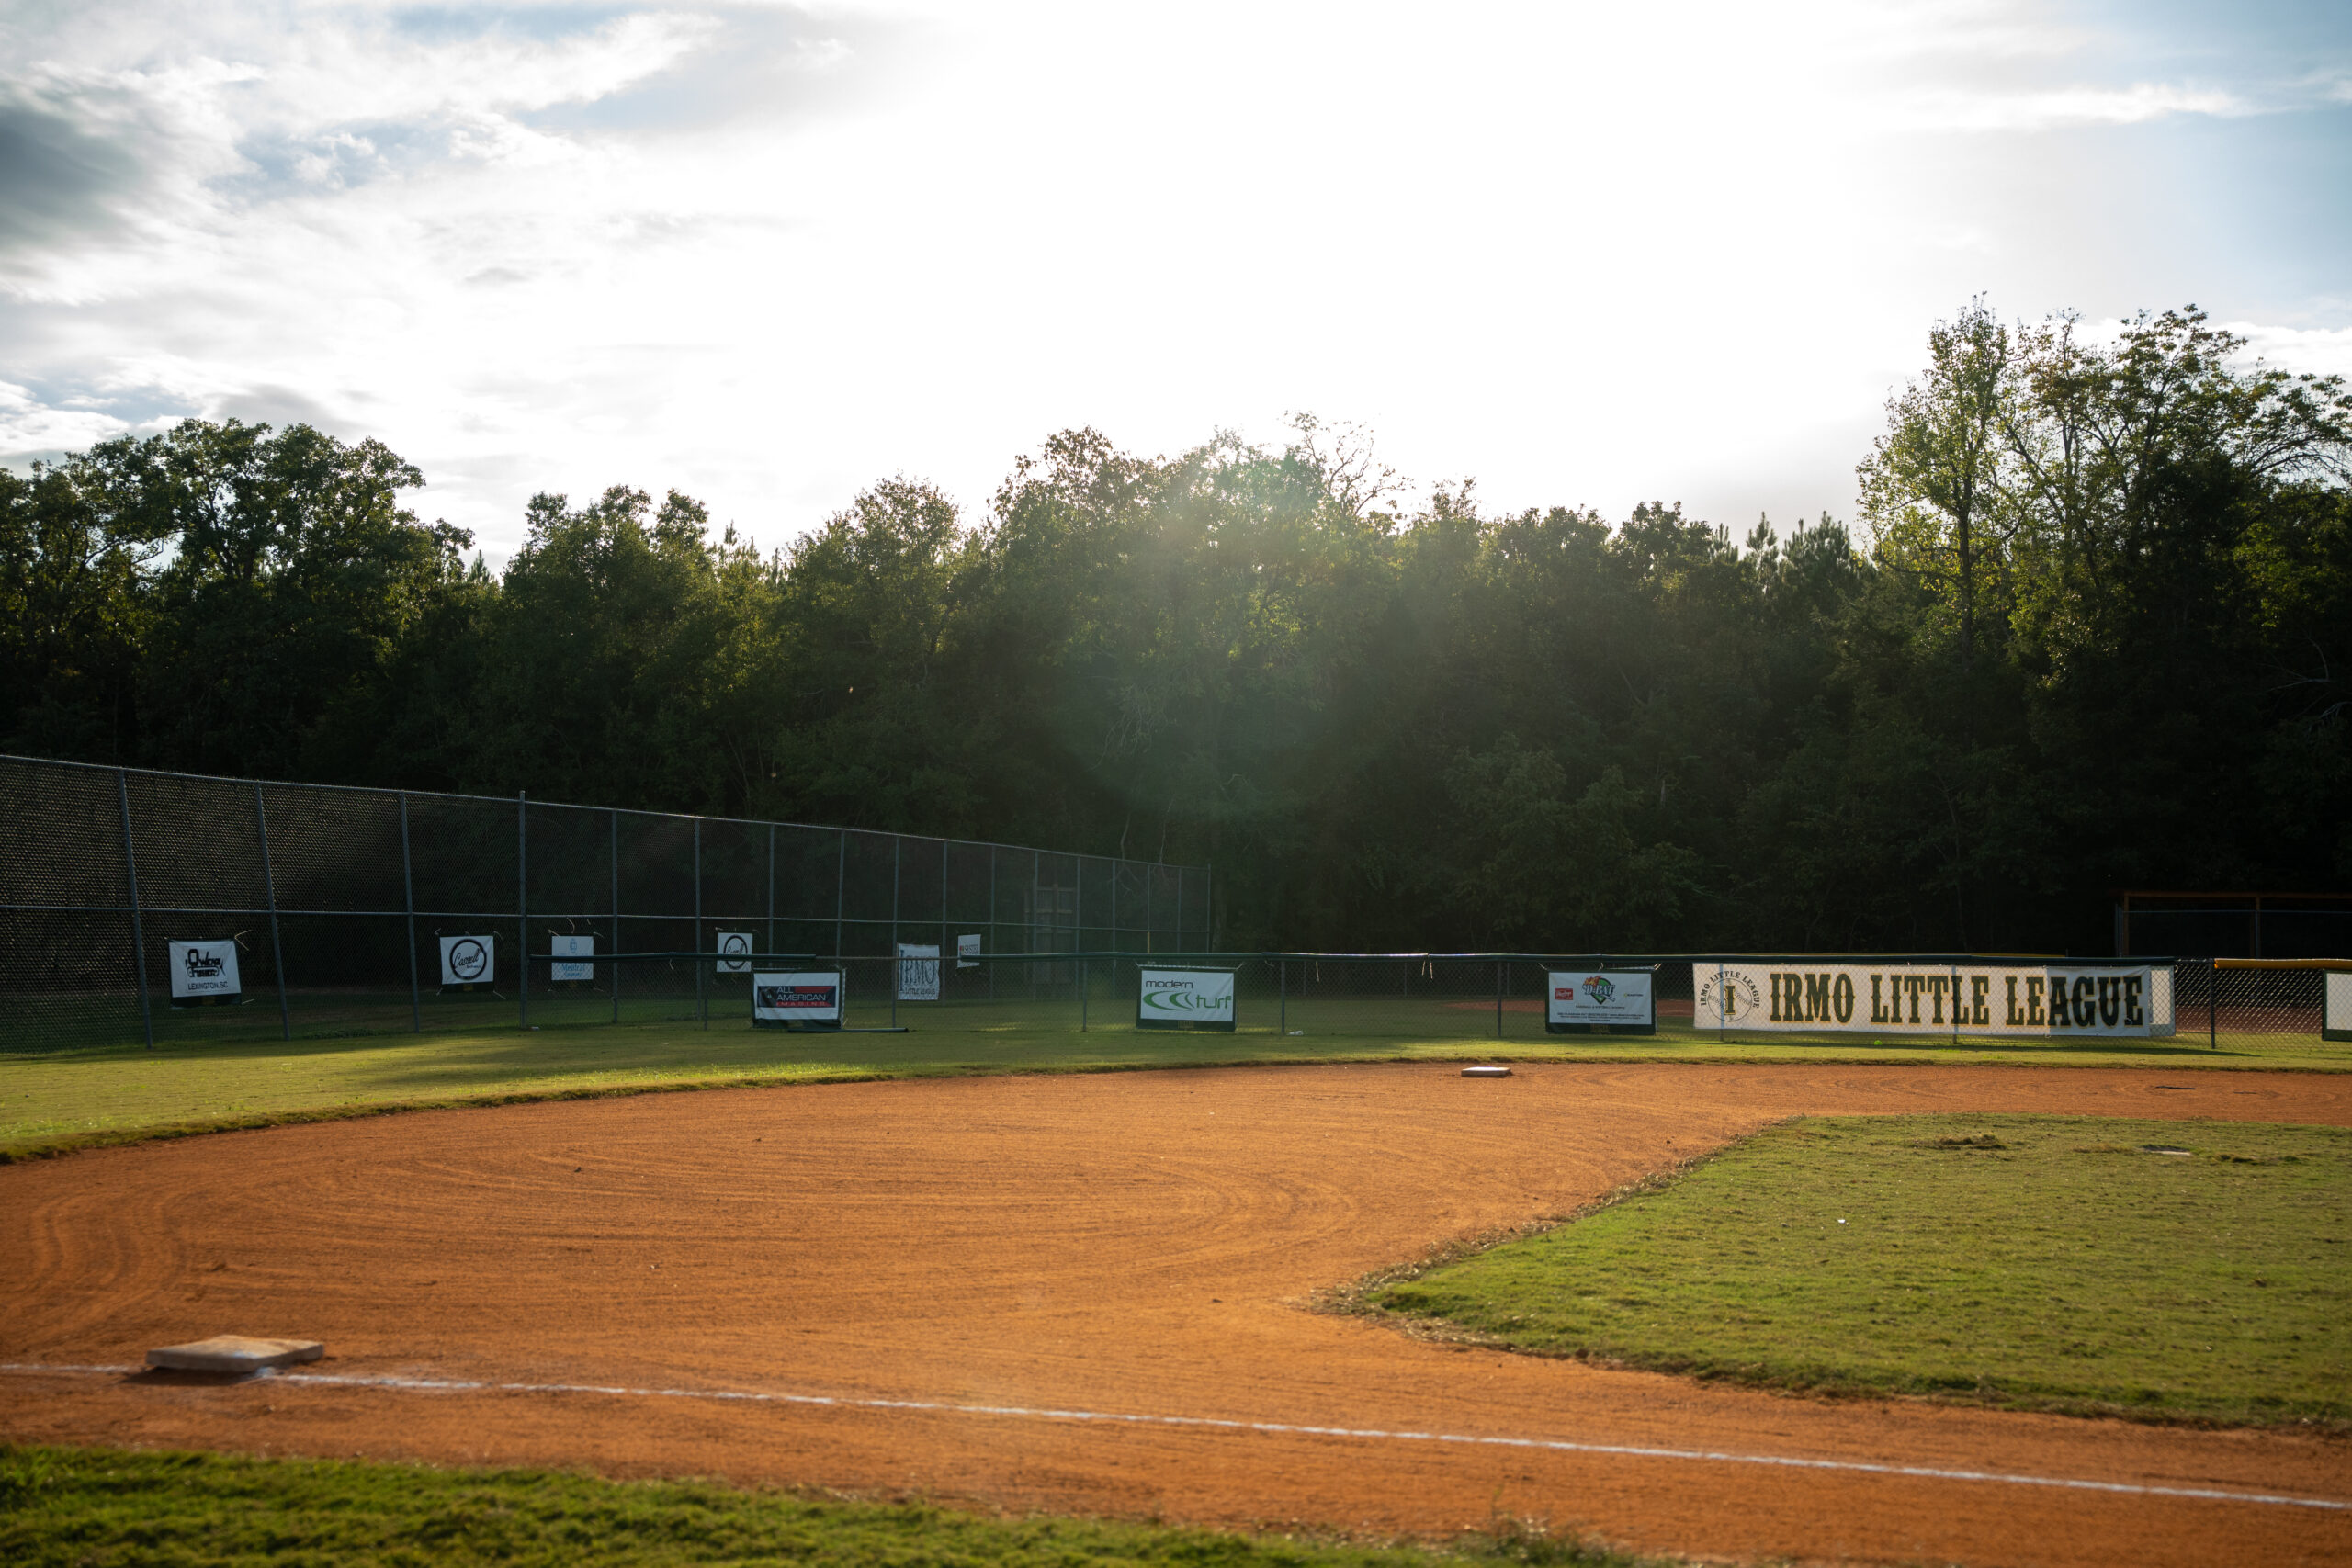
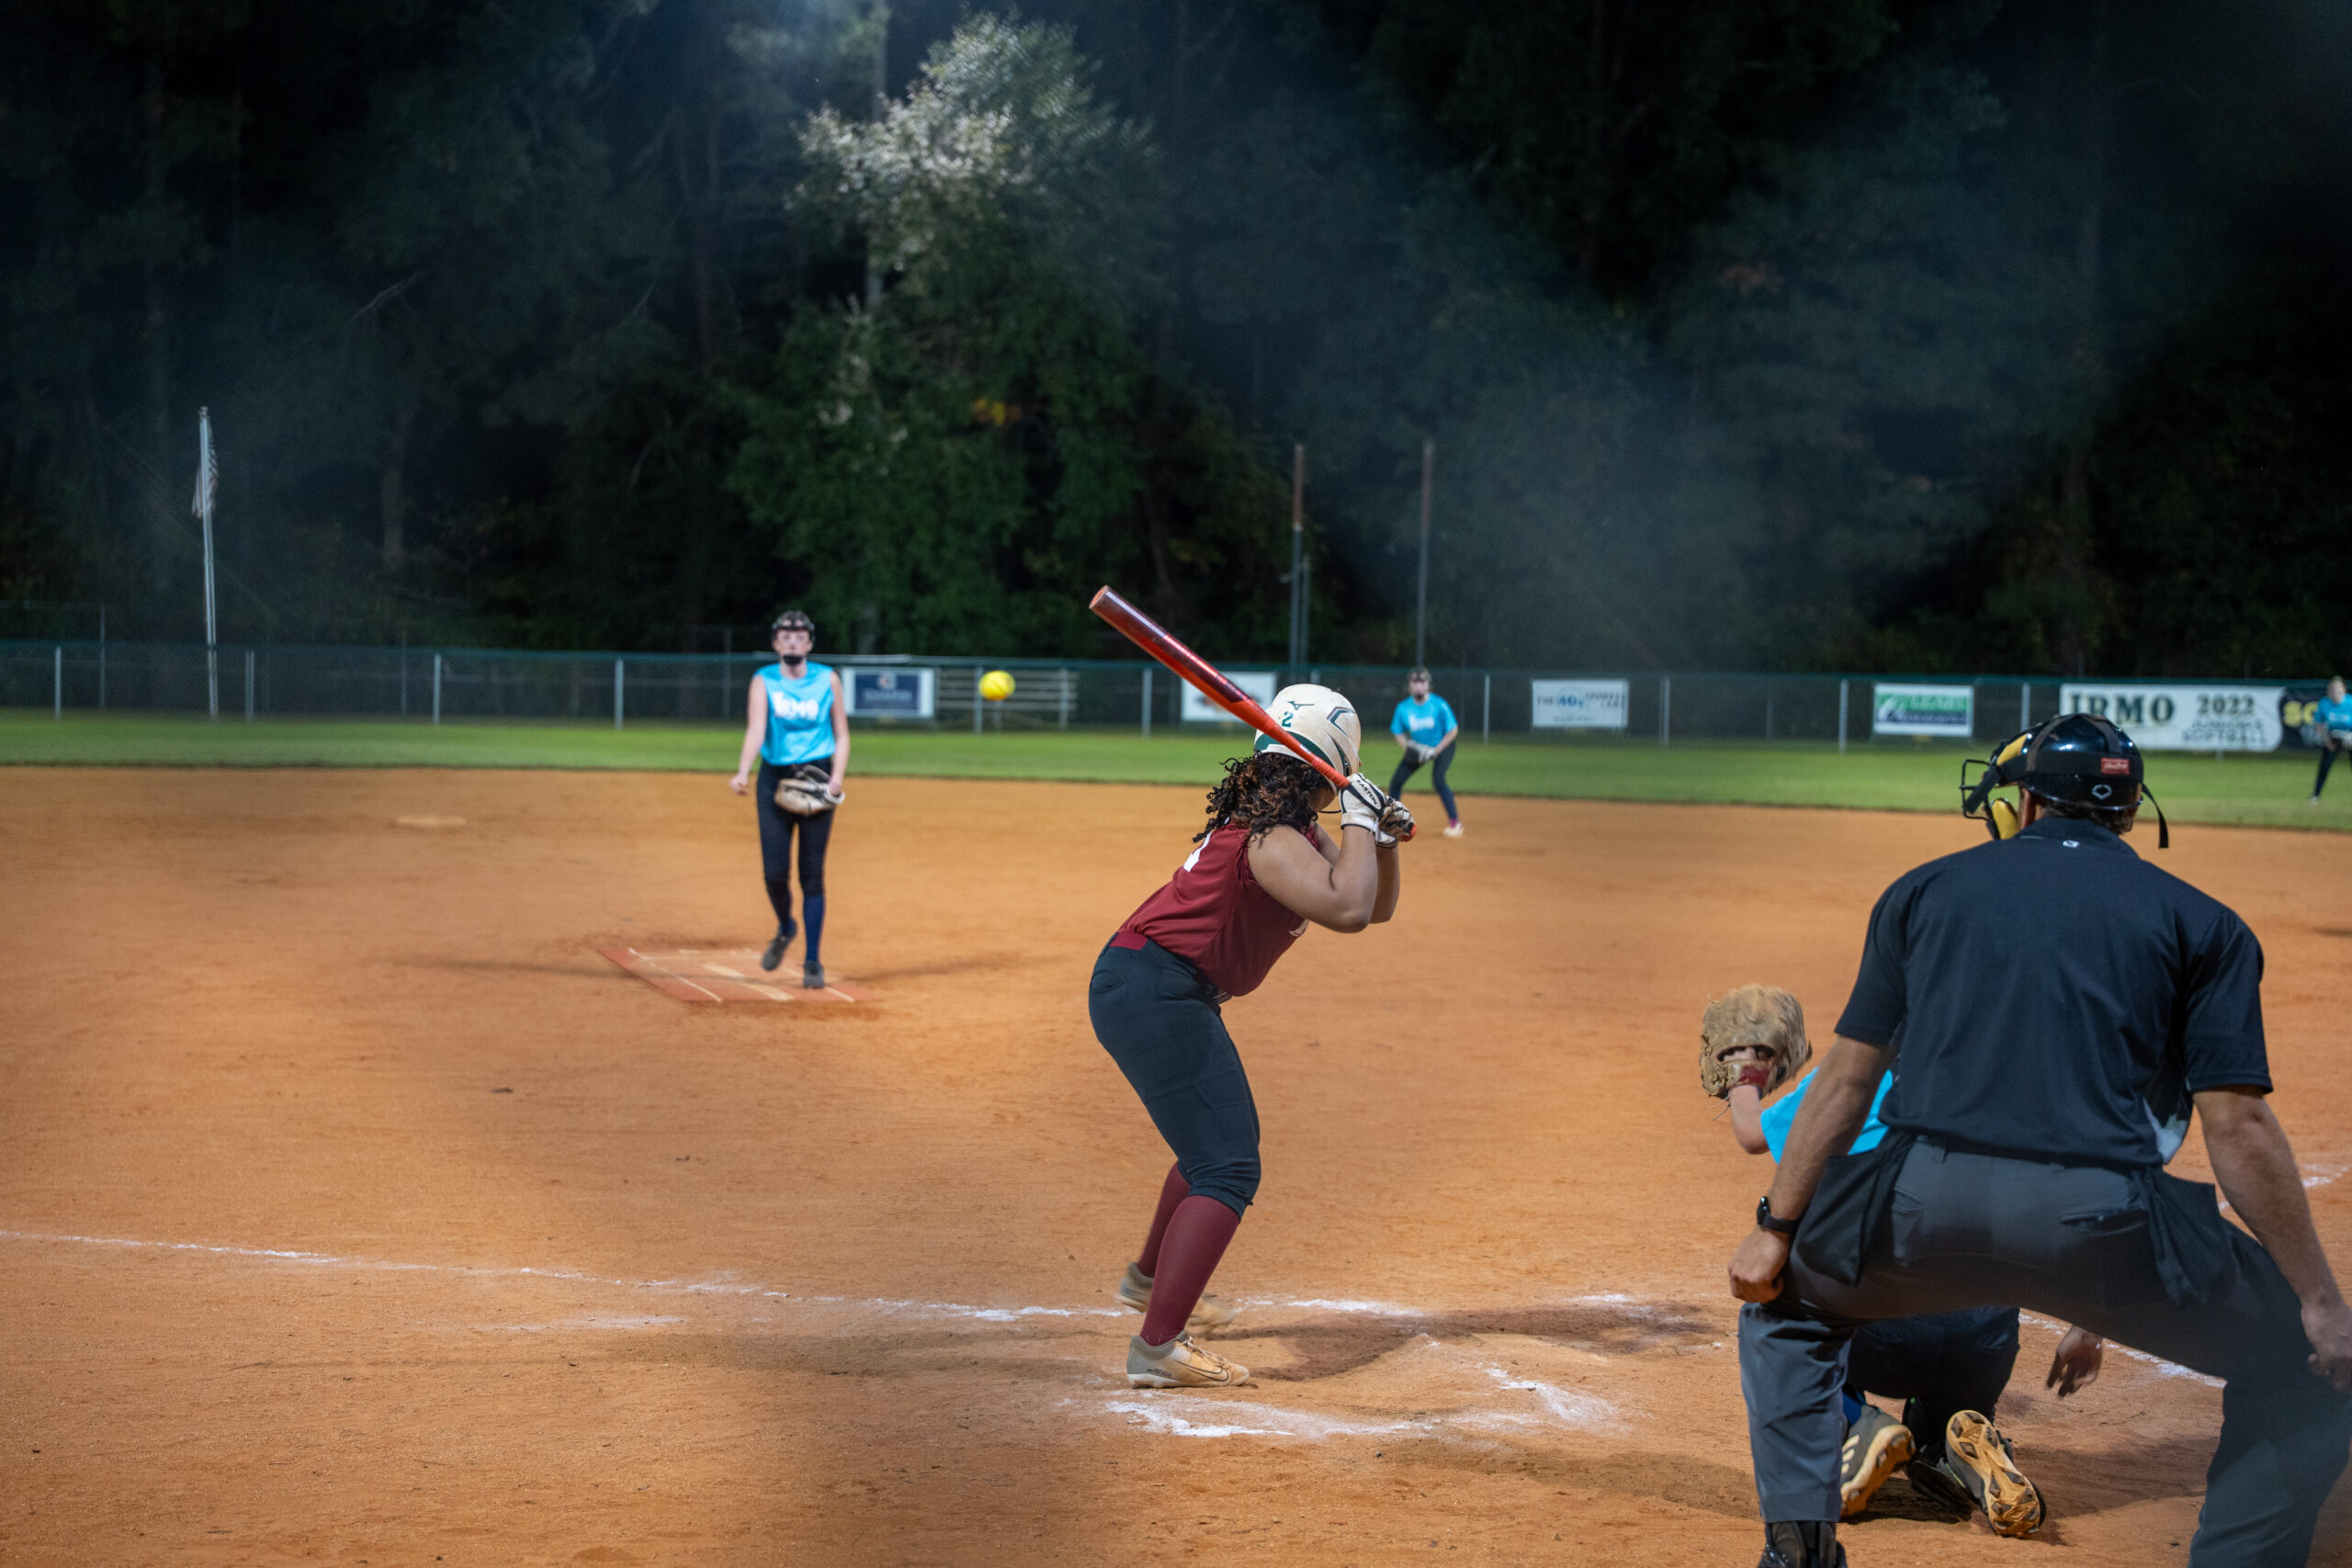
IRMO, S.C. — At Friarsgate Park, there’s never enough parking. Whenever there’s a baseball game, the lot gets full and drivers find spots on the grass next to the sidewalk. Eventually, the parking lot over at the elementary school fills, too.
It’s only a week night, but there’s so much commotion — and this isn’t for a tournament, just fall baseball games.
“It’s the old ‘Field of Dreams,’” said Bobby Jenson, Little League president. “If you build it, they will come. If you build the right atmosphere, people will come because, if it’s 60, 70 degrees and you’re just relaxed and you’re getting peanuts or popcorn or sunflower seeds, and just watching a game of baseball — it’s just no better place I’d rather be.”
This is Irmo, South Carolina, the most baseball a baseball town can be.
Irmo is so baseball that last year it sent not one, not two, not three, but four teams in different divisions to the Little League World Series — baseball teams of up to 12-, 13- and 16-year-old boys, along with a girls softball team. Little League has seven divisions, each of which holds a national tournament of top teams every year, the World Series. Do the math: One community sent clubs to more than half the national competitions.
Irmo is so baseball that championship jerseys hang in local restaurants as relics of pride with signatures of the ball players, who are treated as local celebrities.
Irmo is so baseball that even though the South Carolina Golf Association is just a few miles down the road from the ball fields, there isn’t even a golf course in town. It closed several years ago.
It’s hard to find someone not connected to Irmo Little League.
“I’ve lived in North and South Carolina my whole life and baseball is very important here,” said Matt Westbrooks, a Little League parent. “We’re shocked that we don’t have a major league team yet. And I will tell you, Irmo Little League is doing it right. If you’re not involved, you need to be involved. It’s a great place to have your kids. It’s a great place to learn about baseball.”
One of the six fields at Friarsgate Park, home of Irmo Little League (Photo by Amanda Vogt)
Classic Southern
Irmo is 20 minutes away from Columbia and is full of Southern charm. Local businesses coexist with typical chain restaurants and retail stores, and with the South Carolina Gamecocks competing close by, there’s an SEC rooting interest.
Lake Murray is just to the west of town and has 650 miles of shoreline. The Big Bass Tour hosts tournaments on the lake each fall and spring that draw people to Irmo. But there’s always plenty of folks fishing. Some of the players often trade in bats for fishing rods.
Irmo is home to the annual Okra Strut, a two-day festival with a parade that was started by the Lake Murray-Irmo women’s club 50 years ago. Initially, the goal was to fundraise money to build a new library, but that only took seven years.
It still remains the town’s most cherished celebration, but the Williamsport team of up to 12-year-olds couldn’t attend the strut this year — the Atlanta Braves were hosting the little leaguers for their game against the Pittsburgh Pirates.
Where The Magic Happens
Irmo Little League has been around for a while, and baseball has been considered America’s favorite pastime for a lot longer, so why is it just now that Irmo is so good?
One reason is facilities. At Friarsgate, there are four large fields, three for baseball and one for softball. Right at the park’s entrance, there are two smaller fields for t-ball.
The fall season for Irmo Little League is dedicated to teaching young players the game and developing skills. Scores aren’t kept, the outfield boards remain off, and coaches interrupt the game action for pivotal teaching moments. But in the spring, kids are playing to make an All-Star team with the chance to make a Little League championship bracket and coaches want the chance to make the trip North, too.
Registration for the spring starts in December and ends in the middle of January. In February, players are evaluated and the regular season teams are formed, practices begin and games run for seven weeks starting in early March.
At 9 a.m. on opening day there’s a parade — it’s a town spectacle. All teams take the field that day and Jensen said 5,000 people normally attend.
“Oh my gosh, it was like if Norman Rockwell was here today, like what he would create for a town celebration,” said Jill Giulietti, mother of one of Irmo’s star sluggers. “It was so charming.”
The fences surrounding each field and the press box structures behind home plate are covered in banners of previous Irmo Little League teams that won state championships or reached a Little League World Series. The sign from 2009 sits next to more recent champions. It might be old, but the cracks in it are an important reminder of how much Irmo Little League has grown.
The fields didn’t always have lights, they didn’t always have scoreboards, there wasn’t always a paved walkway providing better accessibility to the fields. It took commitment from the community and investing to get here.
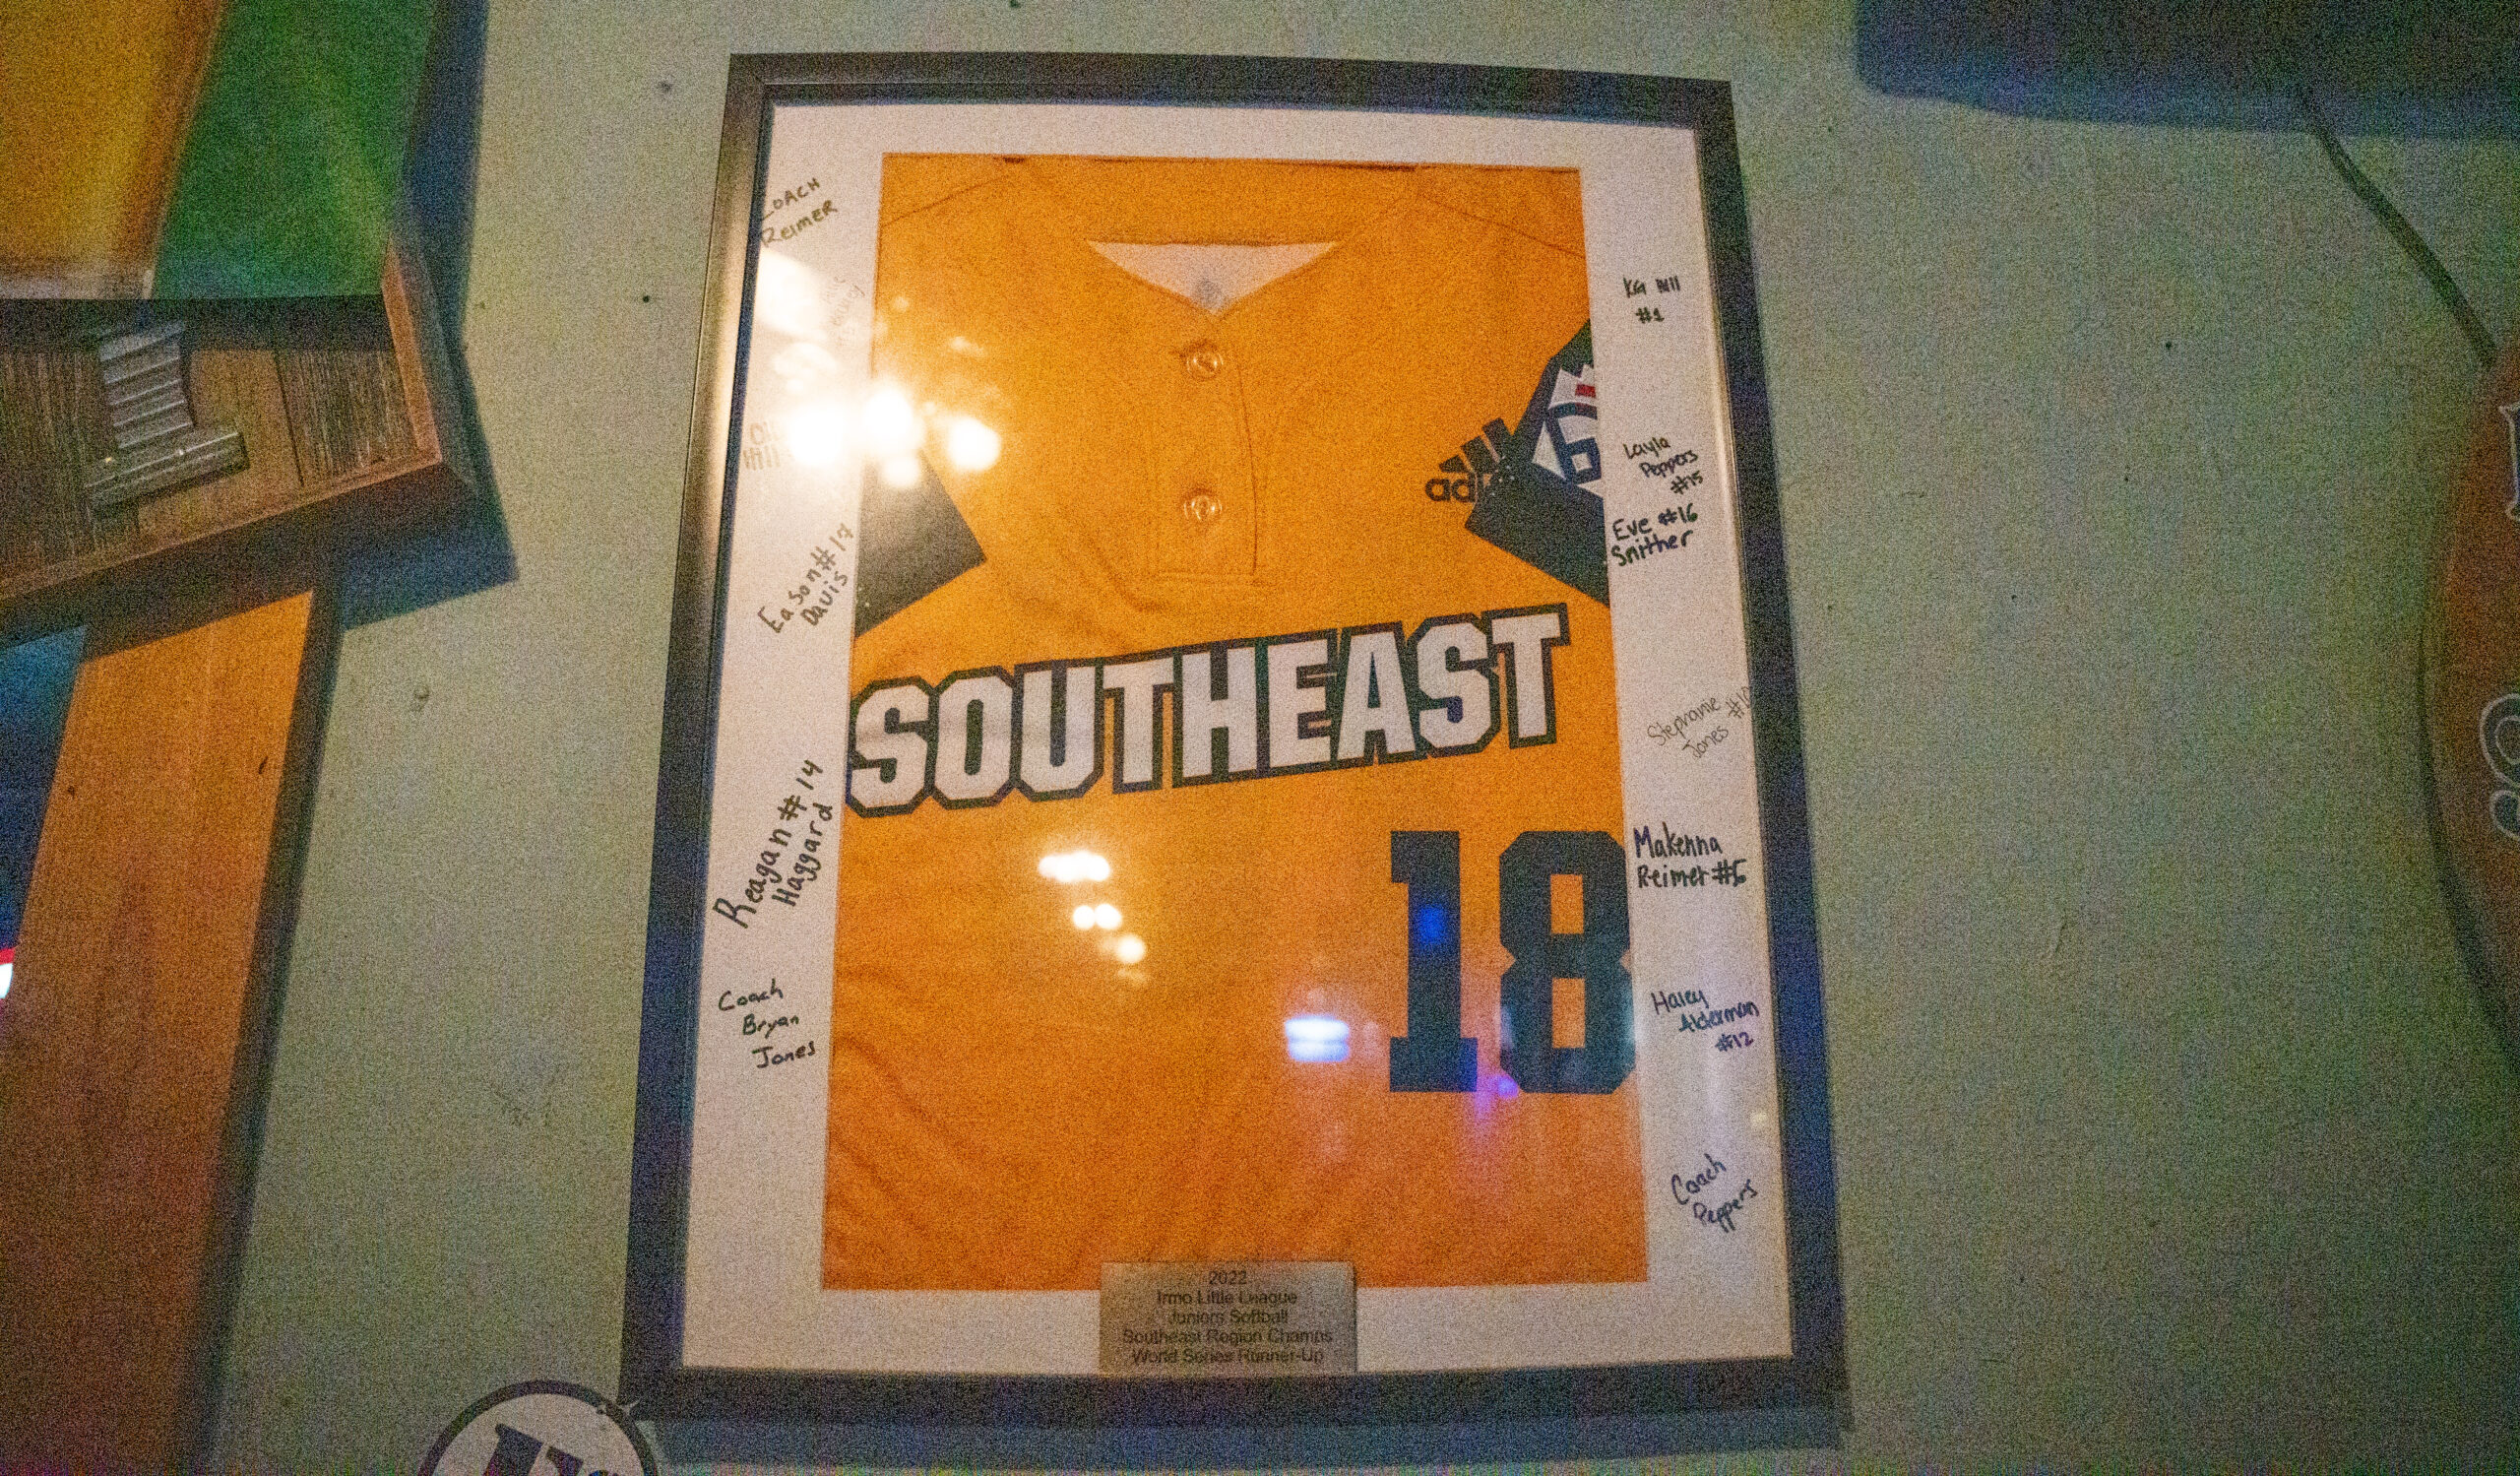
Baseball may have come first, but softball is what put Irmo Little League on the map. In 2022, the juniors team made it to the World Series in Seattle and came in second. Their Southeast jersey is framed at Lucky’s Burger Shack — it’s the place everyone flocks to when Irmo teams play in the World Series. The lineups are always posted and the regulars enjoy knowing who to root for each night.
“You don’t necessarily have to be family to be supportive of each other,” restaurant manager Kim Laniere said. “Everybody becomes aunts and uncles and brothers and sisters, you know, they all adopt whoever the kids are.”
A Southeast jersey autographed by the 2022 Irmo team that made it to the Junior League Softball World Series hangs inside Lucky’s Burger Shack. (Photo by Amanda Vogt)
The Grind
Irmo is the first local Little League to send four teams to their respective World Series in one season and it sent two teams in 2023 and 2024. But it’s not so simple to make that final tournament.
“It’s very hard, and for these players and families, there’s a lot of commitment that they make,” Jenson said.
Once All-Star teams are announced at the end of the spring regular season, practices begin and they’re intense. This year’s team that went to Williamsport practiced in the evenings three to four nights a week, starting at 7 p.m. to try and avoid the heat of the day. Practices were slotted for an hour and a half but it wasn’t unusual if they ran late and the crew shut down Friarsgate.
Manager Dave Bogan prepared his players intentionally and vigorously — they worked hard. His son, Andrew, was on the team, and his oldest, Jake who also played up through Irmo Little League, now goes to Dutch Fork High School.
“They got some of the high schoolers to come down and pitch to us, like throwing 70, 75, fastball, curveball, like all the pitches to get us ready for what we’re gonna face,” said Joe Giulietti, pitcher and third baseman.
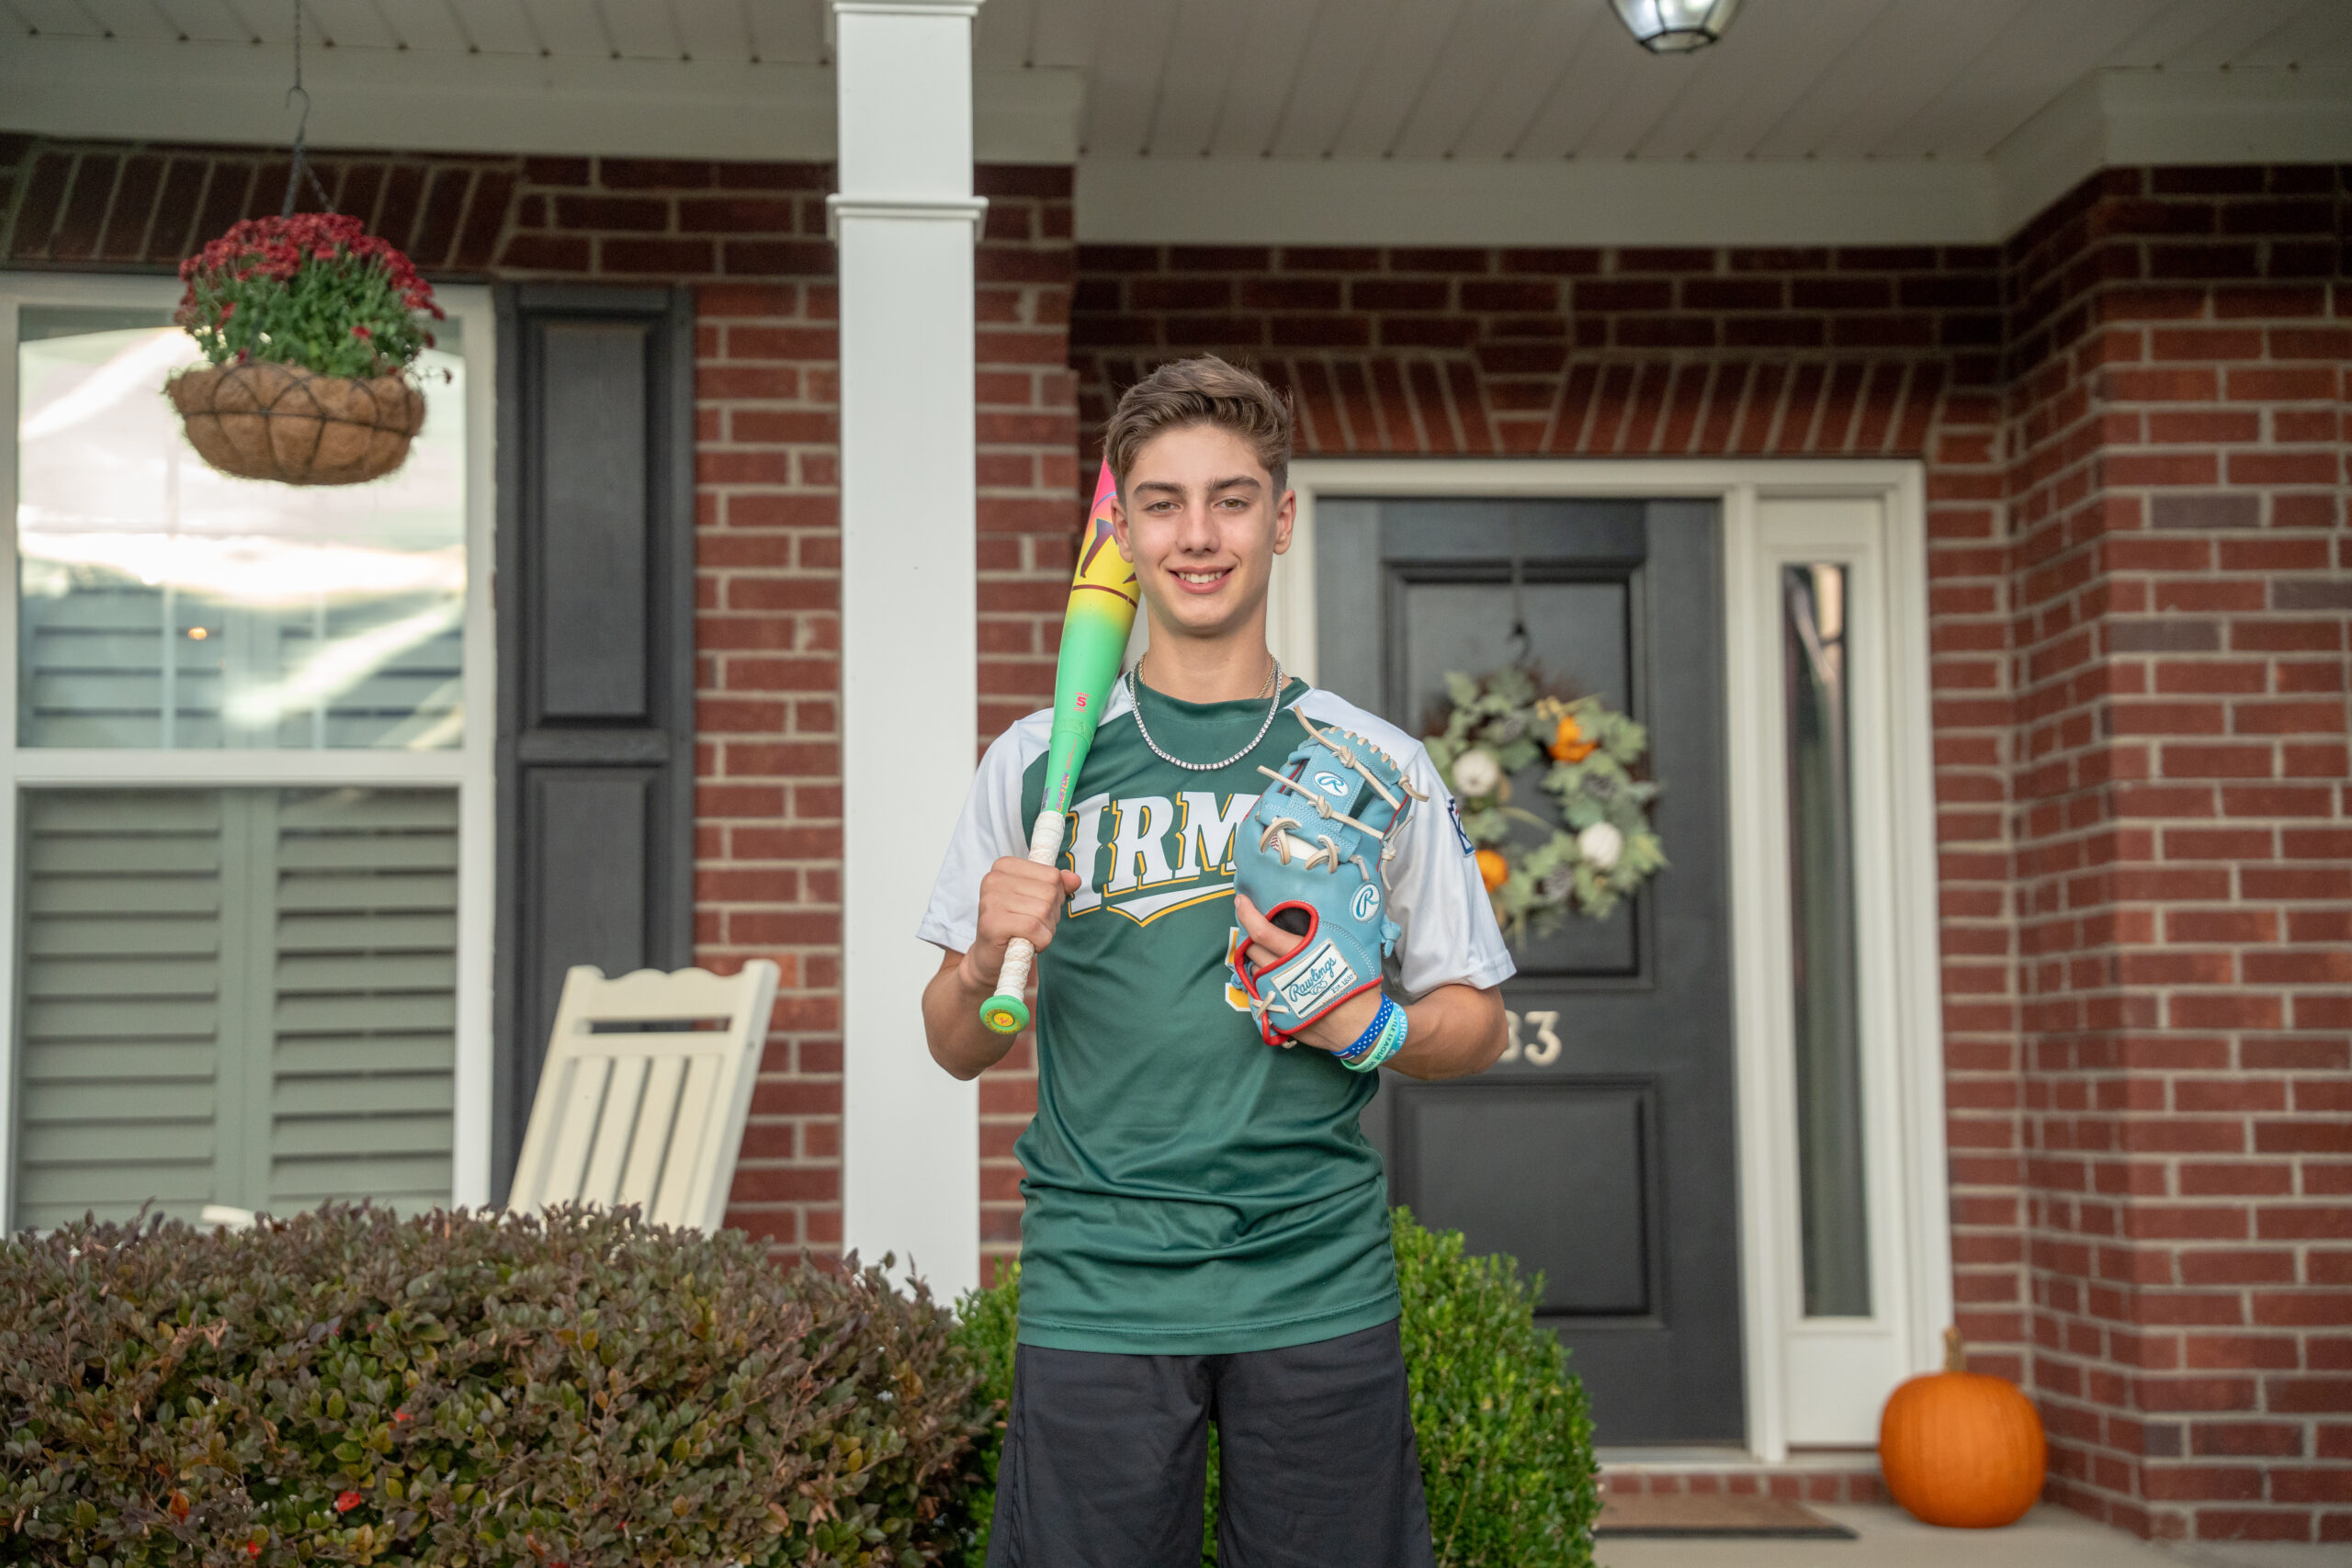
Joe was one of Irmo’s most powerful hitters and he’s not bad on the mound either. He hit a grand slam during Irmo’s first game in Williamsport and his younger sister teased him that it wasn’t even off the barrel. At Friarsgate, during the home run derby last year, he even broke a scoreboard.
“If you run cross county, which is the three-mile race, you’re gonna go out and you’re gonna train for eight or nine miles,” Bogan said. “If I can get a high school kid that’s going to throw 75 to 80, which is really fast for these boys, when we see someone throwing 60-70, they’re ready.”
Bogan had to switch fields for practice so he wouldn’t lose as many baseballs in the trees beyond the fence.
“Practice was always hard and they made it hard on purpose to face difficult moments so it would look easy and make it easy,” said Brady Westbrooks, who smacked the walk-off hit in the regional tournament that earned Irmo its trip to Williamsport.
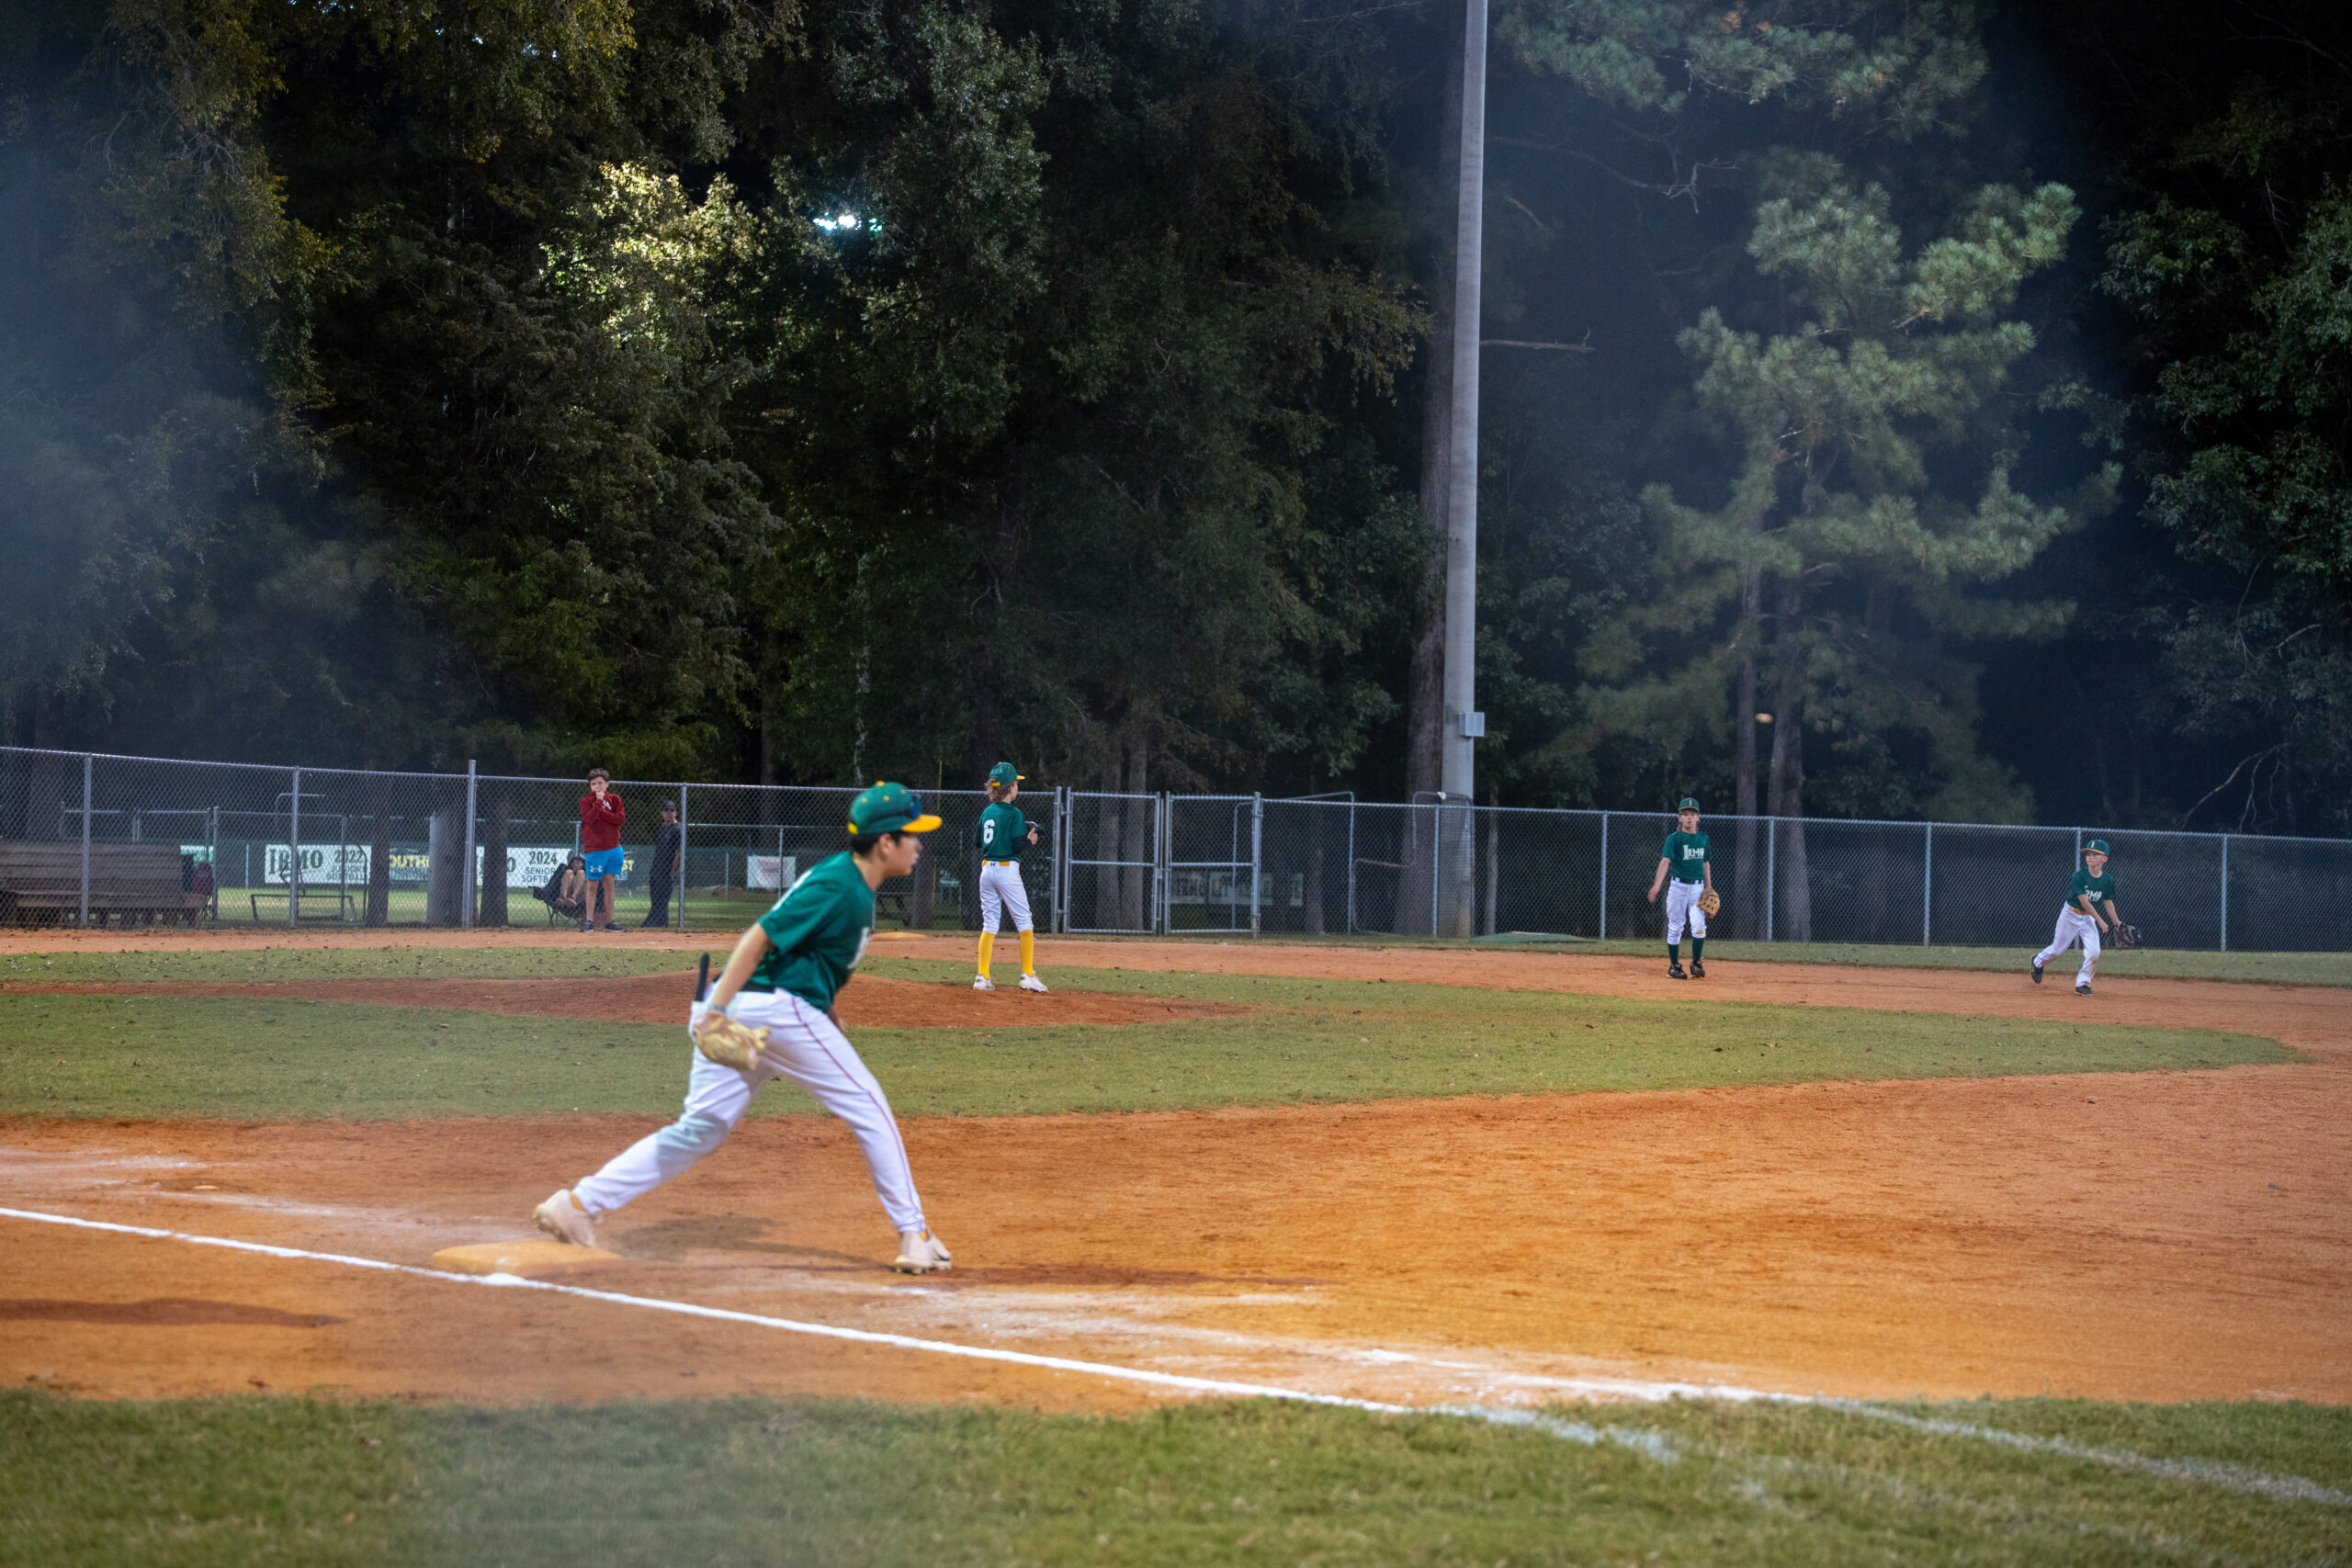
Irmo Little League in action (Photo by Amanda Vogt)
What Makes Irmo Different?
If you’re a parent and you have a son or daughter who wants to play ball, you basically have two choices: rec or travel ball.
Recreational baseball programs such as Little League don’t always have a great reputation because they aren’t necessarily recognized as competitive as travel ball. Even the Giuliettis were skeptical.
Before arriving in Irmo because of a career move, they lived in Texas. There, Joe seemed to out-grow Little League ball. He always had a strong arm. In Williamsport, Joe never gave up a hit.
“The coaches (in Texas) were trying to teach him to either roll it or to throw a rainbow,” Jill Giulietti said. That was because they worried Joe would “take someone’s face off.” So, to put Joe in a more competitive baseball environment, the Giuliettis turned to travel ball.
That’s where they believed the best players had the best opportunities. They had no idea Irmo was such a baseball haven.
While the popularity of travel ball has skyrocketed, Irmo Little League hasn’t been affected because of the program’s commitment to letting travel and rec play coexist. The two sometimes conflict in scheduling.
Before Jenson was league president, Justun Baxter held the position for eight years and he bought into travel ball rather than trying to work separately from it.
“Justun got them involved with our concession stand and stuff like that, to where you can make a little extra money to help your travel ball team expenses,” Jenson said about Baxter’s approach. “That got travel ball players to come back (for Little League).”
Joe Giuliette of Irmo Little League (Photo by Amanda Vogt)
Irmo Little League refrains from having its games on the weekend because that’s when travel tournaments are typically held. Now when those tournaments use Friarsgate fields, all concession sales go back to Irmo Little League. Jensen and other volunteers are typically outside of the concession stand under a tent working the grill all afternoon.
While Irmo Little League prevents travel teams from staying together — players get divided among all teams in their age group — it ultimately makes the spring regular season games more competitive.
“They get to play against each other, pitching against each other, hitting against each other, it brings back that excitement to the travel ball players,” Jensen said. “You get the better players in your zip codes and success can happen.”
Because of its recent success, Irmo Little League is expecting to have close to 1,000 kids playing baseball and softball in the spring. This fall, a record 43 teams (nearly 500 kids) played, which is nearly double the amount of participation compared with when Jensen first got involved 15 years ago.
And for a sport like softball, the popularity and excitement are only continuing to grow.
Sarah Minchew coached her daughter, Ainsley, in the junior softball Little League World Series last summer. Sarah grew up playing the game, but Ainsley was a dancer before becoming a lights-out pitcher. Sarah sees a drastic difference in the sport’s popularity because of the exposure collegiate softball now receives.
“The diamond sports, to me, are some of the most difficult games because you have to be really athletic, but you also have to be really skilled,” Sarah said. “You can’t just get by with athleticism, you have to really commit yourself to being a good skilled player too, so it’s unique in that regard, but I think girls are putting in more time than they ever have historically to this game.”
Irmo currently has its highest participation in softball with at least 250 girls expected in the spring and about 150 playing this fall.
Irmo Little League softball is experiencing record participation. (Photo by Amanda Vogt)
Community Commitment
Jensen and Baxter spend nearly 40 hours every week at Friarsgate and that’s in addition to their full-time jobs. Irmo Little League is run entirely by volunteers and most parents are highly involved in the league’s operation.
There are about 200 volunteers, but Baxter said only about five “put in way too much time.” Even though his kids are too old to still play in Irmo Little League, he wouldn’t do anything differently.
“This is my home,” Baxter said, adding that he believes this league is so successful because “it’s 80% family, 20% baseball.”
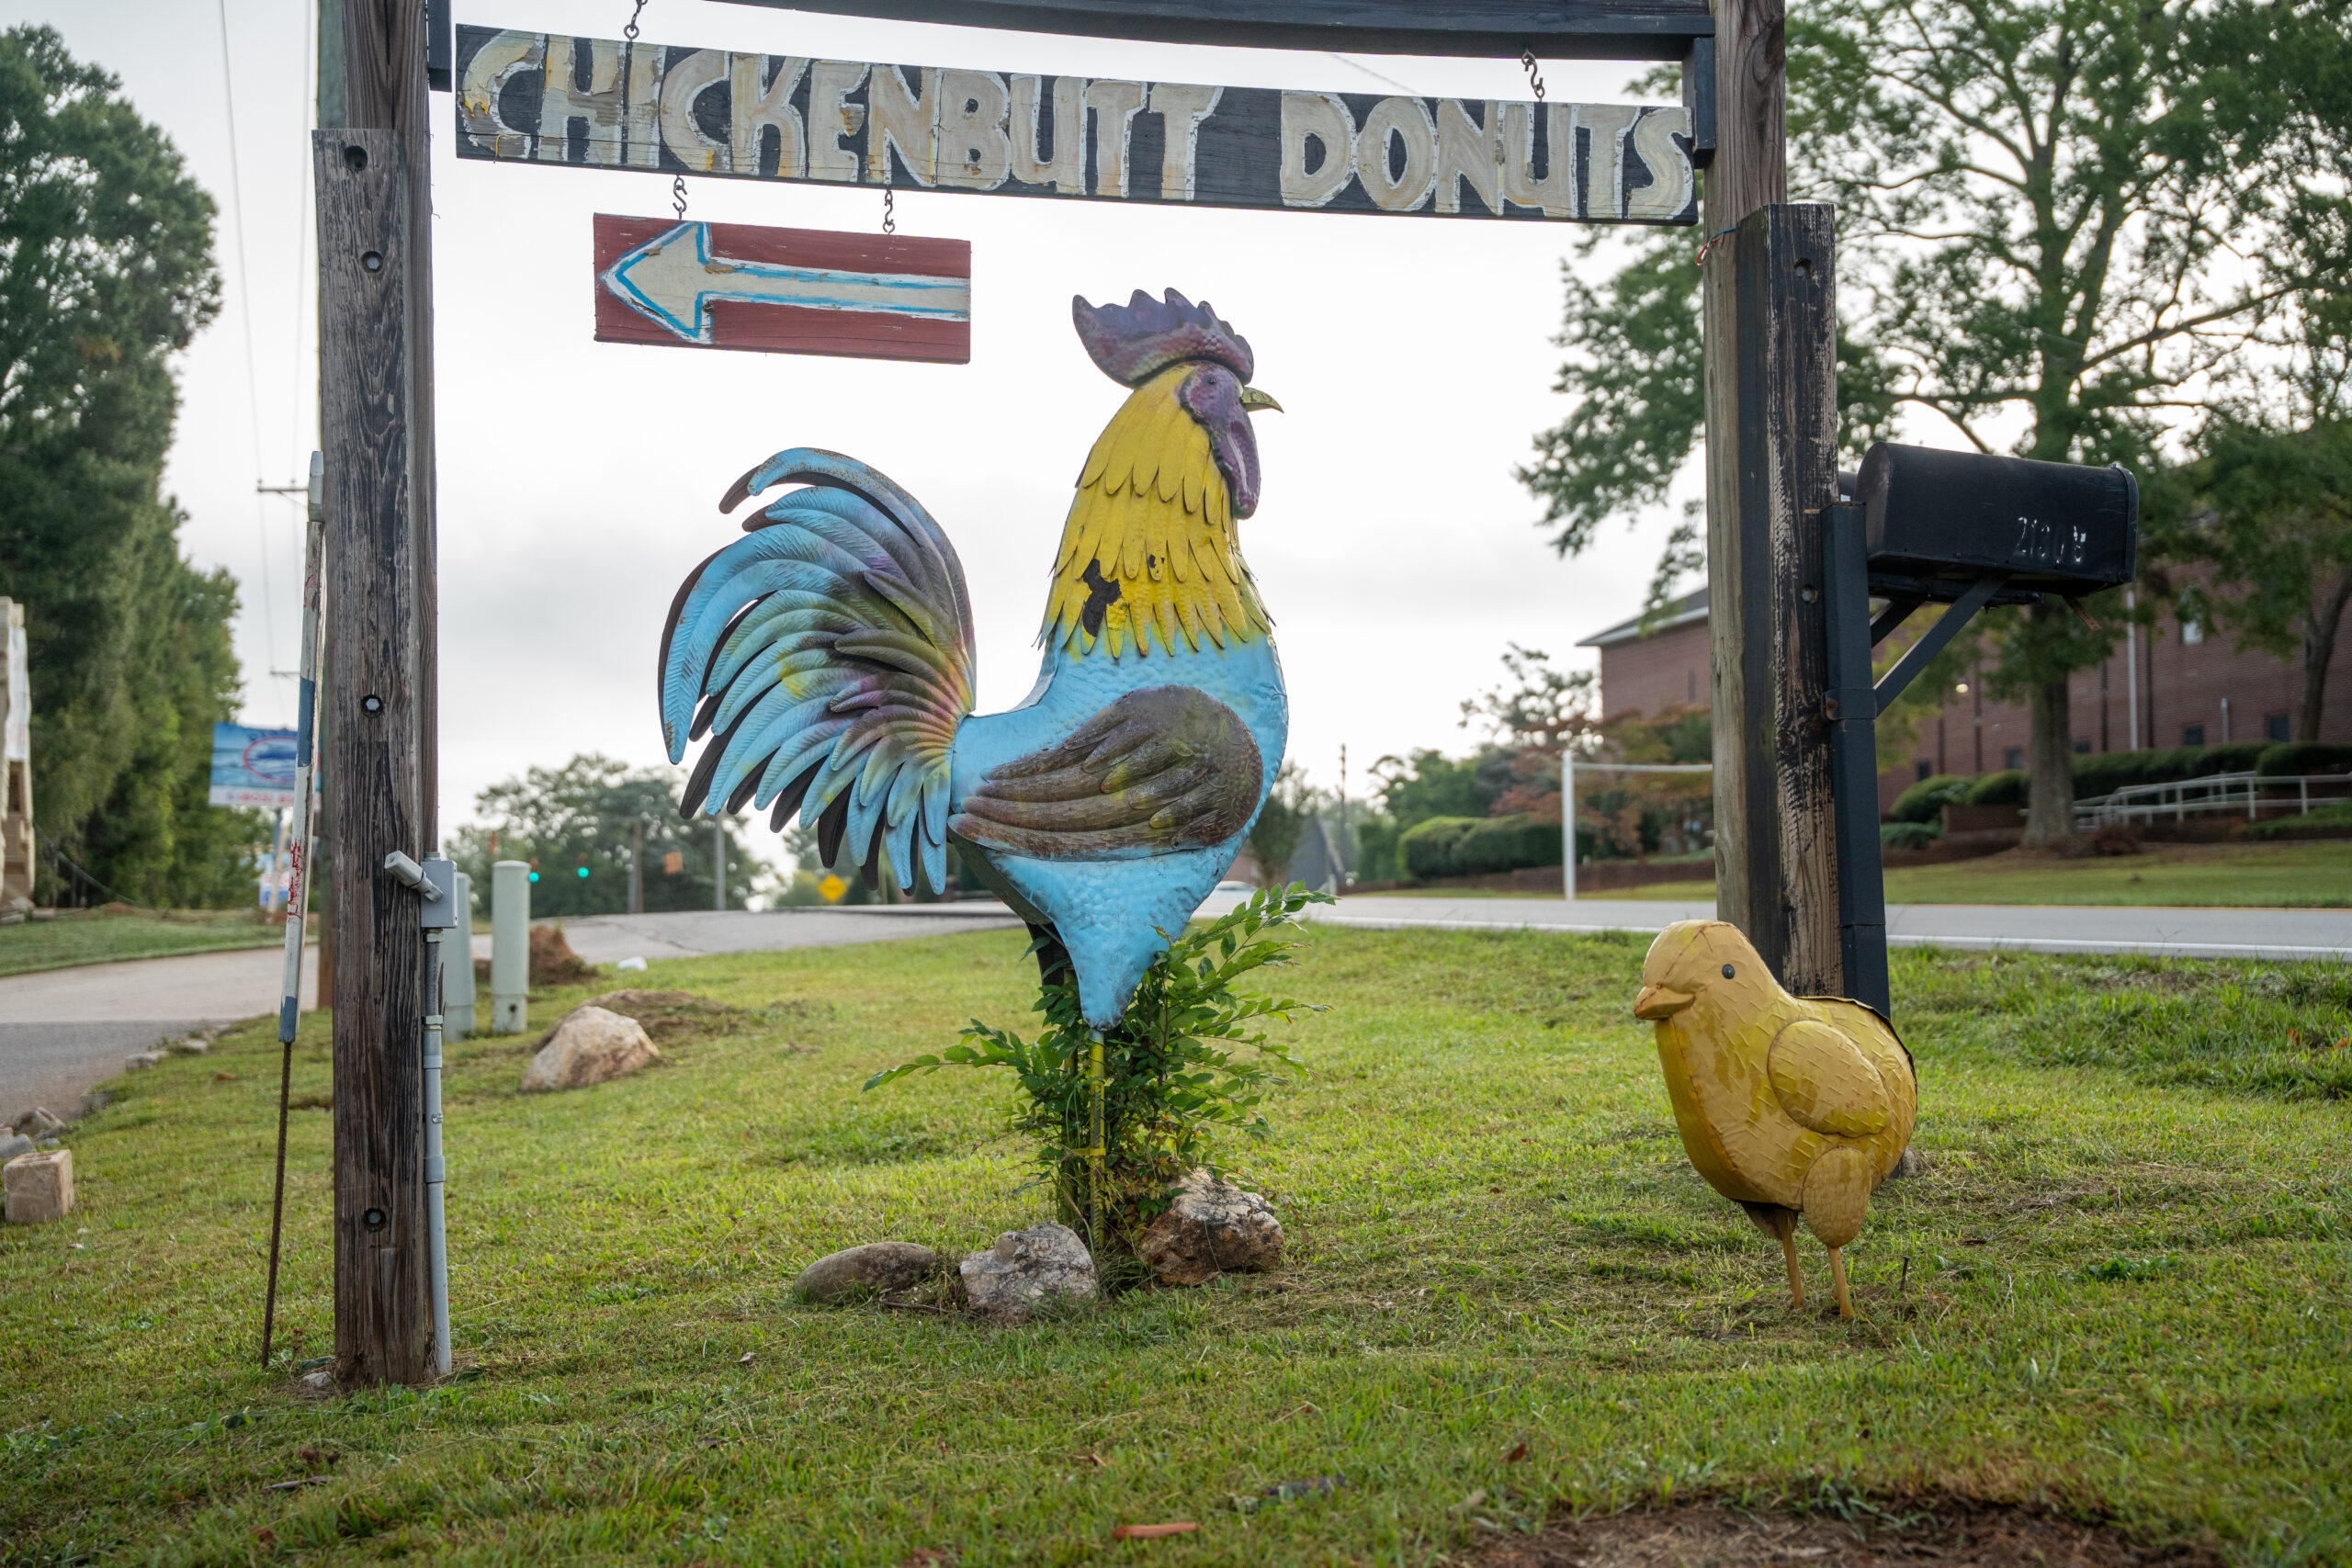
Irmo is a place where many people grow up and eventually move back to and start businesses. Tre Dabney opened Chickenbutt Donuts seven years ago with his wife. He grew up in Irmo and played Little League — now he’s a sponsor of the program.
“There just hasn’t been a better place that I’ve been,” Dabney said. “And it really seems like the rest of the country is figuring it out. The secret is kind of out.”
Chickenbutt Donuts was a part of Irmo Little League’s largest fundraising year last season, supplying over 300 dozen donuts sold at the concession stand. Dabney does not see this partnership ending anytime soon.
“It’s great coaches and it’s great kids and it’s a great community supporting them along the way,” Dabney said. “When you see what they put on the field, it looks like magic, it looks like it’s just supernatural, but really, it’s about coaches working hard and kids working hard and the community putting the full force of their support behind all of them. And boy, howdy.”
Over 300 dozen Chickenbutt Donuts were sold at Friarsgate Park last year. (Photo by Amanda Vogt)
Baseball Is Fun!
In a town like Irmo, baseball is tradition. The community rallies behind its clubs and in September it hosted a town celebration for the four teams that made Little League World Series appearances.
“Success is when I come down here (to Friarsgate), am I seeing a bunch of smiling faces?” Jensen said. “Are siblings who you see at other sports maybe getting dragged by the hand out of the car because their brother or sister is playing? Versus, when they get out of the car here, and they’re running to see their friends. That, to me, is success.”
Sunflower seeds coat the ground from underneath the bleachers where parents keep a close eye on the game. Siblings and other kids are running around, even tossing rocks in the air and trying to hit them with sticks while baseball is played all around them.
“You have so many people come out that are not even having to be here that night but are coming just because it’s so much fun,” Jensen said.
In the rare moments when not all of the Friarsgate fields are occupied, the lights remain on.
Kids often just play sandlot ball on the fields, nothing serious, just fun. Friends are made during pick-up games of catch or impromptu hitting practice.
“I’m sure this happens at lots of Little Leagues, I’m not saying it doesn’t, but that’s the kind of thing that makes it special,” Bogan said mid-interview, when he noticed a group of kids randomly playing together. “I don’t even know how well (they know each other) but they’re out there playing and they’re just goofing off.
“It’s just a fever about playing baseball.”
Joe, the slugger/pitching star for Irmo, certainly has that fever. After coming back from Williamsport, the first thing he did was pick up a bat and started swinging in the back yard.
“If we were the ones pushing him, I feel like it wouldn’t be right, but he wants to do it,” said his father, Jason Giulietti.
Members of last year’s All-Star teams are still deciding if they will return to Irmo Little League or not. The divisions they compete in are changing as the kids get older. But no one wants to think about next year yet — the accomplishment of making it to a Little League World Series is still sinking in.
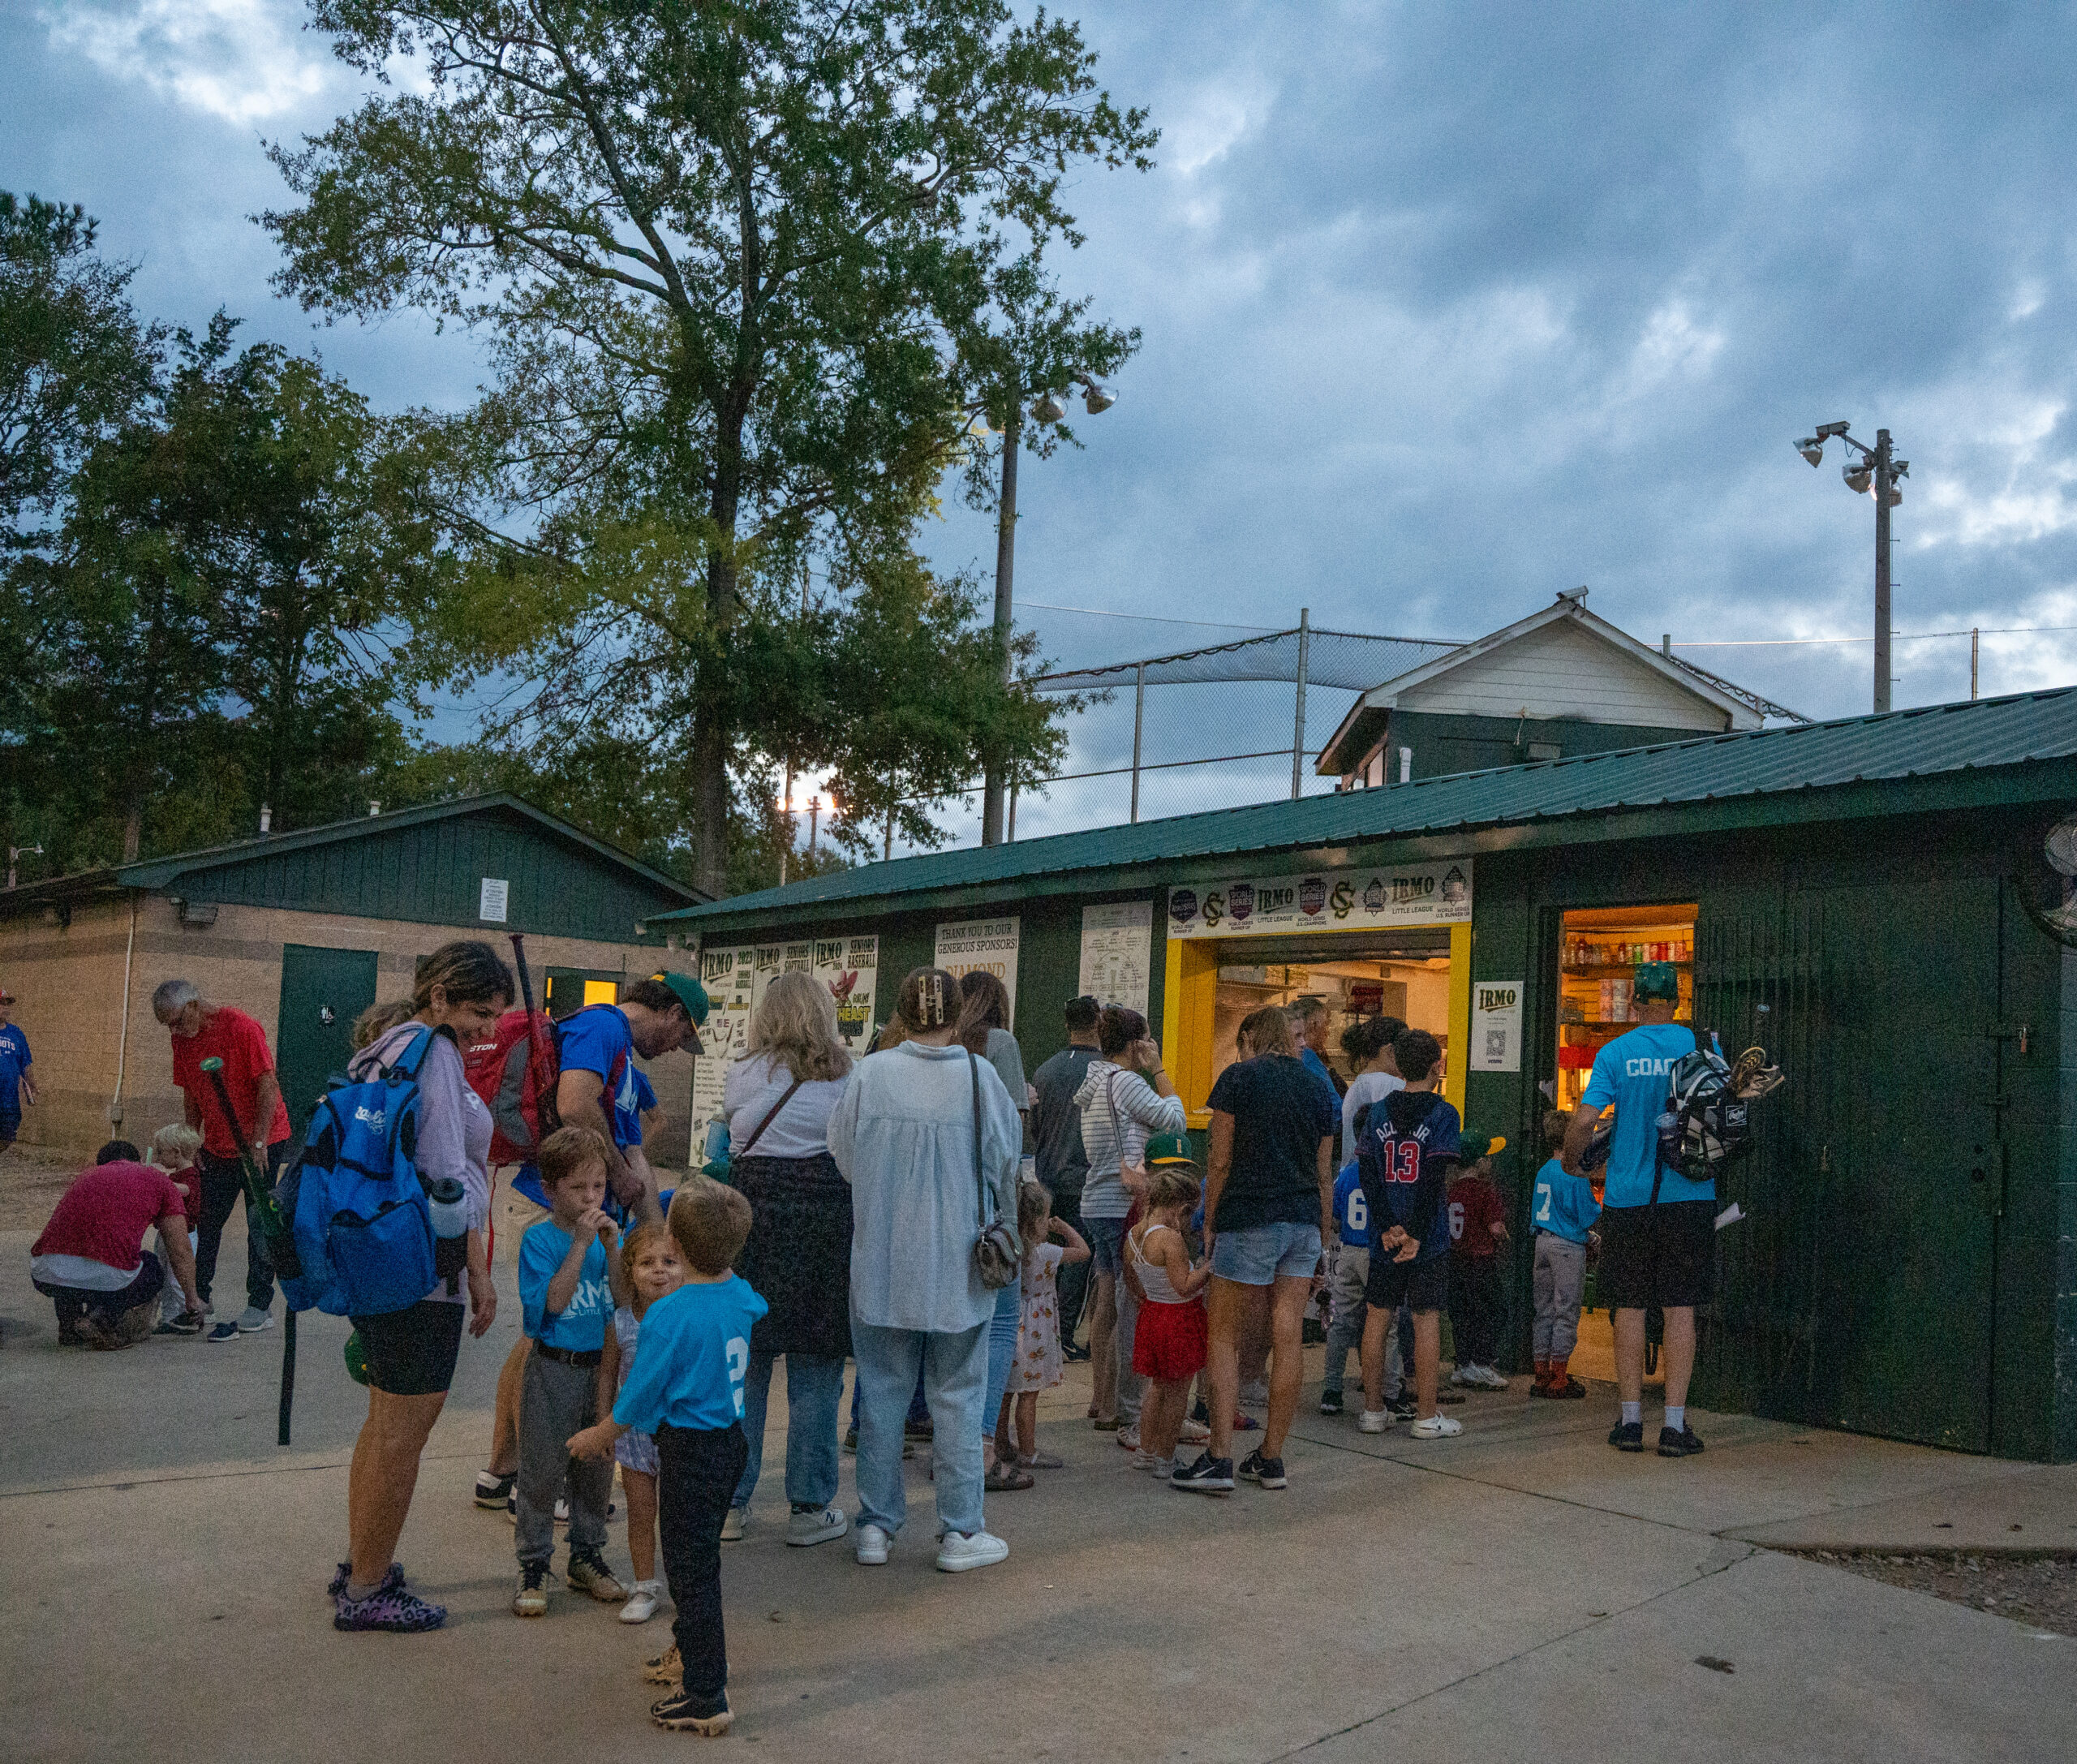
Irmo Little League families line up at the Friarsgate Park concession stand. (Photo by Amanda Vogt)
“Imagine having a great Thanksgiving dinner and you’re just stuffed and you’ve had a great experience, you wouldn’t trade it for anything and then people say ‘Well what are you going to do for breakfast tomorrow?’ Like, you’re not ready to think about it,” Bogan said, referring to a conversation he had with his wife about baseball decisions for next spring. “That’s kind of where we’re at. We’re not really ready to think about it.”
But if not Bogan, someone will coach Irmo Little league next year. And kids will certainly be ready to play. And Friarsgate will be ready to greet them.