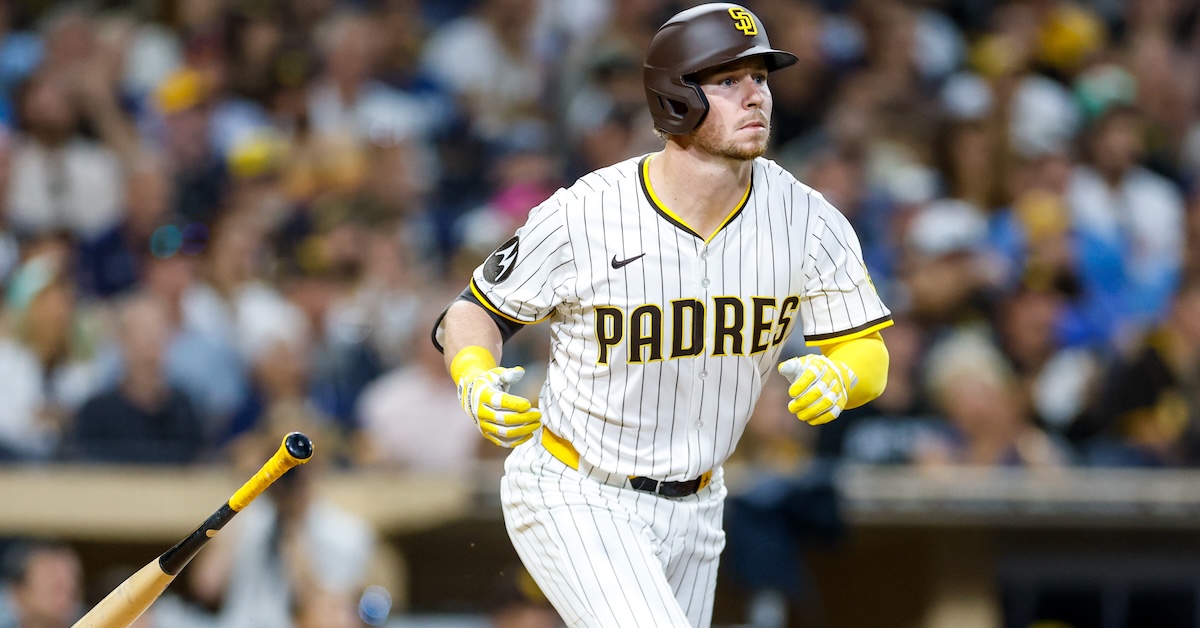
Nobody’s having more fun this offseason than the Toronto Blue Jays, who celebrated their first pennant in 32 years (and near-miss at winning the World Series) by rearming and getting back into the fight. Midseason acquisition Shane Bieber re-committed for pennies on the dollar, and Toronto supplemented its rotation by landing the top free agent pitcher on the market, Dylan Cease, as well as KBO breakout starCody Ponce.
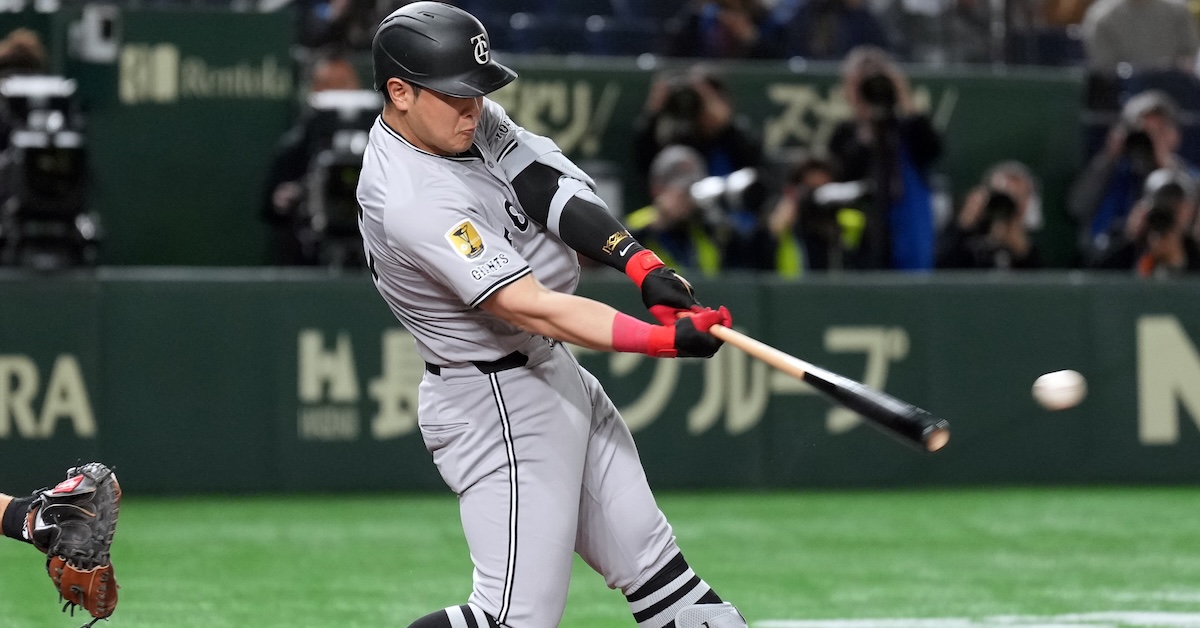
The Jays then kicked January off by reaching back into the international market to purchase third baseman Kazuma Okamoto from the Yomiuri Giants of NPB. The Jays are already up to third in projected 2026 payroll, at least for now; the Phillies and Yankees are fourth and fifth, and both of those clubs have some rounding out of the roster to do before spring training.
“It’s not being quantified like it should.” That’s what Tommy Pham told Will Sammon and Eno Sarris of The Athletic. Pham isn’t your stereotypical ballplayer who hates advanced stats. He’s a visionary who wants them to be even more advanced, to factor in even more context, to do an even better job of turning every tiny thing that transpires on the field into cold, hard numbers that can be credited to or debited from a ballplayer’s account. On Monday, Sammon and Sarris published an article that described Pham’s dream of a brighter sabermetric future. “I want to create a system that is going to change all that,” he said. Tommy Pham, the old school grit-and-grinder with 12 years in the majors under his belt, wants us nerds to get even nerdier, and he’s here to help. He even has a name in mind: PhamGraphs. “It’s pretty self-explanatory,” he said.
First and foremost, we here at FanGraphs want to let Tommy Pham know that we are going to sue your ass back to the stone age for trademark infringement so incredibly flattered by this charming homage. Moreover, we are here to help. We are up for the challenge. We want in. Welcome to PhamGraphs.
I can relate to Pham’s plight personally, because once upon a time, I, too, created my own FanGraphs knockoff. Specifically, I experienced a burgeoning enthusiasm for apples in the summer of 2016, so I started a spreadsheet where I’d list all the apples I ate, rate them on a scale of one to five, and write a review. The spreadsheet was titled AppleGraphs, and I figured it that if I really liked tracking my apples, I’d eventually turn it into a blog. Instead, I kept it up for a couple months and then forgot about it. I never showed it to anybody. Here’s an excerpt.
A Taste of AppleGraphs
Date
Cultivar
Source
Grown
Rating
Descriptors
8/2/2016
Fuji
Trader Joe’s
Chile
4
Gorgeous
Notes: I took a digital art class in college. There was little in the way of instruction about improving as an artist. It seemed like the main goal was to learn how to discuss art as pretentiously as possible. When a classmate called my friend’s work cool, the professor cringed and explained that she should instead say the piece was “visually interesting.” I enjoy euphemisms as much as anybody, but that never struck me as a great bargain: surrendering immediacy and directness for the chance to sound more impressive. This is all by way of saying that the apple I ate today looked cool as hell. It was all stripy, with vertical ribbons of greens and reds like some kind of marble offering to the god of picturesque produce. It tasted pretty cool, too. It was light and refreshing, and the first slice was surprisingly sweet. For some reason I didn’t really taste that sweetness in the remainder, but big deal. The pleasure of the first bite was more than enough. Can you really ask more from an apple than one nice moment?
I wrote a total of 13 entries before it petered out (though if some venture capitalist is reading this and wants to throw a million dollars my way, I will gladly resurrect AppleGraphs as a blog or a newsletter or a zine or whatever unwieldy medium you and you blood money would prefer). You can read the whole thing here, but only if you really, really don’t have anything better to do, because, once again, it was just a spreadsheet where I described apples as a way of killing time at my desk until FanGraphs published a new article for me to read.
My extraordinarily roundabout point here is that, as someone with experience ripping off David Appelman (with apples, no less), I am determined to take Pham very seriously and answer his points as best I can, one by one. However, I want to note first that Pham’s comments revealed two overarching concerns. First, he wants the numbers to feature more context, to get into deserved performance rather than actual performance. Weighted Runs Created Plus, our flagship hitting metric, is park-adjusted and league-adjusted. The numbers are measured against the league average, which is always 100, and they’re adjusted based on the hitting environment of the park a hitter plays in. But they’re not designed to show deserved performance. They’re designed to show how well you performed relative to the league average. They don’t factor in strength of opponent or batted ball luck or a host of other factors. However, those numbers are available to Pham if he wants them. DRC+, or Deserved Runs Created Plus, is the flagship offensive metric of Baseball Prospectus. Deserved performance is what they do at BP. That may just be the site for Pham, and he may want to rethink his branding.
Actually, now that I mention it, I should probably note that Baseball Reference WAR also takes the strength of your opponent into account. The point is, Pham can keep his options open. The sabermetric community is a big tent. We’re all Pham.
That said, you have to stop somewhere. It’s impossible to factor everything in. There’s no shortage of examples. If you’re Randy Johnson and you detonate a mourning dove that divebombs into the path of your fastball, and the umpire calls the pitch a ball (which would have been the right call), should that ball really count against you? If you’re Rafael Ortega and a double falls in over your head because a territorial goose has colonized deep center field and forced you to play too shallow, should you really have your defensive metrics docked? If you’re Cody Bellinger and some room service chicken wings give you such horrendous food poisoning that you have to miss a game and bat .143 with a 24 wRC+ over the next two weeks, is that really all your fault? Shouldn’t some of the -0.2 WAR you put up over that timeframe be doled out to the chef at the hotel, to Perdue AgriBusiness, and to the chickens themselves? I could keep going all day. I’m not even done with the bird examples yet. You could keep going forever because everything’s connected. At some point, you just have to draw the line and look at what happened on the field.
Pham’s second overarching concern was, obviously, to burnish his numbers. He’s a 37-year-old free agent who is looking for a deal. He has played for nine different teams over the last five seasons and put up a combined 0.1 WAR across the last two, and he’s been on something of a media campaign recently (and not so recently). In November, Pham revealed that he’s been playing through plantar fasciitis since the second half of 2023, but, conveniently, he’s all better now. These new comments no doubt express his true beliefs, but they also seem designed to put a positive spin on his performance in order to get himself a good deal – or as Zach Crizer put it over at The Bandwagon, “Tommy Pham has some ideas about stats that would make Tommy Pham look better.”
Now let’s get to Pham’s issues. He made two particular points. The first was that playing for a losing team, especially one that loses a lot of close games like the Pirates, means that you tend to face better pitching, because all the opponents who end up beating you have to use their high-leverage arms in order to close out their victories. The close-game qualification is an important one, and it takes some of the sting out of Pham’s argument, because bad teams end up in just as many blowouts as good teams, and the leverage is low for both teams at that point. If the Phillies are blowing your doors off, they’re not going to waste Jhoan Duran in a non-save situation. Now, the back of a good team’s bullpen is sure to be better than the back of a bad team’s, but the difference isn’t going to be quite as big.
Still, Pham is right that he’s been facing tougher arms than usual. In addition to noting all the close games the Pirates played last year, he mentioned that he switched teams twice during the 2024 season, and that those moves came at inopportune times. A series of scheduling quirks caused him to catch three straight prolonged stretches where his current team was facing off against particularly stiff competition. As a result, he believed that he faced much better pitching than most batters. (He also mentioned that he discussed this with his agent, who confirmed his hunch, and I have to admit that I’m a sucker for this line of reasoning. Anyone who has ever had an argument with a significant other has heard some version of the line, “I asked my friends, and they all think I’m right and you’re wrong.” No matter how bad the fight, it’s always at least a little bit amusing.)
We checked this out, and when I say we, I mean David Appelman. David calculated the average ERA and FIP of the pitchers that every batter faced in both 2024 and 2025. In 2024, the pitchers Pham faced had a combined ERA of 4.02, the 19th-lowest among all batters with at least 400 plate appearances. That put him in the 90th percentile. In 2025, his opponents had a 4.17 ERA, which put him in the 75th percentile. He really has faced tough pitching over the last two years. It’s not unprecedented – somebody’s got to be in the 99th percentile every year (sorry Royce Lewis) – but it is real.
Unfortunately, Pham’s argument falls a little bit flat at this point. If you try to give him credit by regressing his performance to account for this greater degree of difficulty, you learn that the effect is much smaller than you’d expect. In 2025, Pham faced pitchers whose combined ERA was 0.08 points lower than the league average, so let’s give him credit for those extra points. There are several ways to run the numbers, but Ben Clemens showed me a quick and dirty way to do it using constants from The Book. Skip the rest of this paragraph if you don’t like math. One point of wOBA works out to roughly half a run per 600 plate appearances, and 600 plate appearances works out to roughly 141 innings. Half a run over 141 innings works out to 0.032 points of ERA. Now we have a conversion rate: one point of wOBA equals 0.032 points of ERA.
That means if we give Pham 0.08 extra points of ERA to bring him up to the league average, it only adds 2.5 points to his wOBA. That’s it. He goes from .308 to .311. Among the 215 players with at least 400 plate appearances in 2025, that takes him from the 150th-highest wOBA to the 145th.
If we use FIP rather than ERA, which Pham would presumably prefer because it’s a better indication of a pitcher’s true talent level, we’d add only 1.3 points of wOBA. (We can go even further: If we use the pitchers’ projected ERA or FIP at the time of each plate appearance according to Steamer – effectively showing how good everybody thought the pitchers were at the time – then Pham actually faced an easier slate of pitchers than the average batter!) As I mentioned earlier, DRC+ takes the strength of opponent into account, and that’s likely why it graded Pham higher than wRC+ over the last two seasons, but that bonus was just three points in 2024 (a 92 wRC+ and 95 DRC+) and four points in 2025 (a 94 wRC+ and 98 DRC+). None of this turns him into even a league-average bat. So yes, Pham faced tough pitching, but no, it doesn’t make all that much difference.
That said, I don’t want to let all these numbers get in the way of a good story. While we’re talking about all the high-leverage arms Pham has faced, we need to note that he was great in high-leverage situations. In 2025, he ran a 168 wRC+ across 40 high-leverage plate appearances, batting .355. Over the past two seasons, his 136 wRC+ in high-leverage situations puts him in the 80th percentile of all hitters (minimum 80 high-leverage plate appearances). If I were Tommy Pham, I’d be making sure that high-leverage situations were part of the conversation, too.
Pham’s second point was about how wind can play havoc with outfield defense, and here I’ll rely on an excerpt:
Pham remembers a particular play from last season that frustrated him as it related to how defensive metrics are used to value players. In a game against the Milwaukee Brewers, he was playing left field. A ball hit approximately 360 feet with a 90-mph exit velocity short-hopped the outfield wall. The wind carried it. Pham was playing in, so he couldn’t get to the ball. The play reflected poorly in his defensive numbers.
“I got docked on the ball because Statcast doesn’t factor the wind part,” Pham said. “When I learned that, I’m like, OK, if the wind’s blowing out, I need to play a little bit deeper.
“It’s a really flawed system. But it’s getting factored into our value.”
Before we get into the play in question, let’s start with the part where Pham says that he didn’t learn until age 37 that he should probably play a bit deeper when the wind is blowing out really hard. That seems – how do I put this respectfully? – unlikely to be true. Surely, this sabermetric visionary had, you know, thought about what the wind does before the year 2025. Pham makes a valid point about how defensive metrics have so far been unable to account for wind, but the example he uses to illustrate it is, by his own account, just a story about how he was positioned poorly.
Some of the details are off, but I was able to find the play in question. I understand why Pham has it stuck in his mind. It cost the Pirates a game. It was a line drive double from Caleb Durbin on May 25. It left the bat at 97.1 mph, traveled 371 feet, got over Pham’s head, and short-hopped the wall. The Pirates were leading 5-3 in the top of the eighth, and because the tying run was on second base, Pham was playing a bit shallower than usual. In 2025, the average left fielder at PNC Park played 301 feet deep, and Pham averaged 295. On this play, he was at 293 feet. He was making sure that he’d be able to hold the runner at third if Durbin singled. For that reason, I’m not so sure that he would’ve been playing deeper even if he had factored in the wind. The double scored two runs, tying the game at five, and Durbin scored the game’s deciding run when the next batter also doubled to Pham in left field.
Pham was right that the wind aided the ball a bit. Over the course of the 2025 season, 12 balls were pulled at the same launch angle and exit velocity off the same pitch type, and they traveled an average of 353 feet. This ball went an extra 17 feet. Still, his argument has several problems. The first is that Statcast only gave this ball a catch probability of 30% to begin with, thanks to the wall penalty. It graded out as a four-star play, which means that it was so difficult that it barely hurt Pham’s numbers. Second, at this stage of his career, Pham doesn’t make four-star catches anyway. His numbers going back on the ball have been bad for years now. He’s 37 and not that guy anymore (unless his plantar fasciitis really is gone forever). In fact, less than a week earlier, Elly De La Cruz hit a nearly identical ball to Pham in left field. Durbin’s ball required Pham to travel 79 feet over 4.7 seconds. De La Cruz hit his harder, but it required Pham to travel 78 feet over 4.7 seconds, and it landed in pretty much the exact same spot. On both balls, Pham had a chance to make the catch but decided to slow down — especially on De La Cruz’s — rather than risk injury by crashing into the wall.
Third, it’s also important to note that the Statcast numbers here, at least to some extent, factored in the wind already. Those catch probability numbers aren’t perfect, but this is exactly the kind of batted ball where they work well. Pham isn’t getting graded based on the launch angle and exit velocity; he’s getting graded on the hang time and the distance he had to travel. Statcast is accounting for those extra 17 feet in its grading system, and then it is knocking off some of the difficulty because the ball landed near the wall. It’s not taking off a couple extra percentage points because the wind made the ball move unexpectedly, and Pham is right that in a perfect world he would get credit for that. However, this is pretty tame in terms of wind effects. The ball didn’t change direction because of a sudden gust, and it didn’t move unpredictably due to swirling conditions. It just had a tailwind that allowed it to get on top of him. Maybe we’ll get there one day, but right now, it’s hard to imagine any system detailed enough that it could put a specific number of catch probability percentage points on just how much harder the tailwind made this play, let alone do so accurately enough to be worthwhile.
To return to the most important point, why wasn’t Pham taking the wind into account already? He got docked because he didn’t catch the ball, but he did not get docked (at least not by Statcast) for his positioning. In fact, because he started out so far from where the ball landed, Statcast gave him more leeway, reducing the catch probability, and thus the hit to his OAA. Other systems like DRP and DRS factor in positioning, and they may well have docked him for playing too shallow here. Or, maybe the opposite is true; maybe they would’ve recognized that he was playing shallow in order to hold the runner at third on a base hit, and would’ve considered his positioning to be correct even though it didn’t work out. If that were the case, perhaps they wouldn’t have held it against him either. There’s always more context to take into account, even when there are no birds in sight.
I should also note that Pham once again came close to touching on something that would have made him look great. Did you know that our splits tools allow you to check how a player performs based on the wind conditions? We can’t split out outfield defense, but it turns out that Pham is actually a great hitter when it’s windy. Over the course of his career, we have him credited with making 164 plate appearances when the wind is blowing at least 18 mph. In those plate appearances, he’s batted .354 with a 197 wRC+. Our database shows 513 players who have at least 60 plate appearances in those conditions. Pham’s 197 wRC+ ranks eighth, just a couple of spots behind Aaron Judge and Juan Soto. Yet again, Pham is doing the right thing by bringing wind into the conversation.
Before I leave you, I want to mention that, although I’ve made plenty of jokes and taken a critical eye to the issues he raised, I think Pham has the exact right attitude here. Like every player, he’s run into some bad luck at times. And, like every player, he’s also faced some good luck. Here’s a popup that turned into a double only because Pham had the good fortune to hit it to Teoscar Hernández:
Pham doesn’t sitting around thinking about all the times he got lucky, and for good reason. He plays the game at the highest level, where failure lurks around every corner. Nine years ago, right around the time I started the now-legendary AppleGraphs, I was playing in a pickup baseball league in Queens and saved this quote from Grégor Blanco. Coincidentally, it too appeared in an article by Eno Sarris:
“These things are going to happen. You go up and you go down. When you go down, you need to realize that it happens. Don’t let frustration get you. Try to simplify the game. Take some pitches, start seeing the ball again. Build that confidence again. You need to start seeing it inside yourself. ‘I got a walk! That’s good. I hit the ball hard.’ Sometimes in a streak, you hit the ball hard right at someone, and you think, ‘What do I have to do?’ Instead, say, ‘Yeah, that’s what I want. I hit the ball hard.’”
I saved it because, even in this silly adult league, I found it useful to trick myself into staying positive. When I hit a bloop single or reached on an error, I’d tell myself, ‘Great job, you got on base.’ When I lined out, I’d tell myself, ‘Great job, you hit the ball hard.’ In other words, I found a way to take something positive out of nearly every at-bat.
Pham has a tattoo that reads “Believe in Yourself” on his left arm, just below the spot where his sleeve ends. I’d be remiss if I didn’t point out that it was a huge missed opportunity for him not to spell it ‘Yourselph,’ but I’m sure the location was no accident. I’m sure the tattoo is right there so that Pham can look down to remind himself of that whenever he feels the slightest bit of doubt creep in. If he wants to create his own statistics in order to help him follow the instructions on his arm, then we here at FanGraphs and PhamGraphs are happy to do our part.
Every free agent signing is a trade. For that matter, every job everywhere is a transaction. The employer agrees to give you money and maybe even health insurance. You agree to give them your work. You’re trading something they want in exchange for something you want (or at least something you need in order to not die). But we don’t tend to think about things this way. Everybody has to work, so everybody just gets the best job they can. For ballplayers who have reached free agency, that generally means maximizing earnings. That’s what Michael Lorenzen did on Wednesday, when ESPN’s Jeff Passan reported that the muscular right-hander agreed to a one-year, $8 million deal with the Rockies (with a $9 million club option for 2027). Still, this deal is notable for the starkness of the wants on either side and the concessions they made to get them. Lorenzen wants to be a starting pitcher. That’s all he’s ever wanted. The Rockies want a starting pitcher who is willing to ply his trade under two adverse circumstances: in Colorado and for the Rockies.
In 2015, toward the end of a rookie season in which he put up a 5.45 ERA and 5.48 FIP, the Reds relegated Lorenzen to the bullpen. During six subsequent seasons in Cincinnati, Lorenzen wasn’t shy about the fact that he wanted to go back to starting and often appeared in line to get that chance, but underperformance and injuries – a UCL sprain, a teres major strain, a shoulder strain, even a bout of mono – pushed him into relief roles (and the occasional appearance as an outfielder). He started just five more games in his final six seasons with the Reds. Although he ended on a down note, he ran a 3.65 ERA and 3.92 FIP over those six seasons. He’d earned the chance to pitch where he wanted on his own terms, and he did just that. Lorenzen signed with the Angels, then the Tigers, then the Rangers, then the Royals, and now with the Rockies, all on one-year deals (usually incentive-laden ones), and all with the publicly-acknowledged understanding that he would be given the chance to start.
Making that part clear up front was important because no matter how well he pitched, it was all too easy for people to put together a table that showed his splits as a starter and a reliever. You’d rather have the second guy, right? The one whose strikeout rate is within shouting distance of the league average and who possesses some ability to keep the ball in the yard?
The Splits Michael Lorenzen Can’t Escape
Role
K%
HR/9
ERA
FIP
wOBA
Starter
18.8
1.26
4.27
4.71
.325
Reliever
21.1
0.86
3.75
3.93
.295
But Lorenzen persisted. He’s 34 now, and he made the most of his seven-pitch starter’s arsenal. Over the past four years, he made 93 starts for six different teams. And he pitched fine! He ran a combined ERA- of 99 and FIP- of 110. He was an average pitcher, a desirable enough arm that playoff-bound teams traded for him at the deadline in two of the past three seasons. In 2023, he threw a no-hitter. In 2024, thanks to good fortune in the form of a low BABIP and high strand rate, he ran a 3.31 ERA. In 2025, he wasn’t so fortunate, running a 4.64 ERA that matched his 4.59 FIP. Over the past three years, he’s been right around the top 50 in terms of games started and innings pitched. Nevertheless, when things got real, when the season wound down, when Lorenzen found himself in the playoffs, he also found himself back in the bullpen. He won’t have to worry about that in Colorado.
Lorenzen has found the toughest pitching environment in baseball, but he’s also found a situation where league-average numbers would put him in rarefied air. In 2025, Colorado’s starting pitchers ran a 6.65 ERA. That’s the worst mark ever. And when I say ever, I mean ever. It’s the highest starting pitching ERA in AL/NL history. Fourth place belongs to the 1899 Spiders. (Although the 2025 bullpen didn’t set a record, Colorado does own the highest combined bullpen ERA of any franchise at 4.81.) RosterResource pegs Lorenzen as the Rockies’ no. 2 starter, behind lefty Kyle Freeland and ahead of Chase Dollander, Tanner Gordon, and Ryan Feltner. Freeland was the only one of the four incumbents with an ERA below 6.00 or a FIP below 5.00.
But this is a new era. Lorenzen will be the first major leaguer to sign with the Rockies in the Paul DePodesta era. He will also be the team’s first investment in starting pitching of any substance at all since 2015, when they signed Kyle Kendrick for $5.5 million. Somehow, Lorenzen is only the fifth starting pitcher to sign a deal with the Rockies in the past seven years. I went through Colorado’s RosterResource free agent tracker to check. The tracker goes back to 2020, and the four starters I found put up a combined -0.1 WAR with the Rockies. They won a combined 11 games. Chad Kuhl ran the best ERA. It was 5.72.
It’s scary to think about how many homers Lorenzen could give up in the thin Denver air, but he’d have to crash spectacularly hard in order be anything less than a significant upgrade for this rotation. Everybody gets what they want here, and all it took to get it was a couple extra millions on one side and a willingness to pitch on a mountain on the other. The Rockies get to take their first step on the long road to reputability, and they get to sign their first decent starting pitcher in years. Lorenzen gets his money – almost certainly more money than he would have gotten anywhere else – and he gets what must have been his last chance to remain a starting pitcher. If he defies the odds and pitches well, maybe he can keep the streak going and sign a similar deal next year.
On December 28, Sunday Notes led with a look at how seven of the nine position players projected to start for the Minnesota Twins this coming season were drafted by the club in either the first or second round. (The column also cited homegrown numbers for several other organizations.) Twins president of baseball operations Derek Falvey was quoted extensively within the piece, offering perspective on how the current roster came together.
Today we’ll hear from Twins GM Jeremy Zoll, as well as from Falvey, on a quartet of first- and second-round picks who have yet to reach Minnesota. One is a middle infielder, three are pitchers, and all rank among the team’s top prospects. I asked about each of them when the executives met with members of the media during the Winter Meetings.
———
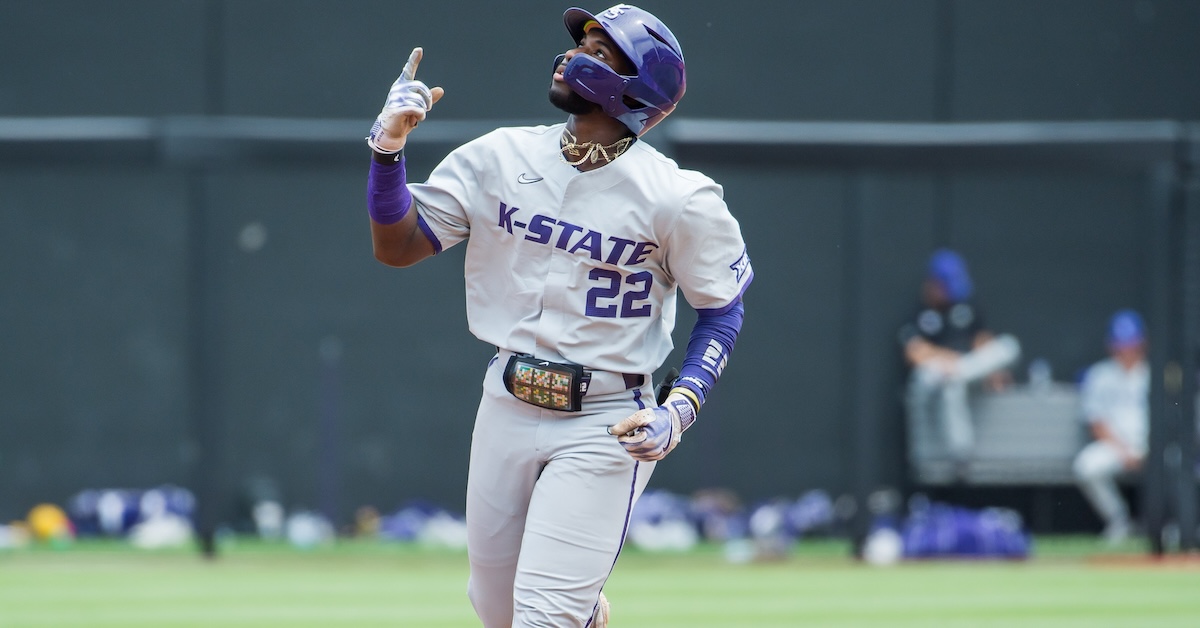
“It was Kaelen’s first full season, and he had an awesome year,” Zoll said of 23-year-old shortstop Kaelen Culpepper, whom the Twins drafted 21st overall in 2024 out of Kansas State University. “He was between High-A and Double-A, and we couldn’t have asked for it go much better. We’re really pleased. He had the opportunity to go to the Futures Game.
“He’s primarily playing shortstop, but he’s also getting some early work at second base and third base, as well as a little bit of game exposure at both spots. We’ll continue to let that play out as we get through spring training and into the season. We’ll figure it out exactly in terms of placement and proximity. We always kind of let the player dictate that with his performance, but he’s put just about as much pressure on us [as anyone] in terms of us wanting to keep moving him, and keeping him challenged.” Read the rest of this entry »
I have a confession to make. I started this article with a conclusion in mind, only to find that that conclusion was spectacularly untrue. But then I pivoted, and found something else I think is quite interesting. Is it obvious, in retrospect? I kind of think so. But I had fun doing it and learned something in the process, so I decided to write about it anyway.
I had a theory that the average catcher age, along with the average age for all the hardest defensive positions, had plummeted over the past decade, with the average DH age increasing as a counterbalance. My theory was that the universal DH allowed teams to massively alter their behavior. National League teams that had been playing older sluggers in the field could shift them down the defensive spectrum, either directly to DH or by displacing other old players to DH via a chain reaction of moving to easier defensive spots.
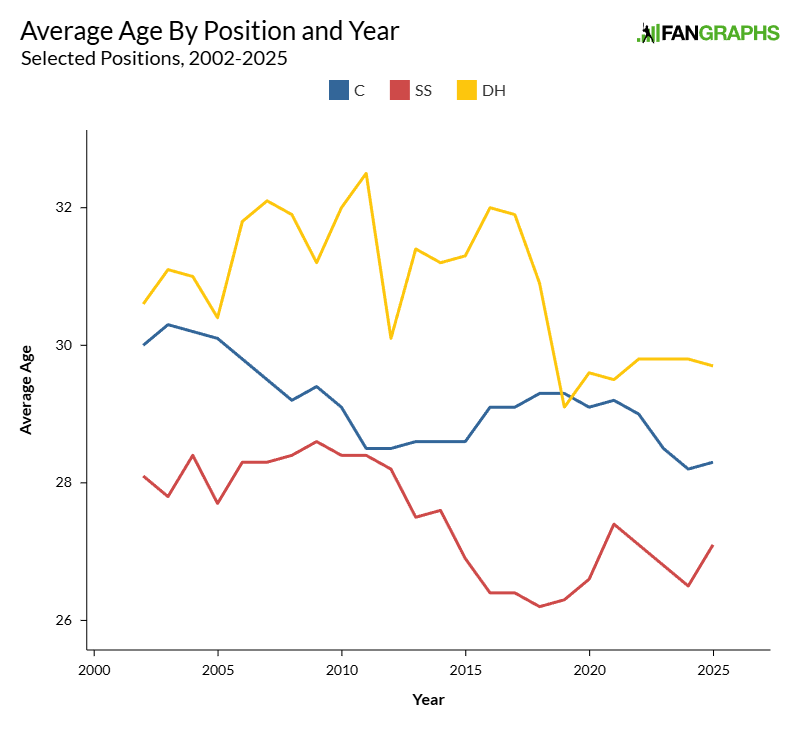
It’s beautiful logic, with just one problem: It’s untrue. Here’s the average seasonal age (as of July 1 each year) of catchers, shortstops, and DHs since 2002, the first year we have positional splits that allowed me to run this analysis:
The data is pretty noisy, which makes sense to me. It’s not like teams are targeting a given age; they’re just making baseball decisions about cost, team control, and production. Average age is a downstream result of a lot of decisions that are made for other reasons. But in the aggregate, the pattern I hoped to see just wasn’t there:
Average Age By Era, Position
Period
C
SS
DH
2002-2010
29.7
28.0
31.4
2011-2020
28.9
27.1
31.0
2021-2025
28.7
26.7
29.7
2002-10 vs. 2021-25
-1.1
-1.3
-1.6
In fact, DH has experienced the greatest decline in average age across all positions. That’s very much not what I expected. I do think that some of that is overstated. First base has had the smallest decline among positions, and I’d expect many of the displaced older hitters I mentioned in my hypothesis to end up there too. But if you average the age changes of first base and DH, they’re almost exactly the league average for position players. Clearly, the data do not support my claim. Read the rest of this entry »
Back in the fall, Daniel R. Epstein of Baseball Prospectus wrote a couple of articles about where hitters stand in the batter’s box. Statcast released batting stance information last year as part of the ongoing rollout of bat tracking information that started in 2024. Understandably, the location of a hitter’s center of mass got a bit overshadowed by the wealth of information about how their bat moves through space and finds its way to the ball (or not), but Dan did his part to drag it into the light. He found a relationship between contact rate and where the batter stands. Specifically, standing deeper in the box and standing closer to home plate are both associated with higher contact rates.
Both of those findings are intuitive enough. Standing deeper in the box gives you a longer reaction time. It’s no surprise that batters who take advantage of that extra information make more contact. It’s also easy to spot a potential selection bias: The players in the back of the box are likely back there because they’re the kind of contact-oriented players who want the extra reaction time.
I saw less of a physical reason for players who stand farther from home plate to make more contact, unless they stand so far from the plate that they have trouble reaching the outside corner, but (almost) nobody actually does that. It might take your bat head slightly longer to reach the outside part of the plate, but the ideal contact point for an outside pitch is deeper anyway, so I assumed the two would balance out and chalked the difference up to selection bias. Bigger players with longer arms naturally feel more comfortable farther away from home plate, and those bigger players tend to have more powerful swings, which tend to result in more whiffs. Causation isn’t correlation, and I wasn’t ready to go so far as to assume that standing farther away from home plate actually causes a batter to make less contact. Then I watched A League of Their Own again. Read the rest of this entry »
As you’re probably aware, the collective bargaining agreement between MLB and the MLBPA expires this year. Time flies, doesn’t it? The last time this happened, MLB locked out its players — the sport’s first work stoppage since the infamous strike that canceled the 1994 World Series.
The smart money is on there being another lockout next offseason; last time around, both sides did a lot of saber-rattling, but relatively little changed. We got the pre-arb bonus pool and some tinkering around the edges, but there was no salary cap, no abolition of the arbitration system, nothing that I’d describe as revolutionary. The duration of the lockout reflects that assessment; the stalemate lasted long enough to delay the season by a week, but not to cancel any games outright.
Having walked up to the verge of the abyss, peeked over the edge, and retreated, neither capital nor labor reaped a painful object lesson in the reality of all-out labor war. Last time that happened, it scared both sides into détente for 25 years. It seems reasonable to assume that either the players or owners might at least think about tickling the dragon’s tail next winter. Read the rest of this entry »
On Saturday, the eve of his posting window’s closure, 29-year-old Japanese third baseman Kazuma Okamoto agreed to a four-year, $60 million contract with the reigning American League champion Toronto Blue Jays. Okamoto, who made his NPB debut as a teenager, is a career .277/.361/.521 hitter with Tokyo’s Yomiuri Giants. He had a power-hitting breakout in 2018, his age-22 campaign, beginning a six-year streak in which he hit 30 or more annual home runs, including a 2023 season in which he cracked 41 of them. He ranks second in all of NPB with 214 homers since 2019, our first year of NPB data tracking here at FanGraphs. During his 2025 platform year, Okamoto posted an incredible .327/.416/.598 line and career-best 11% strikeout rate, albeit in only 77 games because he sprained his left elbow in an on-field collision that caused him to miss roughly half the season.
Dangerous from top to bottom, lineup depth was the bedrock of a Toronto team that came within inches of winning a World Series, and Okamoto’s balanced contact/power hitting style fits in with the Blue Jays’ baton-passing attack. Pre-existing defensive versatility on their roster — namely, incumbent second baseman Andrés Giménez’s ability to play shortstop — gave them the flexibility to pursue players of virtually any position as a means of replacing free agent shortstop Bo Bichette. Read the rest of this entry »
New Year’s Eve is a great time to agree to an eight-figure contract; you’ve already got champagne handy to celebrate. Congratulations, then, to Tyler Mahle and the San Francisco Giants on killing two birds with one stone.
Mahle is one of baseball’s great “I can fix him guys,” a status reflected in his contract structure: $10 million guaranteed over a single year, with an additional $3 million available in performance incentives. In 2020, the right-hander struck out 29.9% of the batters he faced over the pandemic-shortened season. The following year, he made 33 starts, threw 180 innings, and posted 3.9 WAR. Read the rest of this entry »