Archive for Daily Graphings

OOTP Brewers: Christian Yelich, Human Hot Streak

In theory, the Brewers offense was set up to be a stars-and-scrubs operation heading into the season. It’s not that it was particularly low-octane, or even misbuilt; when you have a player like Christian Yelich, it stands to reason that everyone else is going to look pedestrian in comparison.

Of course, theory doesn’t always survive in the real world. There are myriad examples of a team expecting a star performance from one player and receiving one from another. But for our OOTP Brewers, that has emphatically not happened. The offense is off to an excellent start — fourth in the NL in runs scored, fifth in wOBA, and fourth in batter WAR. It’s happened exactly the way that you’d expect — with a transcendent performance from digital Yelich and an adequate job the rest of the way down. Today, let’s celebrate Yelich’s brilliance.

In 2019, the major league WAR leader on May 31 was Cody Bellinger. You might remember 2019 Bellinger started the season off on a torrid pace. Even after an only excellent (instead of mega-excellent) May, he closed the month hitting .379/.465/.749. He was walking more than he struck out, he played excellent center field defense, and he even chipped in seven stolen bases (though he was caught stealing four times). It was a true all-phases effort, and it was worth a massive 4.2 WAR in 241 plate appearances. That pace would make for an 11.5 WAR season.

With that as calibration for how impressed you should be by numbers through the end of May, let’s turn to Yelich. His batting line looks a lot like Bellinger’s: .354/.444/.694, good for a 194 wRC+. Has he accomplished it with an absolutely outlandish BABIP? Honestly, not really. He’s posted a .381 mark so far, which is obviously a high number, but he’s posted a career BABIP of .358, and projection systems pegged him for something in the .340 range going into this year. Read the rest of this entry »


ZiPS Time Warp: Ken Griffey Jr.

Ken Griffey Jr. is not a typical candidate for a ZiPS Time Warp. Over his 22 years in the majors, from his time as a rookie phenom in 1989 to his sleepy denouement in his return to Seattle, we accumulated as many memories of Griffey as he did accolades. And unlike Eric Davis and possibly Joe Mauer, the earlier subjects of this series, Griffey’s injury struggles in his 30s did not rob him of a spot in Cooperstown; he was elected easily on his first ballot with 99.3% of the vote.

But we could have gotten even more baseball from Griffey than we did.

In the 80s, when fans talked about “Ken Griffey,” they were still talking about Ken Griffey père, then a veteran outfielder whose career featured stints with the Reds, Yankees, Braves, and Mariners, who was wrapping up his Hall of Very Good career. But by the 90s, it was Junior’s turn. When sportswriters of that decade named batters who could challenge Hank Aaron‘s home run record, Griffey was typically the protagonist, not the eventually successful Barry Bonds. Just as Juan Soto and Ronald Acuña Jr. are phenoms for young baseball fans today, Griffey was the start for younger Gen-Xers like myself and for older millennials. Junior always felt special, a player drafted out of high school with the first pick of the 1987 draft, the son of a famous player, an outfielder blessed with the coincidence of being born in Stan Musial’s hometown, on Musial’s 49th birthday. Read the rest of this entry »


Sunday Notes: Kyle Farmer Finally Took The Mound (Which Is a Lonely, Lonely Spot)

Kyle Farmer came in to pitch last August. The Reds were being mauled by the Chicago Cubs, and the 29-year-old Farmer is Cincinnati’s Mr. Versatility. Along with the cameo mound appearance, he caught and played all four infield positions over the course of the season.

What is surprising is that Farmer had never before pitched professionally. The 2013 draft pick — by the Los Angeles Dodgers out of the University of Georgia — has both the background and the bloodlines of an ideal mop-up artist. His father, Bryan Farmer, was an accomplished pitcher at Ole Miss who advanced as far as Triple-A in the Atlanta Braves system.

The chip off the old block was a two-way player as an Atlanta-area prep, and while his bat and glove ultimately became his calling cards, he was very much at home on the rubber.

“I loved pitching,” Farmer related to me recently. “I had a really good curveball — I could buckle some knees — and I also threw a lot of strikes, which is something my dad stressed the importance of doing. I was a closer my senior year of high school, but it turned out that I was a better shortstop than pitcher. My coach at Georgia wanted me to play shortstop every day, so that’s what I did.” Read the rest of this entry »


MLB’s Latest Proposal Caters to Its Richest Teams

Much of the focus regarding baseball’s potential return has centered on whether the players and owners can come to a financial agreement both parties feel works for them. The two groups may negotiate as cohesive units, but they are comprised of distinct individuals and entities that often have diverging interests. The league’s proposal appears to have been an attempt to drive a wedge between the highest earners in the sport and those making closer to MLB’s league minimum. And while Rob Manfred needs to find a solution that players will agree to, before he can even make such an offer, his proposal has to fly with his 30 bosses, the MLB owners. Those owners don’t always have the same goals or ideas about how the business of baseball should be run – the league’s latest proposal reflects those differences, as big-market teams received the biggest benefit.

A few weeks ago, Ken Rosenthal and Evan Drellich reported in The Athletic that baseball’s traditional revenue sharing was at risk in 2020. Local television money is big for teams in this era, and the gap between the top 10 teams in television revenue and the bottom 10 is, on average, $67 million even before accounting for network ownership. Attendance and stadium-related revenue tends to further exacerbate that gap. Revenue sharing, where each team pools together 48% of local revenue and divide it equally, shrinks the gap some, but still provides the big-market, high-revenue teams a significant advantage. With most stadium-related revenue potentially gone, the divide gets a bit skinnier. From the Drellich and Rosenthal piece:

“The discrepancy between the Rays and the Red Sox this year is not that dramatic,” the executive said. “It’s still money. It’s tens of millions of dollars. But it’s not hundreds of millions of dollars. And if you’re going to share that, it’s not going to move the needle enough this year.”

MLB’s presentation to the players regarding team losses had some fairly significant holes, but it did show the traditional big moneymakers like the Yankees and Dodgers suffering the biggest losses. Lost stadium revenue drives some of that, but high payrolls contribute as well. Those high payrolls are normally easily justified by massive revenues, but if team revenues were the same, the higher payroll clubs would be more likely to lose money. MLB’s latest proposal attempted to do those clubs a huge favor.

To provide some sense of the typical payroll gap between teams, the graph below shows only salaries of $1 million or more projected in the original 2020 season:
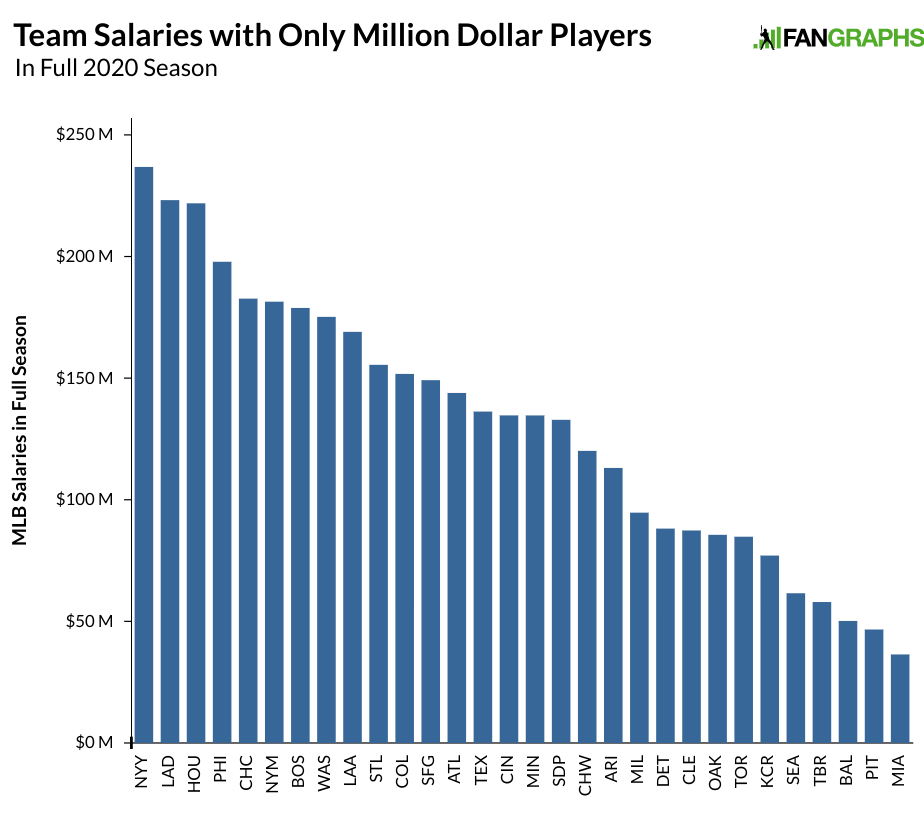
We see a huge spread between the top and bottom teams, which is fairly typical over the last few years. Here’s what the same graph looks like with pro-rated salaries over an 82-game season:
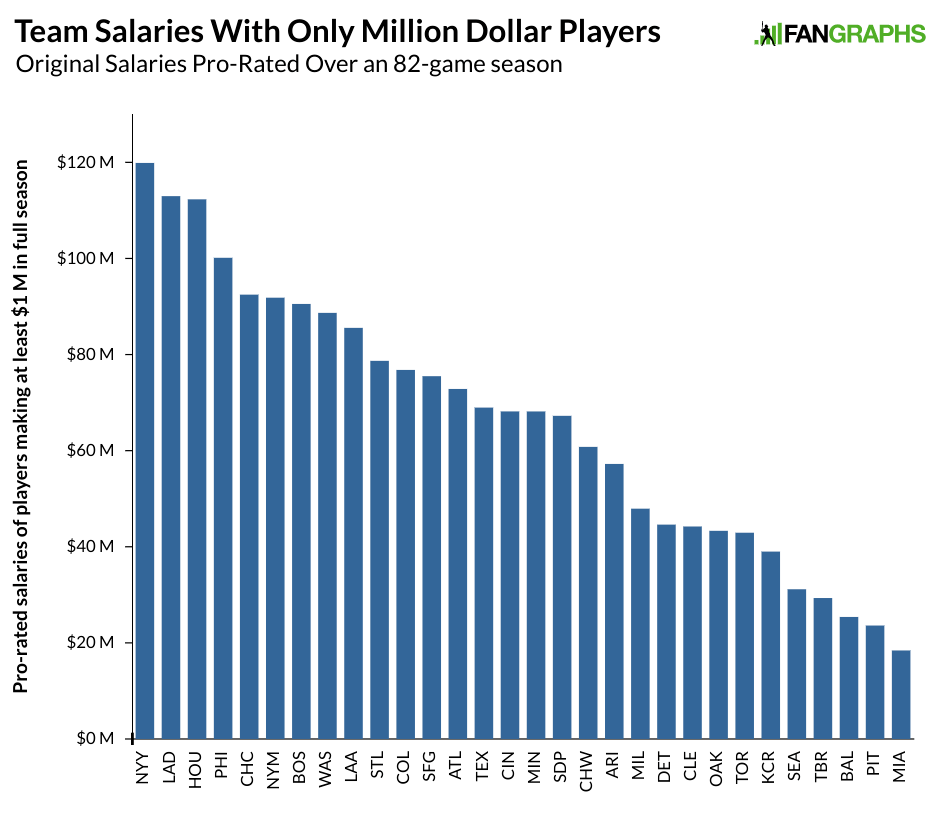
The second graph is basically the first one divided in half. These aren’t full payrolls because we’d need to add in all the minimum-salaried players, but the differences you see are pretty close to the total numbers. MLB’s latest proposal hits the highest-salaried players the hardest, and the teams that pay the higher-salaried players tend to have the larger payrolls. Here’s what would happen to team payrolls under MLB’s latest offer, including only players originally scheduled to make $1 million or more in a full season. The $200 million for playoffs is included in the figures below:
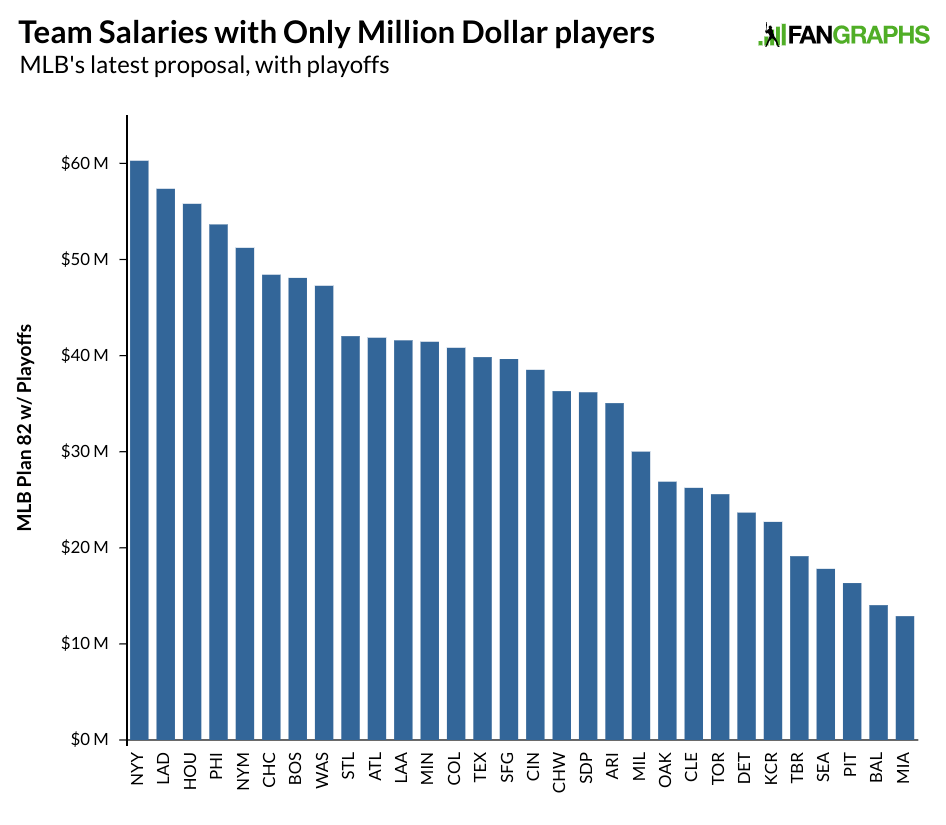
We see these salaries bundled more in the middle. MLB’s proposal dropped these players’ salaries by 45% compared to a pro-rated 82-game season, but the standard deviation of these salaries dropped by 53%. The graph below shows the changes in each team’s payroll from the March agreement with pro-rated salaries to MLB’s latest proposal:
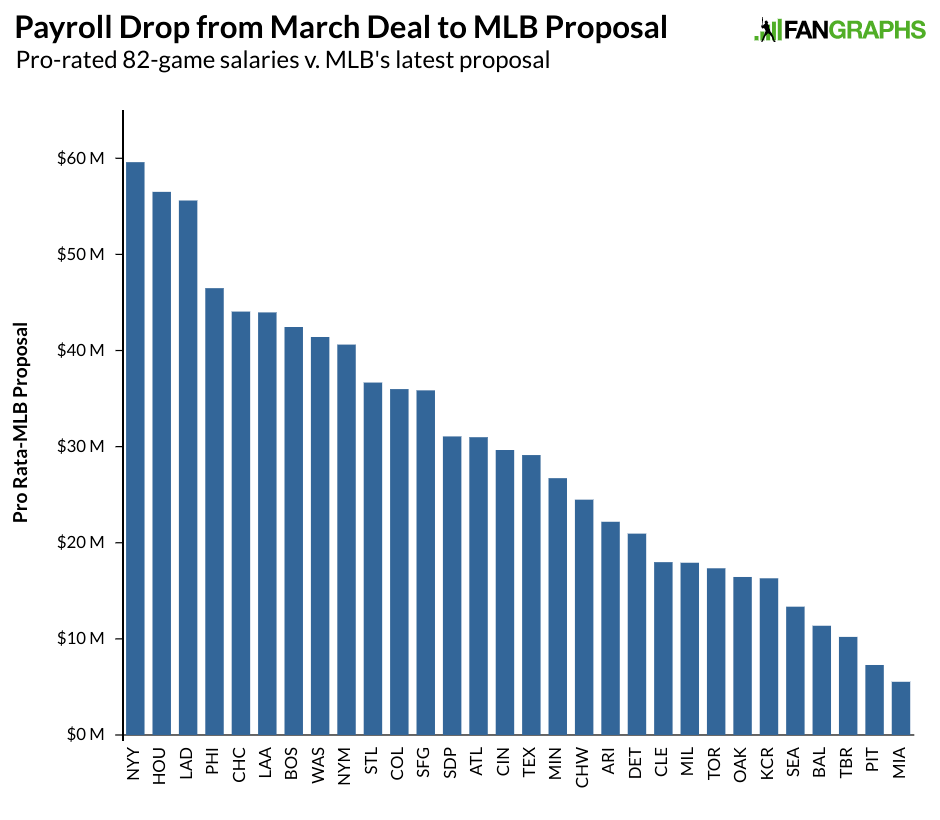
Those teams on the left have the most to gain under MLB’s latest proposal, while those teams on the far right barely see any change to payroll at all. It’s not hard to identify the types of teams in each group. We have the Yankees, Astros, Dodgers, Phillies Cubs, Angels, and Red Sox leading the way with salary cuts while the Marlins, Pirates, Rays, Royals, and A’s are all near the bottom in terms of change. To illustrate the change a little more, here’s a scatter plot showing the change above with Forbes valuations:
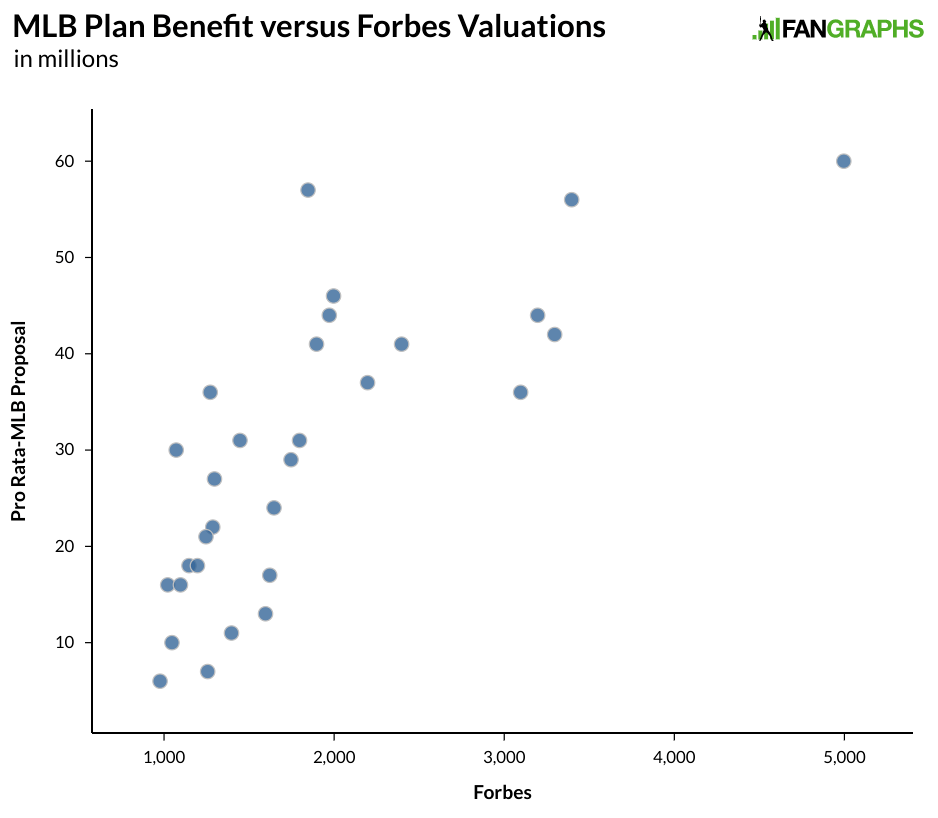
There’s a pretty strong relationship here (the R-squared =.57) and a lot of that is because rich teams spend more. In MLB’s latest proposal, those same rich team receive the biggest benefits. It’s the owners’ of trying to share the lost revenue, except instead of doing it amongst themselves, they are hoping that the players will do it for them. It’s a way that prevents some potentially difficult conversations between Rob Manfred and the owners. If the union response is any indication, the owners are going to need to have some of those difficult conversations in the coming days if they want to have a 2020 baseball season.



Reflections on the 10th Anniversary of Roy Halladay’s Perfect Game

May 29 marks the 10-year anniversary of Roy Halladay’s perfect game against the Marlins. It’s a bittersweet occasion, alas, because while it shows the two-time Cy Young winner and future Hall of Famer at the absolute pinnacle of his career, Halladay is not here to celebrate. On November 7, 2017, while flying his Icon A5 light sport airplane, he crashed into the Gulf of Mexico, landing upside down in 4 1/2 feet of water. The autopsy published two months later found that he had morphine, amphetamine, Ambien, and alcohol in his system. More recent revelations that he had been in and out of rehab to treat addictions to opiates and to an anti-anxiety drug called Lorazepam deepen the already stark contrast between a player who publicly was known for his exceptional control, both on and off the field, but who privately was battling depression.

The anniversary and the absence of its central figure provides a time for reflection. What follows here are 10 thoughts on Halladay’s career and life, one for each year since that special night in Miami’s Sun Life Stadium — or, if you prefer, one for each of his perfect innings plus one for the aftermath. You can watch the game in its entirety below:

1. Halladay nearly threw a no-hitter in his second major league start, and did pitch a complete game.

Chosen with the 17th pick of the 1995 amateur draft out of a suburban Denver high school (Arvada West), Halladay made solid progress through the minors and cracked Baseball America’s Top 100 Prospects in ’97 (23rd) and ’98 (38th). After a strong showing at Triple-A Syracuse in the latter year, the 21-year-old righty made his major league debut on September 20, 1998, throwing five innings of two-run ball with five strikeouts against the Devil Rays. Seven days later, he no-hit the Tigers for 8.2 innings before being foiled by pinch-hitter Bobby Higginson, who homered and also deprived him of a shutout. Halladay did hang on to collect the first of his 203 regular season wins, and the first of his 67 complete games. Read the rest of this entry »


How They Got There: The 2000-2009 NL MVPs

In the decade that began shortly after the historic home run chase many believe saved the game of baseball, it’s no surprise that only one National League player with fewer than 30 homers placed in the top three of MVP voting. In 2009, Hanley Ramirez only had 24 home runs but also had a league-leading .342 batting average to go along with 42 doubles and 27 stolen bases, which pushed him into the mix for NL MVP. He finished in second place, although he didn’t receive a single first place vote.

But as much as home runs were a primary driver in measuring the decade’s hitting success, it would understate the talent of the two players who accounted for seven of the MVP awards between 2001-2009 to define them by that one statistic. They were simply two of the greatest all-around hitters to ever play the game. Here’s a look back at how those two, along with the three other NL MVPs of the 2000s, were acquired.

2000 NL MVP
Rank Name Team Age How Acquired PA HR SB OPS wRC+ WAR
MVP Jeff Kent SFG 32 Trade (CLE) Nov ’96 695 33 12 1.021 159 7.4
2nd Barry Bonds SFG 35 Free Agent (PIT) Dec ’92 607 49 11 1.127 174 7.6
3rd Mike Piazza NYM 31 Trade (FLA) May ’98 545 38 4 1.012 153 5.8

In a span of just over four years, Jeff Kent was traded three times in exchange for an All-Star. In each case, it seems unlikely that the team trading him away believed he would finish his career as a borderline Hall of Famer with 377 career homers, 560 doubles (tied for 30th all-time), and an NL MVP award. Read the rest of this entry »


Wild World Series Tactics: 2012-2014

While Even Year Magic was in full swing from 2012-2014, there were plenty of other great World Series storylines. There was Mathenaging, Yostseason, and even Jon Lester fielding bunts. With such an action-packed set of games, let’s get right to it.

2012

The Tigers brought a mostly-sweet lineup to the table: Austin Jackson was a leadoff beast, Miguel Cabrera and Prince Fielder provided thump from the three and four slots — and yes, Omar Infante batted second in a season where he had a .283 OBP, but they can’t all be perfect decisions. Anyway, Infante had a career OBP of .308, which is — wait, no, that’s still bad. That one’s on Jim Leyland.

The Giants featured the fifth-best offense in baseball, a lineup with almost no holes all the way down, depending on how you feel about Brandon Crawford and Grégor Blanco. In Game 1, that deep lineup overpowered Justin Verlander. There were no key points in the game, no weird decisions — sometimes your dominant pitcher just gets hit. Heck, Barry Zito even had an RBI single. Can’t win ‘em all. Read the rest of this entry »


Examining the Economics of MLB’s Latest Proposal to the Players

On Tuesday, MLB delivered its first economic proposal concerning player pay to the MLBPA since the two sides reached an agreement in March. There were reports that owners had previously agreed to propose a 50/50 split of revenue for what looks to be an abbreviated season played to empty ballparks, but after that potential offer leaked, it was never formally proposed due to the negative public response from the union. MLB’s actual proposal, which includes a paycut for all players from the prior pro-rated agreement in March, was particularly harsh to those making the most money, as the proposed cuts were on a sliding scale with the highest-paid players taking the deepest reductions. Jay Jaffe laid out yesterday why the proposal wasn’t likely to fly with the players, a sense confirmed by Max Scherzer last night:

After discussing the latest developments with the rest of the players, there’s no reason to engage with MLB in any further compensation reductions. We have previously negotiated a pay cut in the version of pro rated salaries, and there’s no justification to accept a 2nd pay cut based on the current information the union has received. I’m glad to hear other players voicing the same viewpoint and believe MLB’s economic strategy would completely change if all documentation were to become public information.

Jeff Passan and Jesse Rogers first reported the proposed salary breakdowns at ESPN:

The formula the league offered, for example, would take a player scheduled to make the league minimum ($563,500), give him a prorated number based on 82 games ($285,228) and take a 10% cut from that figure, leaving him with a $256,706 salary.

The scale goes down as salaries go up, with every dollar:

  • $563,501 to $1 million paid at 72.5%
  • $1,000,001 to $5 million paid at 50%
  • $5,000,001 to $10 million paid at 40%
  • $10,000,001 to $20 million paid at 30%
  • $20,000,001 and up paid at 20%

Read the rest of this entry »


Rangers Prospect Cole Uvila Is a Driveline-Developed Spin Monster

You have to scroll pretty far down our Texas Rangers Top Prospects list to get to Cole Uvila’s name. Befitting his under-the-radar status, the righty reliever is No. 36 in a system that, according to Eric Longenhagen, has a lot of high variance players. None of them are as unusual as Uvila, who at 26 years of age has yet to pitch above A ball.

Not only does his future looms bright — Longenhagen cited “seemingly imminent big league relevance” — Uvila’s backstory is borderline bizarre. Moreover, he boasts a Driveline-developed curveball that features elite spin. We’ll get to that in a moment.

Uvila is coming off a breakout season with the High-A Down East Wood Ducks. In 64-and-two-thirds innings (including seven with Low-A Hickory), the 1,199th pick in the 2018 draft punched out 95 batters and allowed just 34 hits. That was followed by an eye-opening Arizona Fall League campaign that inspired a head-scratching question: “How on earth did this guy last until the 40th round?”

He hasn’t always been a pitcher. The Port Angeles, Washington native was primarily a shortstop in high school, and that was his initial position at Pierce College. By his own admission, he wasn’t a very good one. That led him to the mound, albeit not in a way you might expect.

“I couldn’t hit — I couldn’t catch up to [junior] college pitching — so I ended up getting a shot as a submariner pitcher,” Uvila explained. “I wasn’t dragging my knuckles, but I was low enough that my chest was completely over the rubber. Sidearm is 90 degrees and I was about 45 degrees from the dirt. Anyway, that got me off the redshirt list and onto the field, which was pretty much all I wanted. I never really imagined playing past junior college.” Read the rest of this entry »


Chang-mo Koo Is Always Ahead

Modern baseball writers are a somewhat spoiled bunch. If you’re writing a story about an MLB player, you have seemingly countless resources at your disposal to gather more statistics than you might know what to do with. For example, say that I wanted to write about Cleveland Indians starting pitcher Shane Bieber. His player page on this site lists any standard or advanced metric I could want, along with info on things like how hard he throws his fastball and how often opponents chase his pitches out of the zone. If I see he struck out 259 batters in 2019, and want to know how many other pitchers in the live ball era struck out at least 250 batters in just their second big league season, I can use Baseball-Reference’s Play Index to find the answer. If I want to get more specific, and learn how many times Bieber struck out a right-handed hitter with a breaking ball out of the zone, Baseball Savant’s search feature has me covered there too.

When it comes to writing about foreign professional leagues, however, the wealth of information isn’t quite so grand for the American writer. Sites like MyKBO.net and Statiz are great resources, and our KBO leaderboards tell us a lot of great stuff — like the fact that NC Dinos left-hander Chang-mo Koo 구창모 leads all pitchers in both ERA and FIP after four starts – but if you want to dig into why or how he’s doing that, we don’t have the pitch-by-pitch data to identify things like velocity, spin rate, or how batters are performing against individual offerings. That hasn’t diminished my curiosity about Koo, though, so I used the tools available to me — Twitch and ESPN archives of game broadcasts, a notepad, and my own two eyes — to track his pitches over his first four starts, in the hope that doing so would reveal something interesting. Fortunately, both for myself and my editor who enjoys for me to have story ideas, it did. Read the rest of this entry »
