Behold the Dazzling Defense of Denzel Clarke

I watch a lot of baseball, to the point that you might think it would all seem routine to me. After all, how many times can one person see a monster home run before the achievement loses its luster? Yet, at least for me, that could not be further from the truth. More often than not, the players on the field still find ways to captivate and surprise me. In a league with Aaron Judge, Shohei Ohtani, and Paul Skenes, the unimaginable seems to happen on a regular basis. But early last week, I experienced one of the more jaw-dropping baseball moments of my life, courtesy of Athletics rookie center fielder Denzel Clarke in a game against the Angels.
I wasn’t the only one either. The whole baseball was excited about Clarke’s catch. Martín Gallegos of MLB.com talked with Clarke and his peers about it. In the Wall Street Journal, Jared Diamond used the catch as the hook to tell a more in-depth story about Clarke. Sam Miller covered Clarke’s two-and-a-half week progression of dealing with the wall over on his Substack, Pebble Hunting. And, of course, last week Ben Clemens led his Five Things column with Clarke and the catch. If you’re like me and can’t get enough of the catch, you should check out all four of these pieces.
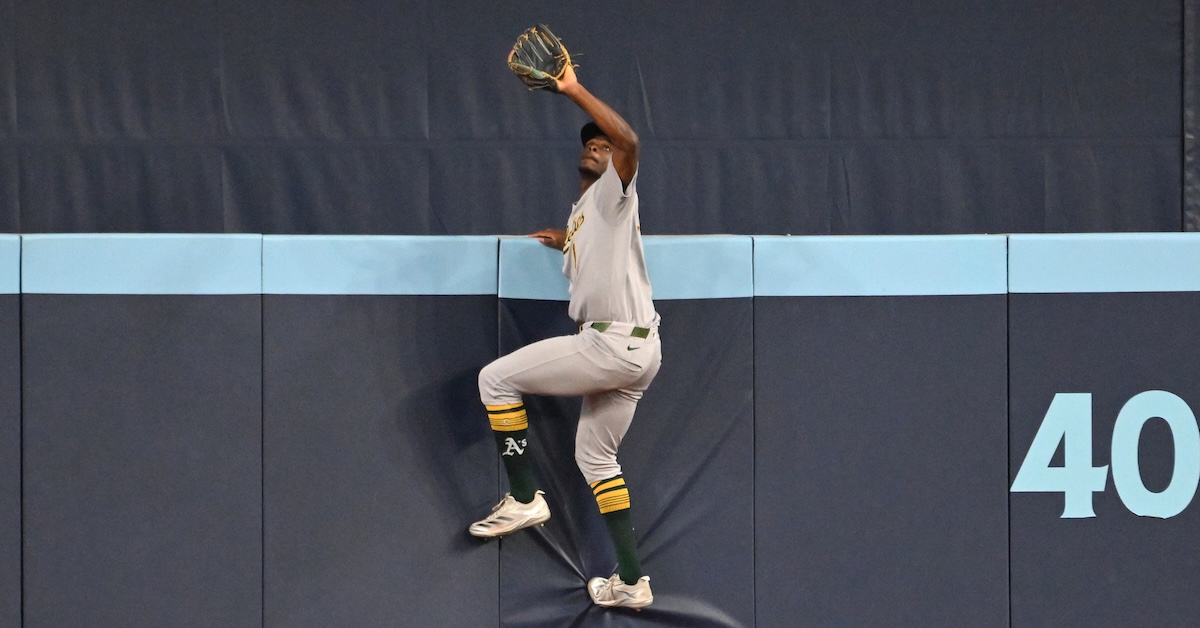
So, about that catch… Clarke channeled his inner Spider-Man by scaling the Angel Stadium wall, catching the ball, and gracefully protecting his body on the way down, finishing with a perfectly symmetrical two-foot landing. The athletic ability is no surprise, given he was doing this last fall in Arizona. The little things, though, are great to see from an early development perspective. The entire play is a perfect demonstration of everything that Clarke excels at defensively — burst, route, deceleration, wall awareness — in addition to the acrobatics. I’m going to break it all down here today. But first, I want to make sure we’re all on the same page about how good Clarke has been on defense to start his young career. Let’s start with the outfield OAA leaders this season:
| Player | Outfield Innings | OAA |
|---|---|---|
| Pete Crow-Armstrong | 655.2 | 13 |
| Ceddanne Rafaela | 601.1 | 10 |
| Denzel Clarke | 191.2 | 9 |
| Victor Scott II | 590.2 | 9 |
| Julio Rodríguez | 636.0 | 8 |
| Fernando Tatis Jr. | 593.2 | 8 |
| Harrison Bader | 480.0 | 7 |
| Michael Harris II | 641.1 | 6 |
| Kyle Isbel | 495.2 | 6 |
| Jake Meyers | 594.2 | 6 |
Clarke has played in 24 games and has 9 OAA, which is tied for third best among outfielders. The two players ahead of him — Pete Crow-Armstrong and Ceddanne Rafaela – have both played over 400 more defensive innings than him. Basically, almost every time Clarke has attempted a play that most other outfielders wouldn’t have made, he’s caught the ball.
Having 95th percentile speed is certainly a major part of that, but as we know, speed alone doesn’t make an elite defensive outfielder. To understand the other pieces of Clarke’s defensive game, we have to watch some video. Where better to start than with the Spider-Man catch.
With Grant Holman on the bump and Nolan Schanuel at the plate with no runners on, Clarke has a standard alignment. On a 1-0 pitch, Schanuel gets a splitter over the heart of the plate and puts as great swing on it, launching the ball 29 degrees at 102 mph to left-center field. Let’s watch it again:
Man, there are so many things to unpack with this play. Clarke is already at full speed by the time the camera cuts to him. He has the third-best burst in the majors, meaning that once he gets going in his route, he is absolutely cooking to get to the ball. Clarke’s reaction metric is actually only around average compared to other outfielders. What he does is a common strategy many fielders employ when tracking down fly balls: He waits a split second to find the ball to make sure he’ll take a more efficient route. From there, he accelerates to the spot where the ball is going.
After the jump, outfielders need to determine where they are relative to the ball and the wall, and then adjust their speed accordingly. Here, Clarke steals two quick looks after sprinting for several steps. First, he flicks his head around to look for the warning track; then, after a few more steps, he flicks his head around again, this time to find the wall. These glances force him to slow down and be more under control as he attempts to make the catch, which is especially important on this particular play, when he not only has to track the fly ball but also scale the wall.
His elite burst, efficient route, and poised deceleration give him a chance to make the play. Pure athleticism does the rest.
With a few choppy steps on the warning track, he gets in the perfect position to propel his body up and over the wall. He then grabs the top of the wall with his throwing hand to steady himself. Simultaneously, he extends his left arm, snags the ball, and rotates his upper body to protect is shoulder and halt his momentum so he and the ball don’t end up on the other side of the fence. He continues his clock-wise turn and rolls off the wall to land smoothly with two feet on the ground, then pops up to celebrate his absurd accomplishment.
Clarke dazzles on defense even when he’s not robbing home runs. I am most impressed with his proficiency on low line drives. These may seem fairly straightforward, but they are among the more difficult plays for outfielders. On an episode of his Bleacher Report podcast, On Base, from last week, Mookie Betts spoke with guest Jackson Merrill about a number of baseball topics, including Clarke’s catch. During the conversation, Merrill, a converted shortstop in his second year as a center fielder, said line drives are the most difficult batted balls for him to field. This is a common sentiment among outfielders. You have less time to read the flight of the ball and determine its trajectory; hesitation can lead to extra bases. So outfielders have to make a decision quickly and stick to it — and they need to be correct. Here are some examples of liners that Clarke has tracked down so far this season:
That first one, hit by Nick Castellanos, looks destined for the gap, but with a quick read and a straight route to the ball, Clarke catches it with ease. He recognizes the ball is looping a little, meaning he has a bit more time to cut it off in the air. If it’s hit slightly harder or with less arc, maybe he wouldn’t attempt to catch it, instead opting to head for the wall and play the carom.
Or maybe, considering how Clarke approaches the scorchers off the bats of Taylor Ward (second liner) and Bo Bichette (fourth), he’d run faster and make the play anyway. He looks just as comfortable snatching those two would-be extra-base hits, each rocketed over 105 mph.
He can afford to do this because of how quickly he can slow down. See how he overruns Ward’s line drive? That would be disastrous for most outfielders, but not for Clarke. He’s sprinting to his right, then suddenly decelerates with a slide and reaches back to his left. And he can do this in all directions.
The best outfielders are often the ones who aren’t afraid to sacrifice their bodies. Clarke is no exception, but he also isn’t reckless; he knows how to dive in a way that limits his injury risk. Watch the third play in the video above, when he dives forward as he comes in on the ball. Notice how he catches the ball in the center of his body. This allows him to make the catch with his hands facing upward so his wrists and shoulders are less exposed, thereby preventing awkward landings that could lead to jammed joints, torn ligaments, and broken bones.
Clarke’s defensive skills are so advanced that the A’s are willing to run him out there even as he struggles mightily at the plate. The good news, as Ben noted in last week’s Five Things, is Clarke was a productive hitter in the minors, and maybe he just needs time to develop at the big league level. I really hope that’s the case, because it’s such a treat to watch him play center field.