There are some positions for which a cleaner, wider gap exists between the top teams and the bottom, where we can more definitively say that some teams are better than others. For instance, the combination of talent and depth that the Dodgers, Phillies, and Braves have in their starting rotations separates their projections from the rest of baseball in a meaningful way. Relief pitching is not one of these positions. As you digest the forecasts and player details below, make sure to note how thin the margins tend to be from one team to the next. Also know that relief inning sample sizes are small enough that this is where WAR is the least good at properly calibrating impact and value, a dynamic heightened in the playoffs when the remaining bullpens are all turbocharged by the way the postseason schedule allows for rest, or for an elite starter to work an inning on his bullpen day. Things like coherent managerial usage, roster management, and good or bad health luck tend to play a huge role in the way bullpens perform throughout a season, and those are factors we can’t totally control for here. Read the rest of this entry »
After an impressive rookie season for the Rockies in 2023, Nolan Jones struggled mightily last year, missing roughly two and a half months due to recurring lower back woes and a left knee injury, and slipping below replacement level when he was able to play. On Saturday, the Rockies traded him back to the Guardians — the team that originally drafted and developed him — in exchange for superutilityman Tyler Freeman. It’s puzzling to see the Rockies punt a player who just a year ago appeared to be a franchise cornerstone, particularly as their acquisition of Freeman is driven by the loss of starting second baseman Thairo Estrada to a broken wrist, a short-term problem considering Colorado is unlikely to contend this season.
The 26-year-old Jones hit just .227/.321/.320 (70 wRC+) with three homers in 297 plate appearances for the Rockies last season while splitting his time between left and right field. His 67-point drop from his 137 wRC+ in 2023 tied for the second largest in the majors:
While Jones has shown that he can be a productive major leaguer, the same can’t yet be said for the 25-year-old Freeman, who hit .209/.305/.321 with seven homers in 383 PA for the Guardians last year while mainly playing center field but spotting at second base, shortstop, and third base. His 84 wRC+ was his highest mark in parts of three major league seasons, which isn’t saying much. Read the rest of this entry »
After wrapping up our position player rankings last week, we turn our attention to the league’s pitchers, starting with the bullpens in the bottom half of the reliever rankings.
It’s impossible to project relievers. The pitchers themselves are random enough, sprouting new pitches or gaining five ticks on their fastball with no prior warning. Pitchers also tend to get injured, especially the ones who go max effort on every pitch. And then there’s the randomness of 60-inning samples, where a fly ball sneaking just past the glove of a leaping outfielder can catapult an ERA from respectable to disastrous. This is all to say that the task of forecasting a bullpen’s performance over the course of a single year is destined to fail.
So I’ll take this introduction as an opportunity to encourage you to not take the order of these rankings too seriously. Less than one-tenth of a win separates some of these teams. There is perhaps just one truly terrible bullpen in the mix; every other team essentially has a mix of proven shutdown guys, solid middle-inning depth, and intriguing wild cards. With that said: To the rankings! Read the rest of this entry »
Gary Cosby Jr.-Tuscaloosa News-USA TODAY NETWORK via Imagn Images
Another weekend of college baseball is in the books. We saw some interesting midweek upsets, including the top-ranked Tennessee Volunteers losing to East Tennessee State. No. 4 Georgia swept no. 13 Florida, Virginia Tech’s head coach John Szefc recorded his 600th win, and UNC Wilmington freshman Cam Bagwell threw a seven-inning perfect game in a run-ruled 12-0 win over Campbell.
Today’s draft notes start off with three draft-eligible sophomores, followed by two smaller-school prospects. It’s more likely than not that these sophomores will choose to stay in college for another year to boost their stock, though it’s still worth following their progress throughout the spring.
Zane Adams, RHP, Alabama Weekend Line: 6.1 IP, 6 SO, 1 BB, 5.71 ERA
Zane Adams came out on top in his duel this weekend with Tennessee’s Liam Doyle, going 6 1/3 innings while allowing four runs, as Alabama won its Thursday game 6-5. This wasn’t a flash in the pan, as Adams has been one of the better pitchers in the SEC this year, logging a 3.56 ERA in his six starts.
From a stuff perspective, Adams is pretty generic. His fastball sits 88-92 mph, touching 96 with some run, and is thrown from a steep angle. He goes to his curveball and changeup fairly equally at about 15% of the time each. His curveball averages 77 mph, with a 1-7 shape that has plenty of depth. The changeup is a tad harder, more in the 78-81 range, with some late fade that plays well against righties. He also mixes in a cutter in the mid-80s. No one pitch stands out, but he has above-average command of his pitches and they perform better than expected.
Mechanically, it’s a low-effort delivery that he repeats well and gives him the ability to throw strikes. He throws from a high three-quarters arm slot that presents a steep plane on all of his pitches. His front leg cuts off all of his momentum when it lands, and if he cleans this up, he’ll likely add more velocity than what he’d naturally gain from maturing physically. Overall, he projects as a low-volatility back-end starter who has some lower hanging fruit that a team like the Yankees or Dodgers could optimize well.
Antonio Jimenez, SS, Central Florida Weekend Line: 10 AB, .400 BA, 1 3B, 2 SO, 1 BB
Antonio Jimenez is off to a hot start this year for the Knights, slashing .307/.424/.493 in 92 plate appearances across 22 games. This is coming after a freshman season at Miami where he played in 45 games but hit only .182 with 36 strikeouts in 122 plate appearances. He followed up that stint with a mediocre appearance on the Cape that had a lot of whiffs as well. So far, Jimenez appears to have righted the ship, and in the process he’s anchored this UCF team to a strong start to the season.
Most college shortstops are favorites to move off the position as a professional, but Jimenez is a favorite to stay. This is in large part due to his double-plus arm, which lets him throw out hitters on grounders while going well to his backhand. Arm aside, he shows above-average range and decent actions at shortstop, which put together make for a decent shortstop defender. At 6-foot-1 and 200 pounds, he’s more physical and a bit stiffer than your average shortstop, which adds risk, but the team that drafts him will likely give him a long runway before moving him off the position. With his arm strength, he could easily slide over to third or play right field to add more positional versatility.
His offensive profile is murkier. At Miami, he chased and whiffed around 30% of the time, which is not particularly good, though he was a freshman. He switch-hit, but didn’t really look comfortable on the left side and whiffed a ton, so he’s dropped that portion of his game and is now just a righty hitter. The results are more promising this year with whiff and chase rates in the lower 20s. Part of this could come from just focusing on being a righty hitter, part of it could be just maturity and playing somewhat weaker competition. Jimenez doesn’t really have problems with velocity; the bigger issue has been offspeed pitches. That trend hasn’t shifted, but he’s gotten better overall at making contact. Aside from the whiff rate, Jimenez shows above average power and is able to lift the ball enough to make use of it. It’s an exciting profile, and I could see a team taking him early Day Two and signing him if his improved whiff rate holds.
Cam Tilly, RHP, Auburn Weekend Line: 1.0 IP, 3 SO, 0 BB, 0.00 ERA
Cam Tilly had draft interest coming out of high school, but after he set his price higher than what teams were comfortable paying, he ended up going to Auburn instead. Since then, he has been a mainstay in the bullpen. As a freshman, Tilly logged 24 1/3 innings with a 6.31 ERA and 27 strikeouts, a fairly standard stat line for a freshman who gets SEC playing time. This season, he’s remained in a bullpen role where he has pitched 15 1/3 innings with a 4.11 ERA and a 20.3% K-BB%.
Tilly is primarily a fastball/slider pitcher, with a changeup as his third pitch. His fastball sits in the 91-93 mph range with arm-side run, a tick higher than where he was sitting as a high schooler. Tilly’s slider is his best pitch, with a two-plane shape and more horizontal and vertical movement than the average slider while still having bite to it. He spins it up to 3,000 rpm. For his changeup, Tilly utilizes a splitter, which sits in the 84-86 range and features short, hard break.
His command of his pitches is erratic at this point, but his straightforward delivery and clean arm action should lend to better command as he ages. Tilly is high-waisted with a sturdy lower half, and at 6-foot-2 and 210 pounds, there isn’t much projection left. There’s room to add another tick of velocity, but further gains will come more in the command and splitter-refinement area. He has the stuff to be drafted, but because he has another year of eligibility, it seems unlikely that a team would draft him with the expectation that he’d sign unless he begins to start more this season. My guess is that Tilly chooses to stay an extra year at Auburn to show that he can be a starter and sign for more money upon getting drafted in 2026.
Ryan Wideman, OF, Western Kentucky Weekend Line: 11 AB, .273 BA, 1 HR, 4 SO, 2 BB, 2 SB
Western Kentucky is off to a strong start to the season, in large part because of Ryan Wideman. A JUCO transfer from Georgia Highlands College, he is hitting .465/.513/.832 with six home runs, nine walks, and 18 strikeouts in 115 plate appearances over 24 games.
At the plate, Wideman has shown himself to be an effective hitter despite some quirks. He’s loose in the box, and alternates between a big leg kick and a small toe tap from a wide base. He flashes plus bat speed with a top-hand-dominant swing that is long, but to this point hasn’t affected his ability to make contact. His whiff rates are average, which is impressive given his extremely aggressive 45% chase rate. This isn’t an early-season aberration; it’s a figure in line with what he posted at Georgia Highlands. Chasing that much against mid-major competition is concerning, and it’s not feasible for him to have this approach and keep his whiff rate down against pro pitching. From a power perspective, he currently boasts average power, but considering he’s a lean 6-foot-5 and 200 pounds, he’s likely to add more pop as he fills out.
Defensively, Wideman has the makings of an above-average center fielder (plus runner, solid arm), but both his route quality and feel for the position are below average right now. He’s taller than most center fielders, and eventually he projects to grow off of the position, but it’s worth it for a pro team to keep him in center for as long as possible because the raw traits to play center field are there.
Overall, the chase rate might end up being a “No” for some teams, but his projectable frame, twitchiness and bat speed are appealing. Late Day Two is probably the ceiling for where he gets picked, and it’s more likely that he goes in the Round 11-13 range.
Riley Kelly, RHP, UC Irvine Weekend Line: 5.1 IP, 6 SO, 2 BB, 0.00 ERA
It’s incredibly rare for a California prep prospect to be unknown given the vast scouting resources allocated to the state, but that’s exactly what happened to Riley Kelly, who popped up in the spring of 2022. Heading into his senior year of high school, with his velocity sitting 84-87 mph, he decided to stop playing football and concentrate on baseball. From there, he increased his velocity to the 88-92 range and paired it with a 3,000-rpm curveball. He got his first college scholarship offer later in the fall, and by the end of his high school career, his starts had numerous professional scouts in attendance. The Diamondbacks selected him in the 20th round of the 2022 Draft, but he decided to go to UC Irvine.
Kelly was limited to just three innings as a freshman due to injury, and then logged 17 innings last season as a redshirt freshman. He started the 2025 campaign in the bullpen, but he’s since made two starts, one in each of the past two weekends. He has a 3.13 ERA with 23 strikeouts and 11 walks in 23 innings pitched.
Discussion of his arsenal starts with his curveball, which he can really spin. The pitch sits in the low 80s, with plenty of depth and hard bite to it. It gets whiffs but needs some refining; Kelly doesn’t have a ton of feel for landing it in the zone, and hitters have been able to lay off it effectively. Kelly’s primary pitch is his fastball, which is now sitting 92 mph and topping out at 95. It’s vertically oriented with a bit of cut; it doesn’t get as many whiffs because he throws it from a steeper angle. His changeup is a work in progress, but it has some nice fade every once in a while.
His control has been hit or miss. He struggled with walks early in the season, but he’s settled in over his last few outings. At 6-foot-4 and 240 pounds, there isn’t much projection here physically, and while he is a late bloomer from a skills standpoint, I don’t think that changes his projection. Ultimately, Kelly projects to be a single-inning reliever, the role in which he can use his breaking ball most effectively.
In which ways would a fully-implemented Automated Ball-Strike System [ABS] impact pitching? According to a coordinator I spoke to, one effect could be a further increase in the number of power arms who can get away with attacking the middle area of the zone. Conversely, crafty finesse types will become even less common, as getting calls just off the corners will no longer be possible.
Count Chris Bassitt among those not enamored with the idea.
‘“If you go to a full ABS system, you’re going to develop more throwers and the injury rates are going to spike,” opined the 36-year-old Toronto Blue Jays right-hander. “Then you’ll have to go back to pitching. The only way to stay healthy is to pitch. That’s never going to change in our sport. No matter how many people want to do something different, you have to pitch. There are obviously a number of facets for why people get hurt at the rate they’re getting hurt, but the answer for the injury history of the sport for the last five, ten years is more throwers. I don’t agree with it.”
For some teams, designated hitter is a position, to be filled by a specific type of player with specific attributes, just like shortstop or center field. For others, it’s Purgatory, a way station for forgotten men who don’t hit well enough to hold down a regular lineup spot or don’t field well enough to play anywhere else. It should be very obvious from the tables below which teams fall into each of the two categories. Read the rest of this entry »
As spring training nears its conclusion, a few unsigned free agents have finally found homes. At best only one of these players will be ready for the majors in time to make the Opening Day roster, and all of them struggled to at least some extent last year, but at the very least, they’ll get another chance to extend their careers by providing depth to organizations hit by injuries. A double whammy of bad luck within their rotation has led the Rangers to sign lefty Patrick Corbin, while the Braves have triple dipped into the pool to sign catcher James McCann, outfielder Alex Verdugo, and reliever Craig Kimbrel.
On Tuesday, March 11 — the day I checked in on the Rangers in the wake of Jacob deGrom’s Cactus League debut — righty Tyler Mahle was scratched from his scheduled start due to forearm soreness, though he was able to take a start against minor leaguers on March 13 and returned to big league action on March 19. Texas wasn’t so lucky when it came to lefty Cody Bradford, who was scratched from his scheduled March 12 start due to left elbow soreness. He’s been shut down from throwing for four weeks and ticketed for the 15-day injured list to start the season; barring any further setbacks, a full buildup would bring him back in mid-May. Then on March 15, righty Jon Gray was hit by a line drive and suffered a fractured right wrist that knocked him onto the 60-day injured list. The break is clean enough that he won’t need surgery, but he’ll be out until at least June.
Given those injuries — and assuming no other ones occur — the Rangers are on track to start the season with an all-righty rotation consisting of Nathan Eovaldi, deGrom (who threw a mere 10 2/3 innings for the Rangers last September after returning from his second Tommy John surgery), Mahle (who threw just 12 2/3 innings between his return from Tommy John surgery and a season-ending bout of shoulder tightness), and former first-round picks Kumar Rocker and Jack Leiter, who each made their debuts last year. Rocker made three starts totaling 11 2/3 innings while pitching reasonably well, but Leiter was lit for an 8.83 ERA in six starts and three relief appearances totaling 35 2/3 innings. Read the rest of this entry »
Eric A Longenhagen: Hey everyone, starting early because I have much to do and there are already lots of questions in the queue.
12:00
Eric A Longenhagen: My work slate: James Fegan and I are working to wrap up to Blue Jays list, which will run early next week when Meg has the bandwidth to do something other than just PPRs. After that I’ll be solo’ing the Orioles list. I’ve been on a backfield or two every day this week to lay track for the lists that will follow Baltimore: CLE, LAD, CHW, CIN, MIL…
12:01
Eric A Longenhagen: I’m writing my PPR (relievers) and my chunk of a Bold Prediction post, both of which will also run next week.
12:01
Eric A Longenhagen: I might cut short chat at like 45 min today because I’m going to start my day at either Camelback Ranch or in Maryvale and then wrap it in Maryvale for the night big league game, and I’ve gotta write betwixt and between those.
12:02
Birds: Zach Fruit has had two pretty impressive spring outings, the second against a lineup of BOS regulars. Stuff+ grades strong from public models. Can he stick as a starter?
12:02
Eric A Longenhagen: Fruit’s stuff is way up (one of a couple Orioles for whom that is true) and he’s been sitting like 97. Looks reliever-y to me, but it’s great that his stuff is up this much.
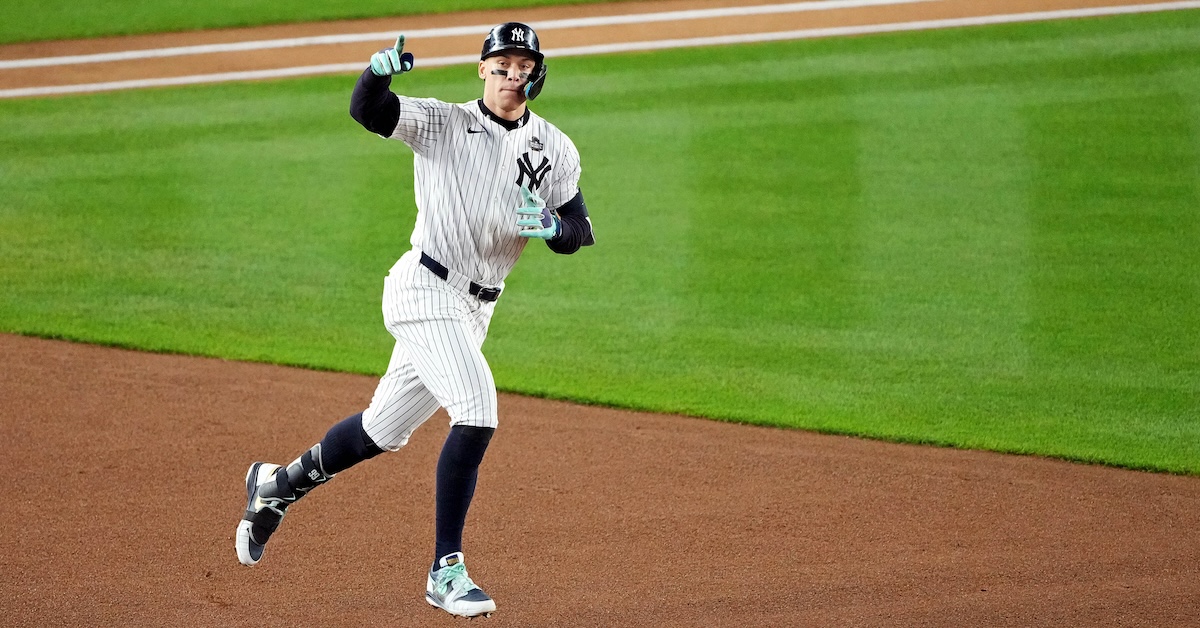
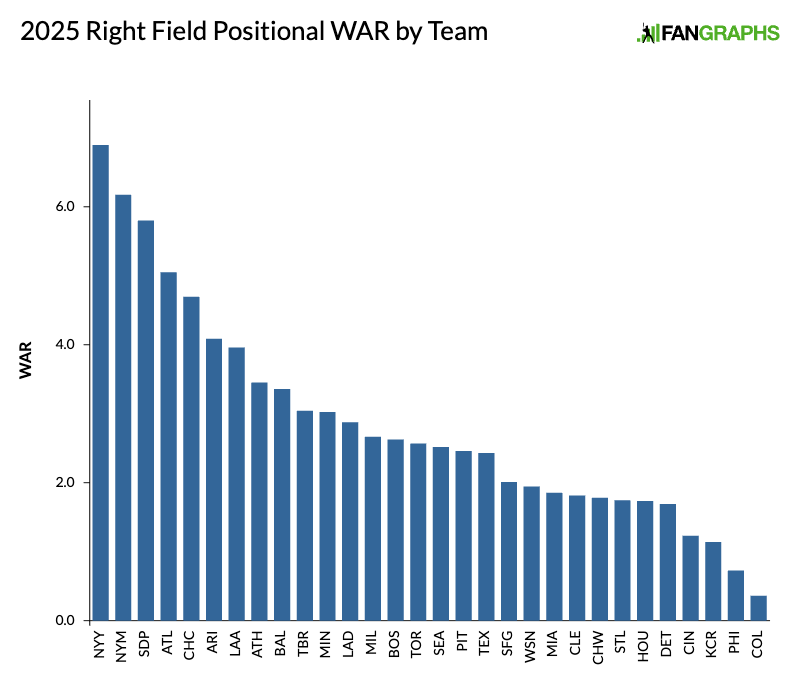
Want to hear something crazy? Aaron Judge is switching back to right field after an 11.2-WAR campaign, but this year’s top right field projection is still nearly half a win below last year’s. There is obviously some logic behind this: Last year, Ronald Acuña Jr. was younger than Judge and was coming off his own monstrous 2023 campaign. He also plays for a team with a penchant for driving its starters until the wheels fall of, so we had him projected for nearly every single plate appearance. But still, with Judge in right field again, we should probably expect bigger things. The Yankees’ right field projection trails only one other position player spot, Kansas City’s (and Bobby Witt Jr.’s) shortstop projection, and it trails by just one-tenth of a win. Read the rest of this entry »
Dylan Cease was 21 years old and coming off of his first full professional season when Eric Longenhagen evaluated him for our Chicago Cubs Top Prospect list in January 2017. Cease was then ranked seventh in the system, with Eric assigning him a 45 FV and suggesting that he was more likely a reliever than a starter down the road. Cease has obviously followed a more successful path. Now 29 and about to begin his seventh big league season, and second with the San Diego Padres, the right-hander has been a top-shelf starter for four years running. Over that span he has toed the rubber 130 times — no pitcher has started more games — and logged a 3.52 ERA and a 3.32 FIP. Twice he’s finished top four in the Cy Young Award voting.
What did Cease’s 2017 FanGraphs scouting report look like? Moreover, what does he think of it all these years later? Wanting to find out, I shared some of what Eric wrote and asked Cease to respond to it.
———
“Cease has done an admirable job at quelling what was once a violent head whack while still retaining the kind of velocity that made him an exciting prep prospect.”
“That sounds kind of like an old-school baseball thing,” Cease responded. “But… I don’t know. Maybe that was a thing? I know that I had a very long arm stroke. I’d have to see video, but I don’t recall it being like crazy violent. Usually, if you’re a starter you’re not too violent. Maybe it was, but my having very long arm action was the most memorable thing.”
“He was also flashing a plus curveball in the 79-81 mph range during instructs, but the pitch is more consistently average and, at times, below when it featured an easily identifiable, shapely hump out of his hand.”
“It’s funny, because there was no Trackman data,” Cease said. “If it was today, it would be like, ‘It’s moving at 15 or 18,’ or whatever. But yeah, while my curveball is pretty good, it’s never been my biggest swing-and-miss [pitch] or anything like that. So I would say that was probably fairly accurate; it did pop out sometimes. I actually don’t [throw a curveball] as much anymore.”
“There are several concerns about Cease, ranging from his size to his command to a lack of a third pitch; he has very little changeup feel right now.”
“That’s never changed, the changeup part of it,” Cease agreed. “I’ve never really been a plus-command pitcher either. I have my spurts, but for the most part it’s just getting my good stuff in the strike zone. I’ve also never been the biggest, but here we are.”
“Cease actually pitches with a good bit of plane when he’s working down, because of his vertical arm slot.”
“That sounds right,” he replied. “My slot is the same now, but with shorter arm action. I feel like that changed in my first or second year in the big leagues. It just happened. I was working on my lower half, and for whatever reason it just kind of played out that way.”
“His fastball has enough life to miss bats up in the zone when he’s missing his spots.”
“I think that’s just saying when I’m throwing heaters up in the zone, even if they’re out of the zone, sometimes I get the swings and misses,” Cease reasoned. “Basically it’s got good life. As for [the part about missing spots], honestly, I think I was just trying to throw it over; I was just trying to get it in the zone.”
“I’ve gotten a Yordano Ventura comp on Cease — undersized, hard-throwing righty with good curveball feel.”
“That’s pretty good,” Cease said with a nod of the head. “I mean, Yordano threw a little bit harder than me, but we both had lively arms.”
“He projects as a potential mid-rotation arm if the changeup and command improve, but he’s more likely to wind up in relief.”
“I do remember seeing that a lot as a young player, the bullpen aspect,” Cease recalled. “But yeah, pretty much it was, am I going to develop a third pitch, or get one or two pitches that are swing-and-miss, that can buy me multiple times through the order? I added a slider, which I didn’t have at that point. So I added my best pitch. I always had the velo, and if you have two good pitches you can kind of sprinkle in everything else and have them essentially play off each other. That’s worked out for me.”