Archive for Featured Photo

Just How Hot Has Cody Bellinger Been?

By now, most baseball fans are probably aware of Cody Bellinger’s start to the 2019 season. Through 31 games and 132 plate appearances, Bellinger has put up an almost-immortal .431/.508/.890 slash line, with a 256 wRC+, swatting 14 home runs, drawing 19 walks and striking out just 15 times.

He’s leading baseball in batting average, on-base percentage, slugging percentage, wOBA, wRC+, home runs, RBI, and runs scored. (He’s even stolen five bases so far this year, good for 15th.) As the calendar has now officially turned, Bellinger has tied the record for most home runs before May 1, and has set the record for most RBI before May 1.

Now, this season, baseball’s March 28 Opening Day was the earliest that it has been in history, giving Bellinger (and, Christian Yelich, who also tied the home run record) a few more games than their historical counterparts to set these marks. And, as we know, more games equals more opportunities to pad one’s numbers, especially counting stats like home runs and RBIs.

(Warning: I’m about to talk some about RBI. I also know that RBI isn’t an especially illuminating stat. I am writing about this for historical sake, so just bear with me.)

Consider this: Bellinger set his RBI record on April 29, his 30th game of the season. Mark McGwire and Juan Gonzalez — who previously shared the RBI-prior-to-May-1 record with 36, each doing so in 1998 — had only played 25 and 24 games, respectively, upon reaching that pinnacle. Read the rest of this entry »


How Hitters Are Fighting Back Against Rising Strikeouts

Over the last decade, hitters have been fighting a losing battle against incredibly talented pitchers who throw at higher velocities with even more effective offspeed and breaking pitches. Faced with the increase in talent and velocity on the pitching side, position players have done their best to adapt. The emphasis on launch angle, so as to hit balls harder and farther to get an extra base hit, is a fight against hitters’ inability to take the ball the other way or string together rallies, which are increasingly blunted by the strikeouts. Hitting an 89 mph fastball on the outer edge of the plate to the opposite field is a strategy that might work well. Unfortunately, those 89 mph fastballs aren’t as prevalent as 89 mph sliders that dart away from the outside corner and the fastballs that are routinely in the mid-90s. Hitters are continuously adapting to changes in pitching in order to be successful, and this season, they are getting better by not swinging.

Hitters tend to get some blame for their role in there being fewer balls in play, what with the proliferation of strikeouts and homers and three true outcome players who seek walks and power and have a willingness to swing and miss, but much of what hitters do is simply react to what pitchers do. The increase in strikeouts over the years isn’t due to hitters actively choosing to strike out, but to pitchers who have gotten much better at striking hitters out. When I looked at the issue last season, the rise in strikeouts was due to primarily two factors: the increase in the number of pitches at 95 mph or greater, and the increase in the use of non-fastballs to get hitters out. It’s hard to catch up to velocity, and it’s really hard to lay off breaking and offspeed pitches. This season, pitchers are still throwing hard, and as Ben Clemens demonstrated, they are throwing even fewer fastballs.

To go along with the increased use of non-fastballs is an accompanying decrease in pitches in the strike zone. The graph below shows the number of fastballs and non-fastballs in the strike zone over the past few years. Read the rest of this entry »


Daily Prospect Notes: 4/30/19

These are notes on prospects from lead prospect analyst Eric Longenhagen. Read previous installments here.

I’m going to eschew minor league lines from last night to talk about the players I saw in the Northeast over the last week. My trip prioritized draft coverage but included some pro stuff due to rain.

Let’s start with Navy righty Noah Song who, like former Air Force righty Griffin Jax before him, has a military commitment that complicates his draft stock. In May of 2017, the Department of Defense changed a policy which had only been in effect for about a year, that allowed athletes at the academies to defer their service commitment in order to pursue professional sports.

Jax has been able to continue pitching after he was accepted into the World Class Athlete Program, which enables military athletes who fit certain criteria to train for the Olympics full-time. This only recently became an option for baseball players, as baseball will once again be an Olympic sport in 2020. The exemption grants a two-year window for training prior to the Games. Considering that it took Jax several months to apply and be accepted into the program, this avenue is probably too narrow for Song. Read the rest of this entry »


Marcell Ozuna is Driving Pitchers Up the Wall

When I last checked in on Marcell Ozuna, the Cardinals’ left fielder had just etched himself into blooper reels for an eternity with his epic misplay of a Kiké Hernandez fly ball. Since then, however, Ozuna has atoned for his mistakes with some of the hottest hitting this side of Cody Bellinger. After a disappointing debut season in St. Louis, he’s become a centerpiece of a revamped Cardinals’ lineup that has powered the team to the best record (18-10) in the National League.

The Cardinals acquired Ozuna from the Marlins in exchange for a quartet of prospects on December 14, 2017, just days after their attempt to trade for Ozuna’s teammate, Giancarlo Stanton, fell through. Though he had earned All-Star honors for the first time a year before, Ozuna was coming off a breakout 2017 in which he’d set across-the-board career highs with 37 homers, a .312/.376/.548 line, a 144 wRC+, and 5.1 WAR. He had not only made his second All-Star team, he’d won his first Gold Glove. He looked to be a significant addition to the Cardinals’ lineup, but hit just .260/.308/.337 with three home runs and a 76 wRC+ through the end of May. Ozuna eventually heated up, hitting .290/.334/.482 (120 wRC+) with 20 homers over the remainder of the season, with a wRC+ of 133 or better in three of the final four months. Still, his overall 106 wRC+ and 2.7 WAR represented significant drops from 2017, ones that stuck out like sore thumbs on a team that fell three games short of a Wild Card spot.

To be fair, Ozuna spent much if not all of 2018 battling tendinitis and an impingement in his right shoulder, more or less maintaining his uptick in production in either side of a 10-day stint on the disabled list at the end of August. The injury eroded his arm strength to the point that his outfield throwing speed ranked last according to Statcast, and, by his own account, he struggled to hit pitches on the inside part of the plate. Read the rest of this entry »


Kris Bryant May Have Turned the Corner

The past weekend was a very good one for Kris Bryant. While helping the Cubs take two games out of three in Arizona, he sandwiched his second and third home runs of the season around a rally-sparking double. It’s the first time in nearly a year that the former MVP has connected for extra-base hits in three straight games, and after a season marred by left shoulder woes, a possible sign that his power is returning.

Facing the Diamondbacks’ Robbie Ray in the third inning on Friday night, Bryant hammered a 3-2 fastball over the left centerfield wall for a two-run homer:

The home run went an estimated 444 feet and had an exit velocity of 111.1 mph according to Statcast, making it Bryant’s hardest-hit homer since July 16, 2017 (113.0 mph off Ubaldo Jimenez). It’s also the third ball this year that Bryant has hit with an exit velocity of at least 110 mph, two more than all of last season, the least productive of his career.

Bryant’s second homer, a two-run opposite field shot off Luke Weaver, was less majestic (102.0 mph and an estimated 374 feet), but every bit as necessary in the Cubs’ 15-inning, 6-5 win:

The last time Bryant collected extra-base hits in three straight games was May 16-19 of last year, the last a date that figures prominently in our story. He had just two other streaks running at least that long in 2018, compared to six in each of the previous two seasons.

To review: from 2015-17, Bryant was one of the majors’ top players, batting .288/.388/.527; his slugging percentage and 94 homers both ranked 16th in the majors, while his 144 wRC+ ranked 12th, and his 20.6 WAR was third behind only Mike Trout (25.8) and Josh Donaldson (21.8). During that time, he won the NL Rookie of the Year and an MVP award, and helped the Cubs to three straight postseason appearances, including their first championship since 1908.

The first seven weeks of 2018 surpassed even that high standard (.305/.427/.583, 169 wRC+, eight homers), but Bryant’s production took a downturn after suffering a bone bruise in his left shoulder, which is believed to have happened when he slid headfirst into first base (!) on May 19 (not the first time he’s injured himself in such fashion). Though it would be just over a month before he went on the disabled list for the first of two stays totaling 57 days, he hit just .252/.338/.382 (96 wRC+) with five homers in 272 PA from May 20 onward, decidedly non-Bryant-like numbers. By Dr. Mike Tanner’s calculations, from the point of that May 19 date, Bryant’s exit velocity dipped by five miles per hour, and his average fly ball distance decreased by 28 feet.

After rest and rehab for his shoulder, Bryant declared in February, “I’m back to who I am,” but until he got to Arizona, his power and overall production had been similarly meager (.232/.364/.366, 102 wRC+). Even now, his .229/.353/.417 (108 wRC+) line isn’t particularly robust. He’s walking more often relative to last year’s overall numbers (12.1%, up from 10.5%) while suffering a fall-off in batting average on balls in play (.264, down from .342). His exit velocity — never his strong suit despite his power — is up relative to last year, but so is his groundball rate:

Kris Bryant via Statcast
Season GB/FB GB% FB% EV LA Hard Hit%
2015 0.76 34.2% 45.2% 89.6 19.4 43.3
2016 0.67 30.5% 45.8% 89.3 20.9 38.9
2017 0.89 37.7% 42.4% 87.1 16.9 36.4
2018 0.84 34.0% 40.7% 85.8 17.7 33.5
2019 1.00 40.0% 41.3% 88.8 16.7 34.7
SOURCE: Baseball Savant

Thus far in 2019, Bryant has produced 75 batted balls, five short of the point where the stat starts to stabilize, so we can’t make definitive assertions, but one thing that stands out is that while his pull rate is about the same as last year, an increasing percentage of those pulled balls have been grounders, which are far less productive than pulled fly balls:

Kris Bryant When Pulling the Ball
Season BBE Pull% wOBA Pull-GB% wOBA Pull-FB% wOBA
2015 365 41.6% .596 21.4% .246 9.0% 1.095
2016 452 46.7% .579 20.4% .193 13.9% .969
2017 427 41.2% .542 23.9% .211 7.5% 1.086
2018 285 48.1% .503 24.6% .222 9.5% .936
2019 75 46.7% .297 30.7% .097 5.3% .494

Even when Bryant does pull fly balls, he’s not getting typical results, though since we can literally count those times on one hand thus far — four of them according to our splits, which are based on Sports Info Solution data, but only three via Statcast’s data — that’s less important than the sheer drop in frequency. That two of those pulled fly balls were in Arizona, namely the homer off Ray and Sunday’s sacrifice fly off Matt Andriese, may be a sign he’s coming around.

Bryant has gone to the opposite field with more frequency and productivity than before, at least in the air, though it hasn’t come close to matching his results when he pulls the ball:

Kris Bryant When Going Oppo
Season BBE Oppo% wOBA Oppo-GB% wOBA Oppo-FB% wOBA
2015 365 23.8% .330 3.0% .320 18.4% .279
2016 452 19.7% .174 2.0% .293 14.4% .090
2017 427 22.5% .280 2.6% .239 17.3% .192
2018 285 20.0% .303 3.9% .273 11.9% .195
2019 75 32.0% .406 5.3% .219 24.0% .425

A few weeks ago, The Athletic’s Sahadev Sharma noted that Bryant’s mechanics were out of whack, quoting scouts describing him as “lunging,” with one saying, “He’s falling all over the plate.” Via Sharma, from the start of 2016 to the day of the aforementioned shoulder injury, Bryant had slugged .731 on pitches Statcast defines as being over the heart of the plate (I get .728 using the same parameters). For the remainder of the 2018 season through April 25, the point prior to the Arizona series, he slugged just .474 on such pitches. With this weekend’s pair of homers, he raised that nearly-yearlong figure to .514; separating his full 2018 and ’19 seasons, the numbers are .558 and .615, respectively.

Beyond that, while he whiffed on 3.4% of such pitches last year, he’s up to 4.8% this year, 0.1% off the career high from his rookie season, before he successfully tamed his swing, but only one of this year’s 21 swings and misses from the heart of the plate has taken place since April 19, yet another good sign.

It would be premature to say that Bryant is back to where he was as a hitter, and it’s probably worth noting that even with Chase Field’s humidor in place, fly balls are traveling farther there this year than last (331 feet, up from 329), and farther than at Wrigley Field in either season (321 this year, 315 last year). Still, for a Cubs team that has been scoring 5.5 runs per game but is struggling to escape the pull of .500, the possibility that he’s turned the corner could be a major key in the NL Central race.

Kevin Gausman, Bob Scanlan, and Matt Shoemaker Reflect on Their Splitters

Pitchers learn and develop different pitches, and they do so at varying stages of their lives. It might be a curveball in high school, a cutter in college, or a changeup in A-ball. Sometimes the addition or refinement is a natural progression — graduating from Pitching 101 to advanced course work — and often it’s a matter of necessity. In order to get hitters out as the quality of competition improves, a pitcher needs to optimize his repertoire.

In this installment of the series, we’ll hear from three pitchers — Kevin Gausman, Bob Scanlan, and Matt Shoemaker — on how they learned and developed their splitters.

———

Kevin Gausman, Atlanta Braves

“I want to say I started throwing it my sophomore year of high school. I had a coach at the time who had pitched — his name is Chris Baum — and he had been trying to teach me a circle changeup. I couldn’t really figure it out, so he showed me this fosh, this split-change, that I throw now.

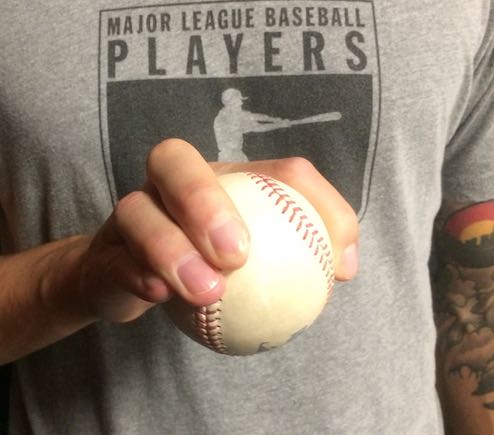
Kevin Gausman splitter grip.

“It was a pretty frustrating pitch at first, because it’s tough to gain consistency with. He kind of told me from Day One, ‘Hey, if you keep throwing it, you’ll eventually have a feel for it.’ I trusted him, and he was right. It’s a big weapon for me.

“The only thing I’ve really changed is where my thumb is on the ball. I’ll kind of mess around with it when I want to throw a strike, or when I don’t want to throw a strike. Moving the thumb affects the speed, and how much break, and tilt, you get on the pitch. If my thumb is under it, it’s going to be a little bit straighter. When my thumb is on the side of it, it might be a little bigger, with more fading action. Read the rest of this entry »


The Atlantic League Utilizes the No-Shift Rule for the First Time

One of the most popular idioms in the English language is “guinea pig.” It’s simple — we’ve probably all used it — and yet it means so much. To be a “guinea pig” is to be the subject of something new or different. It can be as simple as being the first to try a new toothbrush, and range to something as weighty as testing a new drug.

In baseball terms, the Atlantic League is serving as Major League Baseball’s guinea pig this season. In a deal struck in early-March, the two organizations agreed to change certain rules for the Atlantic League’s 2019 championship season as a way to test said modifications before MLB considers implementing them itself.

One of the more contentious rule changes was the prohibition of the infield shift. The rule itself, as explained in the press release, was simply the requirement of “two infielders to be on each side of second base when a pitch is released.” If the rule is broken, “the ball is dead and the umpire shall call a ball.”

Well, last Thursday, the Atlantic League’s Opening Day, the anti-shift rule was utilized in a game between the Southern Maryland Blue Crabs and the Sugar Land Skeeters. Former big leaguer James Loney (remember him?) was at the plate in the bottom of the fourth inning. On the first pitch from Blue Crabs righty Daryl Thompson, Loney hit a soft ground ball to second baseman Angelys Nina, who easily threw him out at first to begin the inning. Read the rest of this entry »


Paul DeJong Counters Strikeouts with Aggression

So here’s a thing you might see if you looked at our FanGraphs Leaderboards this morning.

MLB WAR Leaderboard
Name PA AVG OBP SLG WAR
Cody Bellinger 108 .424 .500 .891 2.5
Christian Yelich 112 .326 .438 .793 2.0
Mike Trout 96 .303 .510 .636 1.9
Paul DeJong 108 .343 .398 .626 1.7
Matt Chapman 108 .311 .407 .633 1.5
Jorge Polanco 92 .366 .424 .695 1.4
Anthony Rendon 82 .371 .451 .771 1.4
Hunter Dozier 86 .324 .430 .676 1.3
Javier Baez 98 .312 .347 .656 1.3
Through 4/24/2019

That Mike Trout isn’t yet leading baseball is a surprise, and an indication that we still need some time before we start touting potential MVP candidates. Cody Bellinger is having a big year, but he put up a 138 wRC+ and four-win season when he was 21 years old. Christian Yelich was sixth in WAR last season and won MVP. Matt Chapman was seventh in WAR a year ago, Anthony Rendon was ninth, and Javier Baez was 14th. Jorge Polanco and Hunter Dozier are certainly shockers, but they are lower on this list than Paul DeJong, so it’s the Cardinals shortstop who is getting a post as he heads toward what could be his breakout season at 25 years old.

When we do an initial look at DeJong’s numbers, his .387 BABIP jumps out as unsustainable. DeJong isn’t going to put up a .343 batting average all season long. He’s not going to put up a 169 wRC+ all season long, either. He doesn’t need to in order to be one of the better players in the league, though. Since the start of last season, DeJong is just shy of 600 plate appearances and put up five wins, one of the top-30 marks in baseball despite being several hundred plate appearances behind much of the league due to a fractured left hand that cost him two months last year. DeJong’s .283 ISO does look a bit higher than we might reasonably expect, but with a .219 career ISO entering the season, it’s not like he has been without power. Even if DeJong were to drop 50 points a piece in BABIP and ISO, we’d still be looking at a player whose bat is about 30% above league average to go along with an above-average glove at shortstop. That would be roughly a six-win player, which seems rather unexpected for Paul DeJong. Read the rest of this entry »


Zack Greinke Is Hitting Like Barry Bonds

Marcell Ozuna has had a solid start to his 2019 season. Through 89 plate appearances, Ozuna has hit .256/.348/.615 (150 wRC+) with eight home runs, producing 0.6 WAR. Ozuna’s WAR total puts him in the 67th percentile among qualified hitters to begin the year; that’s not elite, though it’s certainly not bad, either.

But what if I told you that there is a pitcher who has produced as much position player value as Marcell Ozuna, as Nelson Cruz, as Jean Segura, Whit Merrifield, Byron Buxton, Jay Bruce, Mike Moustakas, and a host of other solid hitters? Would you believe me? Could you guess who it is?

One of the (few) fun things about small sample baseball season is the ridiculous numbers that come from it. Jay Jaffe already covered some of these blips from both the pitcher and hitter perspective, but there’s one overlapping case that, at least to me, was worth discussing in its own separate piece, the answer to the above questions, perhaps obvious given this piece’s title: Zack Greinke.

This whole idea came about when I was glancing over the Statcast leaderboards at Baseball Savant a few days ago. At the time, the default setting on the hitter numbers was just 10 batted ball events, allowing for some smaller samples to sneak their way into prominent positions on the board. But there’s no position more prominent than No. 1, and seeing Greinke leading all major league hitters in barrels per plate appearance made me chuckle. It also made me take a second look at his season stats this year.

In 13 plate appearances, Greinke has slashed .500/.545/1.300 (361 wRC+). He has hit two home runs, two doubles, and a single, all while drawing a walk without registering a single strikeout. That’s better than Barry Bonds‘ slash line after 13 plate appearances (.400/.538/.900) in 2004, when he went on to post a ridiculous 1.422 full-season OPS. Let’s marvel at that for a second while we watch Greinke’s two home runs. Read the rest of this entry »


The Fastest Freeze in History

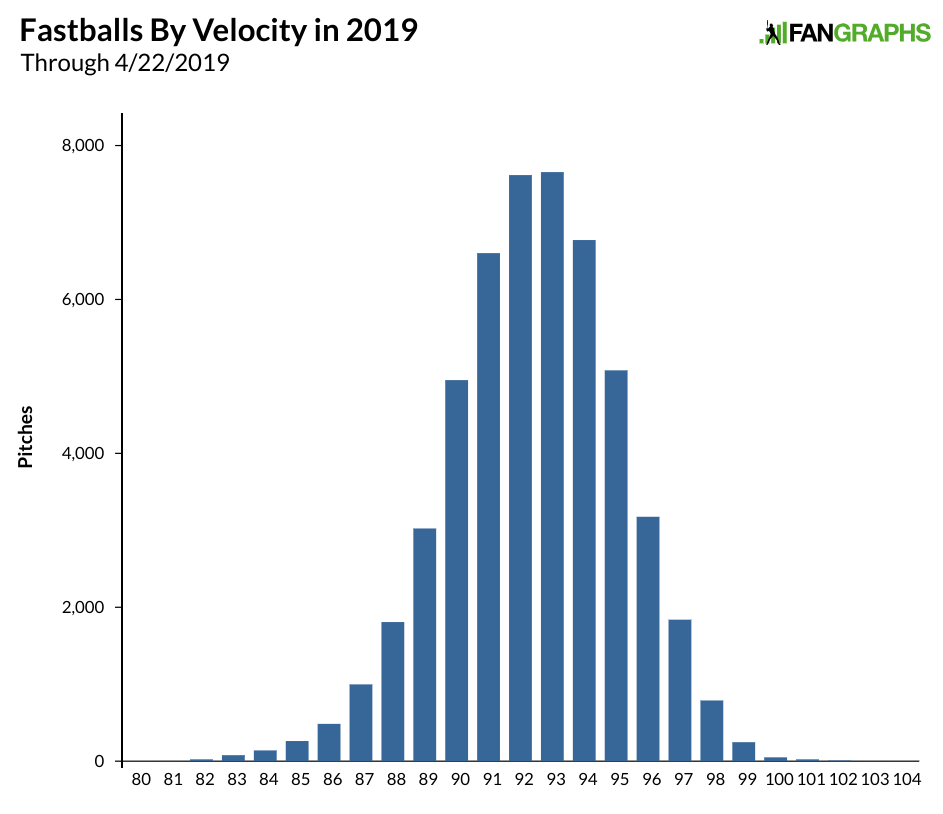
All major league pitchers throw pretty hard, and on average, fastballs are hitting close to 93 miles per hour these days. Pitchers throwing 95 seems common-place, and we regularly see pitches in the upper-90s. Pitchers throwing the ball really hard seems routine, but that should make us appreciate pitchers throwing the hardest even more. As pitch velocities get higher and higher, there are still upper limits, and the players who tend to reach those upper limits seem to find themselves alone. Right now, Jordan Hicks is alone.

The graph below represents all the fastballs thrown, except those by J.R. Murphy, this season.

It might be difficult to see the bars at 102 mph and above, so here’s a chart showing those pitches.

Fastest MLB Pitches in 2019
Player Date MPH
Jordan Hicks 4/21 104.2
Jordan Hicks 4/21 103.7
Jordan Hicks 4/21 103
Jordan Hicks 4/21 102.8
Jordan Hicks 4/21 102.4
Jordan Hicks 4/17 102.3
Jordan Hicks 4/21 102.1
Jordan Hicks 4/7 102.1
Jordan Hicks 4/17 102.1
Jordan Hicks 4/17 102
SOURCE: Baseball Savant

And to further clarify matters, here’s the average fastball velocity for pitchers with at least 10 fastballs this season.

Fastest MLB Pitchers in 2019
Player Fastballs Avg Fastball Velocity
Jordan Hicks 71 100.5 MPH
Jose Alvarado 147 98.3 MPH
Tayron Guerrero 127 98.3 MPH
Ryan Helsley 28 98.2 MPH
Felipe Vazquez 129 98.1 MPH
Diego Castillo 76 98.0 MPH
Ryne Stanek 109 97.7 MPH
Trevor Rosenthal 90 97.7 MPH
Lou Trivino 64 97.6 MPH
Noah Syndergaard 292 97.6 MPH
Robert Stock 69 97.6 MPH
Aroldis Chapman 106 97.5 MPH
SOURCE: Baseball Savant

Read the rest of this entry »